| Multiple Linear Regression - Estimated Regression Equation |
| WLH[t] = + 348.4 + 49.6M1[t] + 68.4M2[t] + 63.8M3[t] + 35.6M4[t] + 33.4M5[t] + 45.2M6[t] + 54M7[t] + 4.40000000000003M8[t] + 14.6M9[t] + 15.4M10[t] + 24.4M11[t] + e[t] |
| Multiple Linear Regression - Ordinary Least Squares | |||||
| Variable | Parameter | S.D. | T-STAT H0: parameter = 0 | 2-tail p-value | 1-tail p-value |
| (Intercept) | 348.4 | 32.787981 | 10.6258 | 0 | 0 |
| M1 | 49.6 | 46.369207 | 1.0697 | 0.290115 | 0.145058 |
| M2 | 68.4 | 46.369207 | 1.4751 | 0.146711 | 0.073355 |
| M3 | 63.8 | 46.369207 | 1.3759 | 0.175235 | 0.087617 |
| M4 | 35.6 | 46.369207 | 0.7678 | 0.446396 | 0.223198 |
| M5 | 33.4 | 46.369207 | 0.7203 | 0.47483 | 0.237415 |
| M6 | 45.2 | 46.369207 | 0.9748 | 0.334554 | 0.167277 |
| M7 | 54 | 46.369207 | 1.1646 | 0.24995 | 0.124975 |
| M8 | 4.40000000000003 | 46.369207 | 0.0949 | 0.924797 | 0.462398 |
| M9 | 14.6 | 46.369207 | 0.3149 | 0.75423 | 0.377115 |
| M10 | 15.4 | 46.369207 | 0.3321 | 0.741247 | 0.370623 |
| M11 | 24.4 | 46.369207 | 0.5262 | 0.601164 | 0.300582 |
| Multiple Linear Regression - Regression Statistics | |
| Multiple R | 0.315135434788893 |
| R-squared | 0.0993103422595844 |
| Adjusted R-squared | -0.107097704305928 |
| F-TEST (value) | 0.481136001779195 |
| F-TEST (DF numerator) | 11 |
| F-TEST (DF denominator) | 48 |
| p-value | 0.905866078322301 |
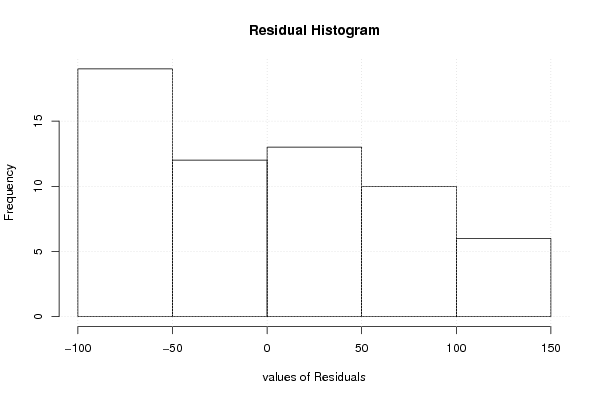
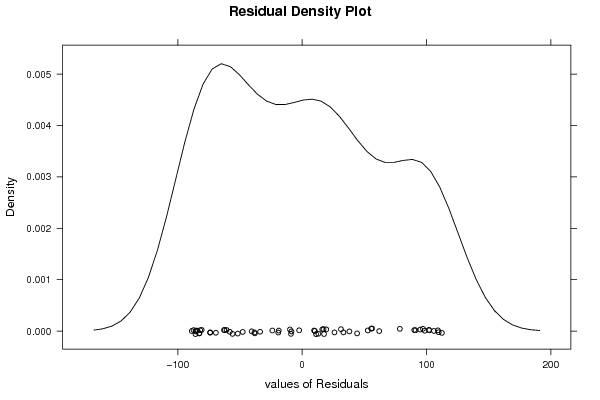
| Multiple Linear Regression - Residual Statistics | |
| Residual Standard Deviation | 73.3161532906176 |
| Sum Squared Residuals | 258012.4 |
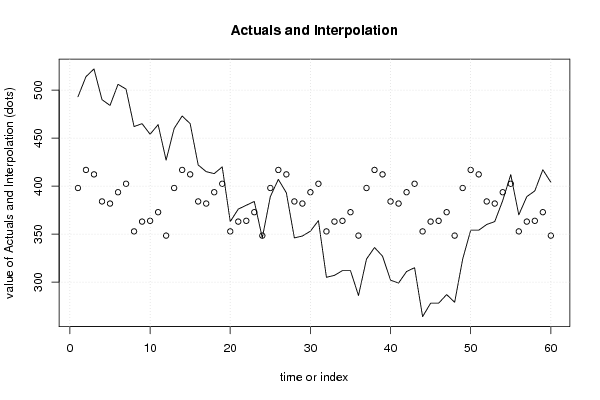
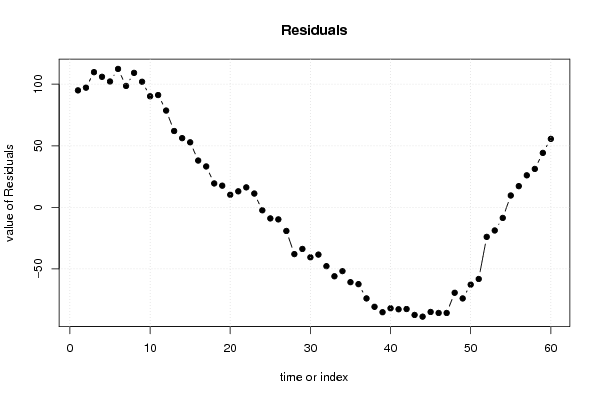
| Multiple Linear Regression - Actuals, Interpolation, and Residuals | |||
| Time or Index | Actuals | Interpolation Forecast | Residuals Prediction Error |
| 1 | 493 | 398 | 94.9999999999998 |
| 2 | 514 | 416.8 | 97.2 |
| 3 | 522 | 412.2 | 109.8 |
| 4 | 490 | 384 | 106 |
| 5 | 484 | 381.8 | 102.2 |
| 6 | 506 | 393.6 | 112.4 |
| 7 | 501 | 402.4 | 98.6 |
| 8 | 462 | 352.8 | 109.2 |
| 9 | 465 | 363 | 102 |
| 10 | 454 | 363.8 | 90.2 |
| 11 | 464 | 372.8 | 91.2 |
| 12 | 427 | 348.4 | 78.6 |
| 13 | 460 | 398 | 62 |
| 14 | 473 | 416.8 | 56.2 |
| 15 | 465 | 412.2 | 52.8 |
| 16 | 422 | 384 | 38 |
| 17 | 415 | 381.8 | 33.2 |
| 18 | 413 | 393.6 | 19.4 |
| 19 | 420 | 402.4 | 17.6 |
| 20 | 363 | 352.8 | 10.2 |
| 21 | 376 | 363 | 13 |
| 22 | 380 | 363.8 | 16.2 |
| 23 | 384 | 372.8 | 11.2 |
| 24 | 346 | 348.4 | -2.39999999999996 |
| 25 | 389 | 398 | -8.99999999999995 |
| 26 | 407 | 416.8 | -9.79999999999999 |
| 27 | 393 | 412.2 | -19.2 |
| 28 | 346 | 384 | -38 |
| 29 | 348 | 381.8 | -33.8 |
| 30 | 353 | 393.6 | -40.6 |
| 31 | 364 | 402.4 | -38.4 |
| 32 | 305 | 352.8 | -47.8 |
| 33 | 307 | 363 | -56 |
| 34 | 312 | 363.8 | -51.8 |
| 35 | 312 | 372.8 | -60.8 |
| 36 | 286 | 348.4 | -62.4 |
| 37 | 324 | 398 | -74 |
| 38 | 336 | 416.8 | -80.8 |
| 39 | 327 | 412.2 | -85.2 |
| 40 | 302 | 384 | -82 |
| 41 | 299 | 381.8 | -82.8 |
| 42 | 311 | 393.6 | -82.6 |
| 43 | 315 | 402.4 | -87.4 |
| 44 | 264 | 352.8 | -88.8 |
| 45 | 278 | 363 | -85 |
| 46 | 278 | 363.8 | -85.8 |
| 47 | 287 | 372.8 | -85.8 |
| 48 | 279 | 348.4 | -69.4 |
| 49 | 324 | 398 | -74 |
| 50 | 354 | 416.8 | -62.8 |
| 51 | 354 | 412.2 | -58.2 |
| 52 | 360 | 384 | -24 |
| 53 | 363 | 381.8 | -18.8 |
| 54 | 385 | 393.6 | -8.60000000000001 |
| 55 | 412 | 402.4 | 9.59999999999999 |
| 56 | 370 | 352.8 | 17.2 |
| 57 | 389 | 363 | 26 |
| 58 | 395 | 363.8 | 31.2 |
| 59 | 417 | 372.8 | 44.2 |
| 60 | 404 | 348.4 | 55.6 |
| Goldfeld-Quandt test for Heteroskedasticity | |||
| p-values | Alternative Hypothesis | ||
| breakpoint index | greater | 2-sided | less |
| 15 | 0.250201563459611 | 0.500403126919223 | 0.749798436540389 |
| 16 | 0.306671458718974 | 0.613342917437948 | 0.693328541281026 |
| 17 | 0.349849233124161 | 0.699698466248323 | 0.650150766875839 |
| 18 | 0.477894279103105 | 0.95578855820621 | 0.522105720896895 |
| 19 | 0.522306510721075 | 0.95538697855785 | 0.477693489278925 |
| 20 | 0.608914616405925 | 0.78217076718815 | 0.391085383594075 |
| 21 | 0.645282175791988 | 0.709435648416025 | 0.354717824208013 |
| 22 | 0.641794806559986 | 0.716410386880028 | 0.358205193440014 |
| 23 | 0.643092209534623 | 0.713815580930753 | 0.356907790465377 |
| 24 | 0.62826820598732 | 0.743463588025361 | 0.371731794012681 |
| 25 | 0.678297593434487 | 0.643404813131026 | 0.321702406565513 |
| 26 | 0.713428165590686 | 0.573143668818629 | 0.286571834409314 |
| 27 | 0.755525264174805 | 0.488949471650391 | 0.244474735825195 |
| 28 | 0.778434655400833 | 0.443130689198333 | 0.221565344599167 |
| 29 | 0.7781387686149 | 0.4437224627702 | 0.2218612313851 |
| 30 | 0.774434166845593 | 0.451131666308815 | 0.225565833154407 |
| 31 | 0.75197679087696 | 0.496046418246081 | 0.24802320912304 |
| 32 | 0.736330834754512 | 0.527338330490976 | 0.263669165245488 |
| 33 | 0.7247085094689 | 0.5505829810622 | 0.2752914905311 |
| 34 | 0.696020841166978 | 0.607958317666043 | 0.303979158833022 |
| 35 | 0.676411850366838 | 0.647176299266324 | 0.323588149633162 |
| 36 | 0.654544628679444 | 0.690910742641113 | 0.345455371320556 |
| 37 | 0.621489164985639 | 0.757021670028722 | 0.378510835014361 |
| 38 | 0.585154555915809 | 0.829690888168382 | 0.414845444084191 |
| 39 | 0.54432867329992 | 0.91134265340016 | 0.45567132670008 |
| 40 | 0.499647012313934 | 0.999294024627869 | 0.500352987686066 |
| 41 | 0.450946880547574 | 0.901893761095149 | 0.549053119452426 |
| 42 | 0.401655409968224 | 0.803310819936449 | 0.598344590031776 |
| 43 | 0.374223036857242 | 0.748446073714484 | 0.625776963142758 |
| 44 | 0.352087494694144 | 0.704174989388288 | 0.647912505305856 |
| 45 | 0.325840846457549 | 0.651681692915097 | 0.674159153542451 |
| Meta Analysis of Goldfeld-Quandt test for Heteroskedasticity | |||
| Description | # significant tests | % significant tests | OK/NOK |
| 1% type I error level | 0 | 0 | OK |
| 5% type I error level | 0 | 0 | OK |
| 10% type I error level | 0 | 0 | OK |