Free Statistics

of Irreproducible Research!

Author's title

Author*The author of this computation has been verified*
R Software Modulerwasp_multipleregression.wasp
Title produced by softwareMultiple Regression
Date of computationSat, 25 Dec 2010 20:21:24 +0000
Cite this page as followsStatistical Computations at FreeStatistics.org, Office for Research Development and Education, URL https://freestatistics.org/blog/index.php?v=date/2010/Dec/25/t1293308463gns0v94lwao7sxu.htm/, Retrieved Sun, 28 Apr 2024 19:19:21 +0000
Statistical Computations at FreeStatistics.org, Office for Research Development and Education, URL https://freestatistics.org/blog/index.php?pk=115446, Retrieved Sun, 28 Apr 2024 19:19:21 +0000
QR Codes:

Original text written by user:
IsPrivate?No (this computation is public)
User-defined keywords
Estimated Impact155
Family? (F = Feedback message, R = changed R code, M = changed R Module, P = changed Parameters, D = changed Data)
-     [Multiple Regression] [Q1 The Seatbeltlaw] [2007-11-14 19:27:43] [8cd6641b921d30ebe00b648d1481bba0]
- RM D  [Multiple Regression] [Seatbelt] [2009-11-12 14:06:21] [b98453cac15ba1066b407e146608df68]
- R PD    [Multiple Regression] [] [2009-11-19 08:06:13] [639dd97b6eeebe46a3c92d62cb04fb95]
-   PD        [Multiple Regression] [Multiple regressi...] [2010-12-25 20:21:24] [d42b17bf3b3c0d56878eb3f5a4351e6d] [Current]
-    D          [Multiple Regression] [] [2010-12-27 13:24:06] [1ec36cc0fd92fd0f07d0b885ce2c369b]
Feedback Forum

Post a new message
Dataseries X:
493
514
522
490
484
506
501
462
465
454
464
427
460
473
465
422
415
413
420
363
376
380
384
346
389
407
393
346
348
353
364
305
307
312
312
286
324
336
327
302
299
311
315
264
278
278
287
279
324
354
354
360
363
385
412
370
389
395
417
404


Summary of computational transaction
Raw Inputview raw input (R code)
Raw Outputview raw output of R engine
Computing time4 seconds
R Server'RServer@AstonUniversity' @ vre.aston.ac.uk

\begin{tabular}{lllllllll}
\hline
Summary of computational transaction \tabularnewline
Raw Input & view raw input (R code)  \tabularnewline
Raw Output & view raw output of R engine  \tabularnewline
Computing time & 4 seconds \tabularnewline
R Server & 'RServer@AstonUniversity' @ vre.aston.ac.uk \tabularnewline
\hline
\end{tabular}
%Source: https://freestatistics.org/blog/index.php?pk=115446&T=0

[TABLE]
[ROW][C]Summary of computational transaction[/C][/ROW]
[ROW][C]Raw Input[/C][C]view raw input (R code) [/C][/ROW]
[ROW][C]Raw Output[/C][C]view raw output of R engine [/C][/ROW]
[ROW][C]Computing time[/C][C]4 seconds[/C][/ROW]
[ROW][C]R Server[/C][C]'RServer@AstonUniversity' @ vre.aston.ac.uk[/C][/ROW]
[/TABLE]
Source: https://freestatistics.org/blog/index.php?pk=115446&T=0

Globally Unique Identifier (entire table): ba.freestatistics.org/blog/index.php?pk=115446&T=0

As an alternative you can also use a QR Code:  

The GUIDs for individual cells are displayed in the table below:

Summary of computational transaction
Raw Inputview raw input (R code)
Raw Outputview raw output of R engine
Computing time4 seconds
R Server'RServer@AstonUniversity' @ vre.aston.ac.uk


Multiple Linear Regression - Estimated Regression Equation
WLH[t] = + 348.4 + 49.6M1[t] + 68.4M2[t] + 63.8M3[t] + 35.6M4[t] + 33.4M5[t] + 45.2M6[t] + 54M7[t] + 4.40000000000003M8[t] + 14.6M9[t] + 15.4M10[t] + 24.4M11[t] + e[t]

\begin{tabular}{lllllllll}
\hline
Multiple Linear Regression - Estimated Regression Equation \tabularnewline
WLH[t] =  +  348.4 +  49.6M1[t] +  68.4M2[t] +  63.8M3[t] +  35.6M4[t] +  33.4M5[t] +  45.2M6[t] +  54M7[t] +  4.40000000000003M8[t] +  14.6M9[t] +  15.4M10[t] +  24.4M11[t]  + e[t] \tabularnewline
\hline
\end{tabular}
%Source: https://freestatistics.org/blog/index.php?pk=115446&T=1

[TABLE]
[ROW][C]Multiple Linear Regression - Estimated Regression Equation[/C][/ROW]
[ROW][C]WLH[t] =  +  348.4 +  49.6M1[t] +  68.4M2[t] +  63.8M3[t] +  35.6M4[t] +  33.4M5[t] +  45.2M6[t] +  54M7[t] +  4.40000000000003M8[t] +  14.6M9[t] +  15.4M10[t] +  24.4M11[t]  + e[t][/C][/ROW]
[/TABLE]
Source: https://freestatistics.org/blog/index.php?pk=115446&T=1

Globally Unique Identifier (entire table): ba.freestatistics.org/blog/index.php?pk=115446&T=1

As an alternative you can also use a QR Code:  

The GUIDs for individual cells are displayed in the table below:

Multiple Linear Regression - Estimated Regression Equation
WLH[t] = + 348.4 + 49.6M1[t] + 68.4M2[t] + 63.8M3[t] + 35.6M4[t] + 33.4M5[t] + 45.2M6[t] + 54M7[t] + 4.40000000000003M8[t] + 14.6M9[t] + 15.4M10[t] + 24.4M11[t] + e[t]


Multiple Linear Regression - Ordinary Least Squares
VariableParameterS.D.T-STATH0: parameter = 02-tail p-value1-tail p-value
(Intercept)348.432.78798110.625800
M149.646.3692071.06970.2901150.145058
M268.446.3692071.47510.1467110.073355
M363.846.3692071.37590.1752350.087617
M435.646.3692070.76780.4463960.223198
M533.446.3692070.72030.474830.237415
M645.246.3692070.97480.3345540.167277
M75446.3692071.16460.249950.124975
M84.4000000000000346.3692070.09490.9247970.462398
M914.646.3692070.31490.754230.377115
M1015.446.3692070.33210.7412470.370623
M1124.446.3692070.52620.6011640.300582

\begin{tabular}{lllllllll}
\hline
Multiple Linear Regression - Ordinary Least Squares \tabularnewline
Variable & Parameter & S.D. & T-STATH0: parameter = 0 & 2-tail p-value & 1-tail p-value \tabularnewline
(Intercept) & 348.4 & 32.787981 & 10.6258 & 0 & 0 \tabularnewline
M1 & 49.6 & 46.369207 & 1.0697 & 0.290115 & 0.145058 \tabularnewline
M2 & 68.4 & 46.369207 & 1.4751 & 0.146711 & 0.073355 \tabularnewline
M3 & 63.8 & 46.369207 & 1.3759 & 0.175235 & 0.087617 \tabularnewline
M4 & 35.6 & 46.369207 & 0.7678 & 0.446396 & 0.223198 \tabularnewline
M5 & 33.4 & 46.369207 & 0.7203 & 0.47483 & 0.237415 \tabularnewline
M6 & 45.2 & 46.369207 & 0.9748 & 0.334554 & 0.167277 \tabularnewline
M7 & 54 & 46.369207 & 1.1646 & 0.24995 & 0.124975 \tabularnewline
M8 & 4.40000000000003 & 46.369207 & 0.0949 & 0.924797 & 0.462398 \tabularnewline
M9 & 14.6 & 46.369207 & 0.3149 & 0.75423 & 0.377115 \tabularnewline
M10 & 15.4 & 46.369207 & 0.3321 & 0.741247 & 0.370623 \tabularnewline
M11 & 24.4 & 46.369207 & 0.5262 & 0.601164 & 0.300582 \tabularnewline
\hline
\end{tabular}
%Source: https://freestatistics.org/blog/index.php?pk=115446&T=2

[TABLE]
[ROW][C]Multiple Linear Regression - Ordinary Least Squares[/C][/ROW]
[ROW][C]Variable[/C][C]Parameter[/C][C]S.D.[/C][C]T-STATH0: parameter = 0[/C][C]2-tail p-value[/C][C]1-tail p-value[/C][/ROW]
[ROW][C](Intercept)[/C][C]348.4[/C][C]32.787981[/C][C]10.6258[/C][C]0[/C][C]0[/C][/ROW]
[ROW][C]M1[/C][C]49.6[/C][C]46.369207[/C][C]1.0697[/C][C]0.290115[/C][C]0.145058[/C][/ROW]
[ROW][C]M2[/C][C]68.4[/C][C]46.369207[/C][C]1.4751[/C][C]0.146711[/C][C]0.073355[/C][/ROW]
[ROW][C]M3[/C][C]63.8[/C][C]46.369207[/C][C]1.3759[/C][C]0.175235[/C][C]0.087617[/C][/ROW]
[ROW][C]M4[/C][C]35.6[/C][C]46.369207[/C][C]0.7678[/C][C]0.446396[/C][C]0.223198[/C][/ROW]
[ROW][C]M5[/C][C]33.4[/C][C]46.369207[/C][C]0.7203[/C][C]0.47483[/C][C]0.237415[/C][/ROW]
[ROW][C]M6[/C][C]45.2[/C][C]46.369207[/C][C]0.9748[/C][C]0.334554[/C][C]0.167277[/C][/ROW]
[ROW][C]M7[/C][C]54[/C][C]46.369207[/C][C]1.1646[/C][C]0.24995[/C][C]0.124975[/C][/ROW]
[ROW][C]M8[/C][C]4.40000000000003[/C][C]46.369207[/C][C]0.0949[/C][C]0.924797[/C][C]0.462398[/C][/ROW]
[ROW][C]M9[/C][C]14.6[/C][C]46.369207[/C][C]0.3149[/C][C]0.75423[/C][C]0.377115[/C][/ROW]
[ROW][C]M10[/C][C]15.4[/C][C]46.369207[/C][C]0.3321[/C][C]0.741247[/C][C]0.370623[/C][/ROW]
[ROW][C]M11[/C][C]24.4[/C][C]46.369207[/C][C]0.5262[/C][C]0.601164[/C][C]0.300582[/C][/ROW]
[/TABLE]
Source: https://freestatistics.org/blog/index.php?pk=115446&T=2

Globally Unique Identifier (entire table): ba.freestatistics.org/blog/index.php?pk=115446&T=2

As an alternative you can also use a QR Code:  

The GUIDs for individual cells are displayed in the table below:

Multiple Linear Regression - Ordinary Least Squares
VariableParameterS.D.T-STATH0: parameter = 02-tail p-value1-tail p-value
(Intercept)348.432.78798110.625800
M149.646.3692071.06970.2901150.145058
M268.446.3692071.47510.1467110.073355
M363.846.3692071.37590.1752350.087617
M435.646.3692070.76780.4463960.223198
M533.446.3692070.72030.474830.237415
M645.246.3692070.97480.3345540.167277
M75446.3692071.16460.249950.124975
M84.4000000000000346.3692070.09490.9247970.462398
M914.646.3692070.31490.754230.377115
M1015.446.3692070.33210.7412470.370623
M1124.446.3692070.52620.6011640.300582


Multiple Linear Regression - Regression Statistics
Multiple R0.315135434788893
R-squared0.0993103422595844
Adjusted R-squared-0.107097704305928
F-TEST (value)0.481136001779195
F-TEST (DF numerator)11
F-TEST (DF denominator)48
p-value0.905866078322301
Multiple Linear Regression - Residual Statistics
Residual Standard Deviation73.3161532906176
Sum Squared Residuals258012.4

\begin{tabular}{lllllllll}
\hline
Multiple Linear Regression - Regression Statistics \tabularnewline
Multiple R & 0.315135434788893 \tabularnewline
R-squared & 0.0993103422595844 \tabularnewline
Adjusted R-squared & -0.107097704305928 \tabularnewline
F-TEST (value) & 0.481136001779195 \tabularnewline
F-TEST (DF numerator) & 11 \tabularnewline
F-TEST (DF denominator) & 48 \tabularnewline
p-value & 0.905866078322301 \tabularnewline
Multiple Linear Regression - Residual Statistics \tabularnewline
Residual Standard Deviation & 73.3161532906176 \tabularnewline
Sum Squared Residuals & 258012.4 \tabularnewline
\hline
\end{tabular}
%Source: https://freestatistics.org/blog/index.php?pk=115446&T=3

[TABLE]
[ROW][C]Multiple Linear Regression - Regression Statistics[/C][/ROW]
[ROW][C]Multiple R[/C][C]0.315135434788893[/C][/ROW]
[ROW][C]R-squared[/C][C]0.0993103422595844[/C][/ROW]
[ROW][C]Adjusted R-squared[/C][C]-0.107097704305928[/C][/ROW]
[ROW][C]F-TEST (value)[/C][C]0.481136001779195[/C][/ROW]
[ROW][C]F-TEST (DF numerator)[/C][C]11[/C][/ROW]
[ROW][C]F-TEST (DF denominator)[/C][C]48[/C][/ROW]
[ROW][C]p-value[/C][C]0.905866078322301[/C][/ROW]
[ROW][C]Multiple Linear Regression - Residual Statistics[/C][/ROW]
[ROW][C]Residual Standard Deviation[/C][C]73.3161532906176[/C][/ROW]
[ROW][C]Sum Squared Residuals[/C][C]258012.4[/C][/ROW]
[/TABLE]
Source: https://freestatistics.org/blog/index.php?pk=115446&T=3

Globally Unique Identifier (entire table): ba.freestatistics.org/blog/index.php?pk=115446&T=3

As an alternative you can also use a QR Code:  

The GUIDs for individual cells are displayed in the table below:

Multiple Linear Regression - Regression Statistics
Multiple R0.315135434788893
R-squared0.0993103422595844
Adjusted R-squared-0.107097704305928
F-TEST (value)0.481136001779195
F-TEST (DF numerator)11
F-TEST (DF denominator)48
p-value0.905866078322301
Multiple Linear Regression - Residual Statistics
Residual Standard Deviation73.3161532906176
Sum Squared Residuals258012.4


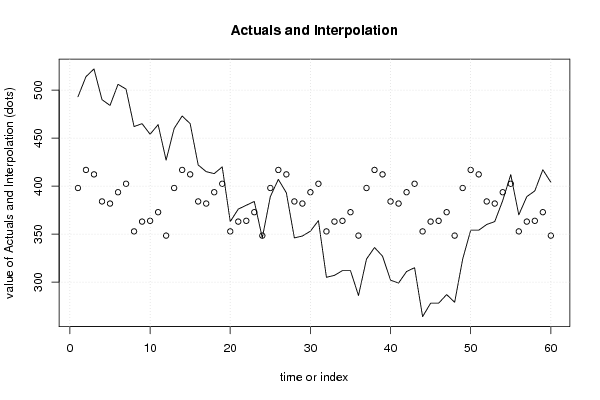
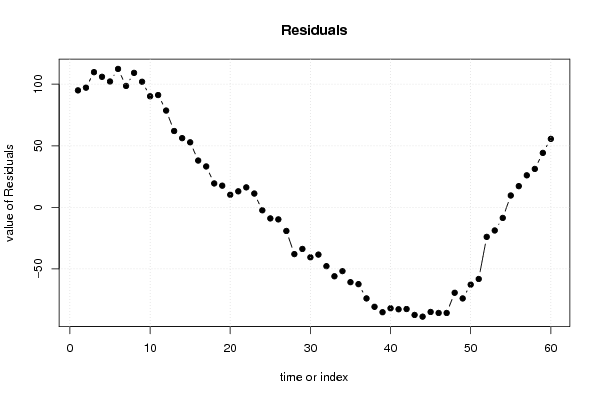
Multiple Linear Regression - Actuals, Interpolation, and Residuals
Time or IndexActualsInterpolationForecastResidualsPrediction Error
149339894.9999999999998
2514416.897.2
3522412.2109.8
4490384106
5484381.8102.2
6506393.6112.4
7501402.498.6
8462352.8109.2
9465363102
10454363.890.2
11464372.891.2
12427348.478.6
1346039862
14473416.856.2
15465412.252.8
1642238438
17415381.833.2
18413393.619.4
19420402.417.6
20363352.810.2
2137636313
22380363.816.2
23384372.811.2
24346348.4-2.39999999999996
25389398-8.99999999999995
26407416.8-9.79999999999999
27393412.2-19.2
28346384-38
29348381.8-33.8
30353393.6-40.6
31364402.4-38.4
32305352.8-47.8
33307363-56
34312363.8-51.8
35312372.8-60.8
36286348.4-62.4
37324398-74
38336416.8-80.8
39327412.2-85.2
40302384-82
41299381.8-82.8
42311393.6-82.6
43315402.4-87.4
44264352.8-88.8
45278363-85
46278363.8-85.8
47287372.8-85.8
48279348.4-69.4
49324398-74
50354416.8-62.8
51354412.2-58.2
52360384-24
53363381.8-18.8
54385393.6-8.60000000000001
55412402.49.59999999999999
56370352.817.2
5738936326
58395363.831.2
59417372.844.2
60404348.455.6

\begin{tabular}{lllllllll}
\hline
Multiple Linear Regression - Actuals, Interpolation, and Residuals \tabularnewline
Time or Index & Actuals & InterpolationForecast & ResidualsPrediction Error \tabularnewline
1 & 493 & 398 & 94.9999999999998 \tabularnewline
2 & 514 & 416.8 & 97.2 \tabularnewline
3 & 522 & 412.2 & 109.8 \tabularnewline
4 & 490 & 384 & 106 \tabularnewline
5 & 484 & 381.8 & 102.2 \tabularnewline
6 & 506 & 393.6 & 112.4 \tabularnewline
7 & 501 & 402.4 & 98.6 \tabularnewline
8 & 462 & 352.8 & 109.2 \tabularnewline
9 & 465 & 363 & 102 \tabularnewline
10 & 454 & 363.8 & 90.2 \tabularnewline
11 & 464 & 372.8 & 91.2 \tabularnewline
12 & 427 & 348.4 & 78.6 \tabularnewline
13 & 460 & 398 & 62 \tabularnewline
14 & 473 & 416.8 & 56.2 \tabularnewline
15 & 465 & 412.2 & 52.8 \tabularnewline
16 & 422 & 384 & 38 \tabularnewline
17 & 415 & 381.8 & 33.2 \tabularnewline
18 & 413 & 393.6 & 19.4 \tabularnewline
19 & 420 & 402.4 & 17.6 \tabularnewline
20 & 363 & 352.8 & 10.2 \tabularnewline
21 & 376 & 363 & 13 \tabularnewline
22 & 380 & 363.8 & 16.2 \tabularnewline
23 & 384 & 372.8 & 11.2 \tabularnewline
24 & 346 & 348.4 & -2.39999999999996 \tabularnewline
25 & 389 & 398 & -8.99999999999995 \tabularnewline
26 & 407 & 416.8 & -9.79999999999999 \tabularnewline
27 & 393 & 412.2 & -19.2 \tabularnewline
28 & 346 & 384 & -38 \tabularnewline
29 & 348 & 381.8 & -33.8 \tabularnewline
30 & 353 & 393.6 & -40.6 \tabularnewline
31 & 364 & 402.4 & -38.4 \tabularnewline
32 & 305 & 352.8 & -47.8 \tabularnewline
33 & 307 & 363 & -56 \tabularnewline
34 & 312 & 363.8 & -51.8 \tabularnewline
35 & 312 & 372.8 & -60.8 \tabularnewline
36 & 286 & 348.4 & -62.4 \tabularnewline
37 & 324 & 398 & -74 \tabularnewline
38 & 336 & 416.8 & -80.8 \tabularnewline
39 & 327 & 412.2 & -85.2 \tabularnewline
40 & 302 & 384 & -82 \tabularnewline
41 & 299 & 381.8 & -82.8 \tabularnewline
42 & 311 & 393.6 & -82.6 \tabularnewline
43 & 315 & 402.4 & -87.4 \tabularnewline
44 & 264 & 352.8 & -88.8 \tabularnewline
45 & 278 & 363 & -85 \tabularnewline
46 & 278 & 363.8 & -85.8 \tabularnewline
47 & 287 & 372.8 & -85.8 \tabularnewline
48 & 279 & 348.4 & -69.4 \tabularnewline
49 & 324 & 398 & -74 \tabularnewline
50 & 354 & 416.8 & -62.8 \tabularnewline
51 & 354 & 412.2 & -58.2 \tabularnewline
52 & 360 & 384 & -24 \tabularnewline
53 & 363 & 381.8 & -18.8 \tabularnewline
54 & 385 & 393.6 & -8.60000000000001 \tabularnewline
55 & 412 & 402.4 & 9.59999999999999 \tabularnewline
56 & 370 & 352.8 & 17.2 \tabularnewline
57 & 389 & 363 & 26 \tabularnewline
58 & 395 & 363.8 & 31.2 \tabularnewline
59 & 417 & 372.8 & 44.2 \tabularnewline
60 & 404 & 348.4 & 55.6 \tabularnewline
\hline
\end{tabular}
%Source: https://freestatistics.org/blog/index.php?pk=115446&T=4

[TABLE]
[ROW][C]Multiple Linear Regression - Actuals, Interpolation, and Residuals[/C][/ROW]
[ROW][C]Time or Index[/C][C]Actuals[/C][C]InterpolationForecast[/C][C]ResidualsPrediction Error[/C][/ROW]
[ROW][C]1[/C][C]493[/C][C]398[/C][C]94.9999999999998[/C][/ROW]
[ROW][C]2[/C][C]514[/C][C]416.8[/C][C]97.2[/C][/ROW]
[ROW][C]3[/C][C]522[/C][C]412.2[/C][C]109.8[/C][/ROW]
[ROW][C]4[/C][C]490[/C][C]384[/C][C]106[/C][/ROW]
[ROW][C]5[/C][C]484[/C][C]381.8[/C][C]102.2[/C][/ROW]
[ROW][C]6[/C][C]506[/C][C]393.6[/C][C]112.4[/C][/ROW]
[ROW][C]7[/C][C]501[/C][C]402.4[/C][C]98.6[/C][/ROW]
[ROW][C]8[/C][C]462[/C][C]352.8[/C][C]109.2[/C][/ROW]
[ROW][C]9[/C][C]465[/C][C]363[/C][C]102[/C][/ROW]
[ROW][C]10[/C][C]454[/C][C]363.8[/C][C]90.2[/C][/ROW]
[ROW][C]11[/C][C]464[/C][C]372.8[/C][C]91.2[/C][/ROW]
[ROW][C]12[/C][C]427[/C][C]348.4[/C][C]78.6[/C][/ROW]
[ROW][C]13[/C][C]460[/C][C]398[/C][C]62[/C][/ROW]
[ROW][C]14[/C][C]473[/C][C]416.8[/C][C]56.2[/C][/ROW]
[ROW][C]15[/C][C]465[/C][C]412.2[/C][C]52.8[/C][/ROW]
[ROW][C]16[/C][C]422[/C][C]384[/C][C]38[/C][/ROW]
[ROW][C]17[/C][C]415[/C][C]381.8[/C][C]33.2[/C][/ROW]
[ROW][C]18[/C][C]413[/C][C]393.6[/C][C]19.4[/C][/ROW]
[ROW][C]19[/C][C]420[/C][C]402.4[/C][C]17.6[/C][/ROW]
[ROW][C]20[/C][C]363[/C][C]352.8[/C][C]10.2[/C][/ROW]
[ROW][C]21[/C][C]376[/C][C]363[/C][C]13[/C][/ROW]
[ROW][C]22[/C][C]380[/C][C]363.8[/C][C]16.2[/C][/ROW]
[ROW][C]23[/C][C]384[/C][C]372.8[/C][C]11.2[/C][/ROW]
[ROW][C]24[/C][C]346[/C][C]348.4[/C][C]-2.39999999999996[/C][/ROW]
[ROW][C]25[/C][C]389[/C][C]398[/C][C]-8.99999999999995[/C][/ROW]
[ROW][C]26[/C][C]407[/C][C]416.8[/C][C]-9.79999999999999[/C][/ROW]
[ROW][C]27[/C][C]393[/C][C]412.2[/C][C]-19.2[/C][/ROW]
[ROW][C]28[/C][C]346[/C][C]384[/C][C]-38[/C][/ROW]
[ROW][C]29[/C][C]348[/C][C]381.8[/C][C]-33.8[/C][/ROW]
[ROW][C]30[/C][C]353[/C][C]393.6[/C][C]-40.6[/C][/ROW]
[ROW][C]31[/C][C]364[/C][C]402.4[/C][C]-38.4[/C][/ROW]
[ROW][C]32[/C][C]305[/C][C]352.8[/C][C]-47.8[/C][/ROW]
[ROW][C]33[/C][C]307[/C][C]363[/C][C]-56[/C][/ROW]
[ROW][C]34[/C][C]312[/C][C]363.8[/C][C]-51.8[/C][/ROW]
[ROW][C]35[/C][C]312[/C][C]372.8[/C][C]-60.8[/C][/ROW]
[ROW][C]36[/C][C]286[/C][C]348.4[/C][C]-62.4[/C][/ROW]
[ROW][C]37[/C][C]324[/C][C]398[/C][C]-74[/C][/ROW]
[ROW][C]38[/C][C]336[/C][C]416.8[/C][C]-80.8[/C][/ROW]
[ROW][C]39[/C][C]327[/C][C]412.2[/C][C]-85.2[/C][/ROW]
[ROW][C]40[/C][C]302[/C][C]384[/C][C]-82[/C][/ROW]
[ROW][C]41[/C][C]299[/C][C]381.8[/C][C]-82.8[/C][/ROW]
[ROW][C]42[/C][C]311[/C][C]393.6[/C][C]-82.6[/C][/ROW]
[ROW][C]43[/C][C]315[/C][C]402.4[/C][C]-87.4[/C][/ROW]
[ROW][C]44[/C][C]264[/C][C]352.8[/C][C]-88.8[/C][/ROW]
[ROW][C]45[/C][C]278[/C][C]363[/C][C]-85[/C][/ROW]
[ROW][C]46[/C][C]278[/C][C]363.8[/C][C]-85.8[/C][/ROW]
[ROW][C]47[/C][C]287[/C][C]372.8[/C][C]-85.8[/C][/ROW]
[ROW][C]48[/C][C]279[/C][C]348.4[/C][C]-69.4[/C][/ROW]
[ROW][C]49[/C][C]324[/C][C]398[/C][C]-74[/C][/ROW]
[ROW][C]50[/C][C]354[/C][C]416.8[/C][C]-62.8[/C][/ROW]
[ROW][C]51[/C][C]354[/C][C]412.2[/C][C]-58.2[/C][/ROW]
[ROW][C]52[/C][C]360[/C][C]384[/C][C]-24[/C][/ROW]
[ROW][C]53[/C][C]363[/C][C]381.8[/C][C]-18.8[/C][/ROW]
[ROW][C]54[/C][C]385[/C][C]393.6[/C][C]-8.60000000000001[/C][/ROW]
[ROW][C]55[/C][C]412[/C][C]402.4[/C][C]9.59999999999999[/C][/ROW]
[ROW][C]56[/C][C]370[/C][C]352.8[/C][C]17.2[/C][/ROW]
[ROW][C]57[/C][C]389[/C][C]363[/C][C]26[/C][/ROW]
[ROW][C]58[/C][C]395[/C][C]363.8[/C][C]31.2[/C][/ROW]
[ROW][C]59[/C][C]417[/C][C]372.8[/C][C]44.2[/C][/ROW]
[ROW][C]60[/C][C]404[/C][C]348.4[/C][C]55.6[/C][/ROW]
[/TABLE]
Source: https://freestatistics.org/blog/index.php?pk=115446&T=4

Globally Unique Identifier (entire table): ba.freestatistics.org/blog/index.php?pk=115446&T=4

As an alternative you can also use a QR Code:  

The GUIDs for individual cells are displayed in the table below:

Multiple Linear Regression - Actuals, Interpolation, and Residuals
Time or IndexActualsInterpolationForecastResidualsPrediction Error
149339894.9999999999998
2514416.897.2
3522412.2109.8
4490384106
5484381.8102.2
6506393.6112.4
7501402.498.6
8462352.8109.2
9465363102
10454363.890.2
11464372.891.2
12427348.478.6
1346039862
14473416.856.2
15465412.252.8
1642238438
17415381.833.2
18413393.619.4
19420402.417.6
20363352.810.2
2137636313
22380363.816.2
23384372.811.2
24346348.4-2.39999999999996
25389398-8.99999999999995
26407416.8-9.79999999999999
27393412.2-19.2
28346384-38
29348381.8-33.8
30353393.6-40.6
31364402.4-38.4
32305352.8-47.8
33307363-56
34312363.8-51.8
35312372.8-60.8
36286348.4-62.4
37324398-74
38336416.8-80.8
39327412.2-85.2
40302384-82
41299381.8-82.8
42311393.6-82.6
43315402.4-87.4
44264352.8-88.8
45278363-85
46278363.8-85.8
47287372.8-85.8
48279348.4-69.4
49324398-74
50354416.8-62.8
51354412.2-58.2
52360384-24
53363381.8-18.8
54385393.6-8.60000000000001
55412402.49.59999999999999
56370352.817.2
5738936326
58395363.831.2
59417372.844.2
60404348.455.6


Goldfeld-Quandt test for Heteroskedasticity
p-valuesAlternative Hypothesis
breakpoint indexgreater2-sidedless
150.2502015634596110.5004031269192230.749798436540389
160.3066714587189740.6133429174379480.693328541281026
170.3498492331241610.6996984662483230.650150766875839
180.4778942791031050.955788558206210.522105720896895
190.5223065107210750.955386978557850.477693489278925
200.6089146164059250.782170767188150.391085383594075
210.6452821757919880.7094356484160250.354717824208013
220.6417948065599860.7164103868800280.358205193440014
230.6430922095346230.7138155809307530.356907790465377
240.628268205987320.7434635880253610.371731794012681
250.6782975934344870.6434048131310260.321702406565513
260.7134281655906860.5731436688186290.286571834409314
270.7555252641748050.4889494716503910.244474735825195
280.7784346554008330.4431306891983330.221565344599167
290.77813876861490.44372246277020.2218612313851
300.7744341668455930.4511316663088150.225565833154407
310.751976790876960.4960464182460810.24802320912304
320.7363308347545120.5273383304909760.263669165245488
330.72470850946890.55058298106220.2752914905311
340.6960208411669780.6079583176660430.303979158833022
350.6764118503668380.6471762992663240.323588149633162
360.6545446286794440.6909107426411130.345455371320556
370.6214891649856390.7570216700287220.378510835014361
380.5851545559158090.8296908881683820.414845444084191
390.544328673299920.911342653400160.45567132670008
400.4996470123139340.9992940246278690.500352987686066
410.4509468805475740.9018937610951490.549053119452426
420.4016554099682240.8033108199364490.598344590031776
430.3742230368572420.7484460737144840.625776963142758
440.3520874946941440.7041749893882880.647912505305856
450.3258408464575490.6516816929150970.674159153542451

\begin{tabular}{lllllllll}
\hline
Goldfeld-Quandt test for Heteroskedasticity \tabularnewline
p-values & Alternative Hypothesis \tabularnewline
breakpoint index & greater & 2-sided & less \tabularnewline
15 & 0.250201563459611 & 0.500403126919223 & 0.749798436540389 \tabularnewline
16 & 0.306671458718974 & 0.613342917437948 & 0.693328541281026 \tabularnewline
17 & 0.349849233124161 & 0.699698466248323 & 0.650150766875839 \tabularnewline
18 & 0.477894279103105 & 0.95578855820621 & 0.522105720896895 \tabularnewline
19 & 0.522306510721075 & 0.95538697855785 & 0.477693489278925 \tabularnewline
20 & 0.608914616405925 & 0.78217076718815 & 0.391085383594075 \tabularnewline
21 & 0.645282175791988 & 0.709435648416025 & 0.354717824208013 \tabularnewline
22 & 0.641794806559986 & 0.716410386880028 & 0.358205193440014 \tabularnewline
23 & 0.643092209534623 & 0.713815580930753 & 0.356907790465377 \tabularnewline
24 & 0.62826820598732 & 0.743463588025361 & 0.371731794012681 \tabularnewline
25 & 0.678297593434487 & 0.643404813131026 & 0.321702406565513 \tabularnewline
26 & 0.713428165590686 & 0.573143668818629 & 0.286571834409314 \tabularnewline
27 & 0.755525264174805 & 0.488949471650391 & 0.244474735825195 \tabularnewline
28 & 0.778434655400833 & 0.443130689198333 & 0.221565344599167 \tabularnewline
29 & 0.7781387686149 & 0.4437224627702 & 0.2218612313851 \tabularnewline
30 & 0.774434166845593 & 0.451131666308815 & 0.225565833154407 \tabularnewline
31 & 0.75197679087696 & 0.496046418246081 & 0.24802320912304 \tabularnewline
32 & 0.736330834754512 & 0.527338330490976 & 0.263669165245488 \tabularnewline
33 & 0.7247085094689 & 0.5505829810622 & 0.2752914905311 \tabularnewline
34 & 0.696020841166978 & 0.607958317666043 & 0.303979158833022 \tabularnewline
35 & 0.676411850366838 & 0.647176299266324 & 0.323588149633162 \tabularnewline
36 & 0.654544628679444 & 0.690910742641113 & 0.345455371320556 \tabularnewline
37 & 0.621489164985639 & 0.757021670028722 & 0.378510835014361 \tabularnewline
38 & 0.585154555915809 & 0.829690888168382 & 0.414845444084191 \tabularnewline
39 & 0.54432867329992 & 0.91134265340016 & 0.45567132670008 \tabularnewline
40 & 0.499647012313934 & 0.999294024627869 & 0.500352987686066 \tabularnewline
41 & 0.450946880547574 & 0.901893761095149 & 0.549053119452426 \tabularnewline
42 & 0.401655409968224 & 0.803310819936449 & 0.598344590031776 \tabularnewline
43 & 0.374223036857242 & 0.748446073714484 & 0.625776963142758 \tabularnewline
44 & 0.352087494694144 & 0.704174989388288 & 0.647912505305856 \tabularnewline
45 & 0.325840846457549 & 0.651681692915097 & 0.674159153542451 \tabularnewline
\hline
\end{tabular}
%Source: https://freestatistics.org/blog/index.php?pk=115446&T=5

[TABLE]
[ROW][C]Goldfeld-Quandt test for Heteroskedasticity[/C][/ROW]
[ROW][C]p-values[/C][C]Alternative Hypothesis[/C][/ROW]
[ROW][C]breakpoint index[/C][C]greater[/C][C]2-sided[/C][C]less[/C][/ROW]
[ROW][C]15[/C][C]0.250201563459611[/C][C]0.500403126919223[/C][C]0.749798436540389[/C][/ROW]
[ROW][C]16[/C][C]0.306671458718974[/C][C]0.613342917437948[/C][C]0.693328541281026[/C][/ROW]
[ROW][C]17[/C][C]0.349849233124161[/C][C]0.699698466248323[/C][C]0.650150766875839[/C][/ROW]
[ROW][C]18[/C][C]0.477894279103105[/C][C]0.95578855820621[/C][C]0.522105720896895[/C][/ROW]
[ROW][C]19[/C][C]0.522306510721075[/C][C]0.95538697855785[/C][C]0.477693489278925[/C][/ROW]
[ROW][C]20[/C][C]0.608914616405925[/C][C]0.78217076718815[/C][C]0.391085383594075[/C][/ROW]
[ROW][C]21[/C][C]0.645282175791988[/C][C]0.709435648416025[/C][C]0.354717824208013[/C][/ROW]
[ROW][C]22[/C][C]0.641794806559986[/C][C]0.716410386880028[/C][C]0.358205193440014[/C][/ROW]
[ROW][C]23[/C][C]0.643092209534623[/C][C]0.713815580930753[/C][C]0.356907790465377[/C][/ROW]
[ROW][C]24[/C][C]0.62826820598732[/C][C]0.743463588025361[/C][C]0.371731794012681[/C][/ROW]
[ROW][C]25[/C][C]0.678297593434487[/C][C]0.643404813131026[/C][C]0.321702406565513[/C][/ROW]
[ROW][C]26[/C][C]0.713428165590686[/C][C]0.573143668818629[/C][C]0.286571834409314[/C][/ROW]
[ROW][C]27[/C][C]0.755525264174805[/C][C]0.488949471650391[/C][C]0.244474735825195[/C][/ROW]
[ROW][C]28[/C][C]0.778434655400833[/C][C]0.443130689198333[/C][C]0.221565344599167[/C][/ROW]
[ROW][C]29[/C][C]0.7781387686149[/C][C]0.4437224627702[/C][C]0.2218612313851[/C][/ROW]
[ROW][C]30[/C][C]0.774434166845593[/C][C]0.451131666308815[/C][C]0.225565833154407[/C][/ROW]
[ROW][C]31[/C][C]0.75197679087696[/C][C]0.496046418246081[/C][C]0.24802320912304[/C][/ROW]
[ROW][C]32[/C][C]0.736330834754512[/C][C]0.527338330490976[/C][C]0.263669165245488[/C][/ROW]
[ROW][C]33[/C][C]0.7247085094689[/C][C]0.5505829810622[/C][C]0.2752914905311[/C][/ROW]
[ROW][C]34[/C][C]0.696020841166978[/C][C]0.607958317666043[/C][C]0.303979158833022[/C][/ROW]
[ROW][C]35[/C][C]0.676411850366838[/C][C]0.647176299266324[/C][C]0.323588149633162[/C][/ROW]
[ROW][C]36[/C][C]0.654544628679444[/C][C]0.690910742641113[/C][C]0.345455371320556[/C][/ROW]
[ROW][C]37[/C][C]0.621489164985639[/C][C]0.757021670028722[/C][C]0.378510835014361[/C][/ROW]
[ROW][C]38[/C][C]0.585154555915809[/C][C]0.829690888168382[/C][C]0.414845444084191[/C][/ROW]
[ROW][C]39[/C][C]0.54432867329992[/C][C]0.91134265340016[/C][C]0.45567132670008[/C][/ROW]
[ROW][C]40[/C][C]0.499647012313934[/C][C]0.999294024627869[/C][C]0.500352987686066[/C][/ROW]
[ROW][C]41[/C][C]0.450946880547574[/C][C]0.901893761095149[/C][C]0.549053119452426[/C][/ROW]
[ROW][C]42[/C][C]0.401655409968224[/C][C]0.803310819936449[/C][C]0.598344590031776[/C][/ROW]
[ROW][C]43[/C][C]0.374223036857242[/C][C]0.748446073714484[/C][C]0.625776963142758[/C][/ROW]
[ROW][C]44[/C][C]0.352087494694144[/C][C]0.704174989388288[/C][C]0.647912505305856[/C][/ROW]
[ROW][C]45[/C][C]0.325840846457549[/C][C]0.651681692915097[/C][C]0.674159153542451[/C][/ROW]
[/TABLE]
Source: https://freestatistics.org/blog/index.php?pk=115446&T=5

Globally Unique Identifier (entire table): ba.freestatistics.org/blog/index.php?pk=115446&T=5

As an alternative you can also use a QR Code:  

The GUIDs for individual cells are displayed in the table below:

Goldfeld-Quandt test for Heteroskedasticity
p-valuesAlternative Hypothesis
breakpoint indexgreater2-sidedless
150.2502015634596110.5004031269192230.749798436540389
160.3066714587189740.6133429174379480.693328541281026
170.3498492331241610.6996984662483230.650150766875839
180.4778942791031050.955788558206210.522105720896895
190.5223065107210750.955386978557850.477693489278925
200.6089146164059250.782170767188150.391085383594075
210.6452821757919880.7094356484160250.354717824208013
220.6417948065599860.7164103868800280.358205193440014
230.6430922095346230.7138155809307530.356907790465377
240.628268205987320.7434635880253610.371731794012681
250.6782975934344870.6434048131310260.321702406565513
260.7134281655906860.5731436688186290.286571834409314
270.7555252641748050.4889494716503910.244474735825195
280.7784346554008330.4431306891983330.221565344599167
290.77813876861490.44372246277020.2218612313851
300.7744341668455930.4511316663088150.225565833154407
310.751976790876960.4960464182460810.24802320912304
320.7363308347545120.5273383304909760.263669165245488
330.72470850946890.55058298106220.2752914905311
340.6960208411669780.6079583176660430.303979158833022
350.6764118503668380.6471762992663240.323588149633162
360.6545446286794440.6909107426411130.345455371320556
370.6214891649856390.7570216700287220.378510835014361
380.5851545559158090.8296908881683820.414845444084191
390.544328673299920.911342653400160.45567132670008
400.4996470123139340.9992940246278690.500352987686066
410.4509468805475740.9018937610951490.549053119452426
420.4016554099682240.8033108199364490.598344590031776
430.3742230368572420.7484460737144840.625776963142758
440.3520874946941440.7041749893882880.647912505305856
450.3258408464575490.6516816929150970.674159153542451


Meta Analysis of Goldfeld-Quandt test for Heteroskedasticity
Description# significant tests% significant testsOK/NOK
1% type I error level00OK
5% type I error level00OK
10% type I error level00OK

\begin{tabular}{lllllllll}
\hline
Meta Analysis of Goldfeld-Quandt test for Heteroskedasticity \tabularnewline
Description & # significant tests & % significant tests & OK/NOK \tabularnewline
1% type I error level & 0 & 0 & OK \tabularnewline
5% type I error level & 0 & 0 & OK \tabularnewline
10% type I error level & 0 & 0 & OK \tabularnewline
\hline
\end{tabular}
%Source: https://freestatistics.org/blog/index.php?pk=115446&T=6

[TABLE]
[ROW][C]Meta Analysis of Goldfeld-Quandt test for Heteroskedasticity[/C][/ROW]
[ROW][C]Description[/C][C]# significant tests[/C][C]% significant tests[/C][C]OK/NOK[/C][/ROW]
[ROW][C]1% type I error level[/C][C]0[/C][C]0[/C][C]OK[/C][/ROW]
[ROW][C]5% type I error level[/C][C]0[/C][C]0[/C][C]OK[/C][/ROW]
[ROW][C]10% type I error level[/C][C]0[/C][C]0[/C][C]OK[/C][/ROW]
[/TABLE]
Source: https://freestatistics.org/blog/index.php?pk=115446&T=6

Globally Unique Identifier (entire table): ba.freestatistics.org/blog/index.php?pk=115446&T=6

As an alternative you can also use a QR Code:  

The GUIDs for individual cells are displayed in the table below:

Meta Analysis of Goldfeld-Quandt test for Heteroskedasticity
Description# significant tests% significant testsOK/NOK
1% type I error level00OK
5% type I error level00OK
10% type I error level00OK


Parameters (Session):
par1 = 1 ; par2 = Include Monthly Dummies ; par3 = No Linear Trend ;
Parameters (R input):
par1 = 1 ; par2 = Include Monthly Dummies ; par3 = No Linear Trend ;
R code (references can be found in the software module):
library(lattice)
library(lmtest)
n25 <- 25 #minimum number of obs. for Goldfeld-Quandt test
par1 <- as.numeric(par1)
x <- t(y)
k <- length(x[1,])
n <- length(x[,1])
x1 <- cbind(x[,par1], x[,1:k!=par1])
mycolnames <- c(colnames(x)[par1], colnames(x)[1:k!=par1])
colnames(x1) <- mycolnames #colnames(x)[par1]
x <- x1
if (par3 == 'First Differences'){
x2 <- array(0, dim=c(n-1,k), dimnames=list(1:(n-1), paste('(1-B)',colnames(x),sep='')))
for (i in 1:n-1) {
for (j in 1:k) {
x2[i,j] <- x[i+1,j] - x[i,j]
}
}
x <- x2
}
if (par2 == 'Include Monthly Dummies'){
x2 <- array(0, dim=c(n,11), dimnames=list(1:n, paste('M', seq(1:11), sep ='')))
for (i in 1:11){
x2[seq(i,n,12),i] <- 1
}
x <- cbind(x, x2)
}
if (par2 == 'Include Quarterly Dummies'){
x2 <- array(0, dim=c(n,3), dimnames=list(1:n, paste('Q', seq(1:3), sep ='')))
for (i in 1:3){
x2[seq(i,n,4),i] <- 1
}
x <- cbind(x, x2)
}
k <- length(x[1,])
if (par3 == 'Linear Trend'){
x <- cbind(x, c(1:n))
colnames(x)[k+1] <- 't'
}
x
k <- length(x[1,])
df <- as.data.frame(x)
(mylm <- lm(df))
(mysum <- summary(mylm))
if (n > n25) {
kp3 <- k + 3
nmkm3 <- n - k - 3
gqarr <- array(NA, dim=c(nmkm3-kp3+1,3))
numgqtests <- 0
numsignificant1 <- 0
numsignificant5 <- 0
numsignificant10 <- 0
for (mypoint in kp3:nmkm3) {
j <- 0
numgqtests <- numgqtests + 1
for (myalt in c('greater', 'two.sided', 'less')) {
j <- j + 1
gqarr[mypoint-kp3+1,j] <- gqtest(mylm, point=mypoint, alternative=myalt)$p.value
}
if (gqarr[mypoint-kp3+1,2] < 0.01) numsignificant1 <- numsignificant1 + 1
if (gqarr[mypoint-kp3+1,2] < 0.05) numsignificant5 <- numsignificant5 + 1
if (gqarr[mypoint-kp3+1,2] < 0.10) numsignificant10 <- numsignificant10 + 1
}
gqarr
}
bitmap(file='test0.png')
plot(x[,1], type='l', main='Actuals and Interpolation', ylab='value of Actuals and Interpolation (dots)', xlab='time or index')
points(x[,1]-mysum$resid)
grid()
dev.off()
bitmap(file='test1.png')
plot(mysum$resid, type='b', pch=19, main='Residuals', ylab='value of Residuals', xlab='time or index')
grid()
dev.off()
bitmap(file='test2.png')
hist(mysum$resid, main='Residual Histogram', xlab='values of Residuals')
grid()
dev.off()
bitmap(file='test3.png')
densityplot(~mysum$resid,col='black',main='Residual Density Plot', xlab='values of Residuals')
dev.off()
bitmap(file='test4.png')
qqnorm(mysum$resid, main='Residual Normal Q-Q Plot')
qqline(mysum$resid)
grid()
dev.off()
(myerror <- as.ts(mysum$resid))
bitmap(file='test5.png')
dum <- cbind(lag(myerror,k=1),myerror)
dum
dum1 <- dum[2:length(myerror),]
dum1
z <- as.data.frame(dum1)
z
plot(z,main=paste('Residual Lag plot, lowess, and regression line'), ylab='values of Residuals', xlab='lagged values of Residuals')
lines(lowess(z))
abline(lm(z))
grid()
dev.off()
bitmap(file='test6.png')
acf(mysum$resid, lag.max=length(mysum$resid)/2, main='Residual Autocorrelation Function')
grid()
dev.off()
bitmap(file='test7.png')
pacf(mysum$resid, lag.max=length(mysum$resid)/2, main='Residual Partial Autocorrelation Function')
grid()
dev.off()
bitmap(file='test8.png')
opar <- par(mfrow = c(2,2), oma = c(0, 0, 1.1, 0))
plot(mylm, las = 1, sub='Residual Diagnostics')
par(opar)
dev.off()
if (n > n25) {
bitmap(file='test9.png')
plot(kp3:nmkm3,gqarr[,2], main='Goldfeld-Quandt test',ylab='2-sided p-value',xlab='breakpoint')
grid()
dev.off()
}
load(file='createtable')
a<-table.start()
a<-table.row.start(a)
a<-table.element(a, 'Multiple Linear Regression - Estimated Regression Equation', 1, TRUE)
a<-table.row.end(a)
myeq <- colnames(x)[1]
myeq <- paste(myeq, '[t] = ', sep='')
for (i in 1:k){
if (mysum$coefficients[i,1] > 0) myeq <- paste(myeq, '+', '')
myeq <- paste(myeq, mysum$coefficients[i,1], sep=' ')
if (rownames(mysum$coefficients)[i] != '(Intercept)') {
myeq <- paste(myeq, rownames(mysum$coefficients)[i], sep='')
if (rownames(mysum$coefficients)[i] != 't') myeq <- paste(myeq, '[t]', sep='')
}
}
myeq <- paste(myeq, ' + e[t]')
a<-table.row.start(a)
a<-table.element(a, myeq)
a<-table.row.end(a)
a<-table.end(a)
table.save(a,file='mytable1.tab')
a<-table.start()
a<-table.row.start(a)
a<-table.element(a,hyperlink('ols1.htm','Multiple Linear Regression - Ordinary Least Squares',''), 6, TRUE)
a<-table.row.end(a)
a<-table.row.start(a)
a<-table.element(a,'Variable',header=TRUE)
a<-table.element(a,'Parameter',header=TRUE)
a<-table.element(a,'S.D.',header=TRUE)
a<-table.element(a,'T-STAT
H0: parameter = 0',header=TRUE)
a<-table.element(a,'2-tail p-value',header=TRUE)
a<-table.element(a,'1-tail p-value',header=TRUE)
a<-table.row.end(a)
for (i in 1:k){
a<-table.row.start(a)
a<-table.element(a,rownames(mysum$coefficients)[i],header=TRUE)
a<-table.element(a,mysum$coefficients[i,1])
a<-table.element(a, round(mysum$coefficients[i,2],6))
a<-table.element(a, round(mysum$coefficients[i,3],4))
a<-table.element(a, round(mysum$coefficients[i,4],6))
a<-table.element(a, round(mysum$coefficients[i,4]/2,6))
a<-table.row.end(a)
}
a<-table.end(a)
table.save(a,file='mytable2.tab')
a<-table.start()
a<-table.row.start(a)
a<-table.element(a, 'Multiple Linear Regression - Regression Statistics', 2, TRUE)
a<-table.row.end(a)
a<-table.row.start(a)
a<-table.element(a, 'Multiple R',1,TRUE)
a<-table.element(a, sqrt(mysum$r.squared))
a<-table.row.end(a)
a<-table.row.start(a)
a<-table.element(a, 'R-squared',1,TRUE)
a<-table.element(a, mysum$r.squared)
a<-table.row.end(a)
a<-table.row.start(a)
a<-table.element(a, 'Adjusted R-squared',1,TRUE)
a<-table.element(a, mysum$adj.r.squared)
a<-table.row.end(a)
a<-table.row.start(a)
a<-table.element(a, 'F-TEST (value)',1,TRUE)
a<-table.element(a, mysum$fstatistic[1])
a<-table.row.end(a)
a<-table.row.start(a)
a<-table.element(a, 'F-TEST (DF numerator)',1,TRUE)
a<-table.element(a, mysum$fstatistic[2])
a<-table.row.end(a)
a<-table.row.start(a)
a<-table.element(a, 'F-TEST (DF denominator)',1,TRUE)
a<-table.element(a, mysum$fstatistic[3])
a<-table.row.end(a)
a<-table.row.start(a)
a<-table.element(a, 'p-value',1,TRUE)
a<-table.element(a, 1-pf(mysum$fstatistic[1],mysum$fstatistic[2],mysum$fstatistic[3]))
a<-table.row.end(a)
a<-table.row.start(a)
a<-table.element(a, 'Multiple Linear Regression - Residual Statistics', 2, TRUE)
a<-table.row.end(a)
a<-table.row.start(a)
a<-table.element(a, 'Residual Standard Deviation',1,TRUE)
a<-table.element(a, mysum$sigma)
a<-table.row.end(a)
a<-table.row.start(a)
a<-table.element(a, 'Sum Squared Residuals',1,TRUE)
a<-table.element(a, sum(myerror*myerror))
a<-table.row.end(a)
a<-table.end(a)
table.save(a,file='mytable3.tab')
a<-table.start()
a<-table.row.start(a)
a<-table.element(a, 'Multiple Linear Regression - Actuals, Interpolation, and Residuals', 4, TRUE)
a<-table.row.end(a)
a<-table.row.start(a)
a<-table.element(a, 'Time or Index', 1, TRUE)
a<-table.element(a, 'Actuals', 1, TRUE)
a<-table.element(a, 'Interpolation
Forecast', 1, TRUE)
a<-table.element(a, 'Residuals
Prediction Error', 1, TRUE)
a<-table.row.end(a)
for (i in 1:n) {
a<-table.row.start(a)
a<-table.element(a,i, 1, TRUE)
a<-table.element(a,x[i])
a<-table.element(a,x[i]-mysum$resid[i])
a<-table.element(a,mysum$resid[i])
a<-table.row.end(a)
}
a<-table.end(a)
table.save(a,file='mytable4.tab')
if (n > n25) {
a<-table.start()
a<-table.row.start(a)
a<-table.element(a,'Goldfeld-Quandt test for Heteroskedasticity',4,TRUE)
a<-table.row.end(a)
a<-table.row.start(a)
a<-table.element(a,'p-values',header=TRUE)
a<-table.element(a,'Alternative Hypothesis',3,header=TRUE)
a<-table.row.end(a)
a<-table.row.start(a)
a<-table.element(a,'breakpoint index',header=TRUE)
a<-table.element(a,'greater',header=TRUE)
a<-table.element(a,'2-sided',header=TRUE)
a<-table.element(a,'less',header=TRUE)
a<-table.row.end(a)
for (mypoint in kp3:nmkm3) {
a<-table.row.start(a)
a<-table.element(a,mypoint,header=TRUE)
a<-table.element(a,gqarr[mypoint-kp3+1,1])
a<-table.element(a,gqarr[mypoint-kp3+1,2])
a<-table.element(a,gqarr[mypoint-kp3+1,3])
a<-table.row.end(a)
}
a<-table.end(a)
table.save(a,file='mytable5.tab')
a<-table.start()
a<-table.row.start(a)
a<-table.element(a,'Meta Analysis of Goldfeld-Quandt test for Heteroskedasticity',4,TRUE)
a<-table.row.end(a)
a<-table.row.start(a)
a<-table.element(a,'Description',header=TRUE)
a<-table.element(a,'# significant tests',header=TRUE)
a<-table.element(a,'% significant tests',header=TRUE)
a<-table.element(a,'OK/NOK',header=TRUE)
a<-table.row.end(a)
a<-table.row.start(a)
a<-table.element(a,'1% type I error level',header=TRUE)
a<-table.element(a,numsignificant1)
a<-table.element(a,numsignificant1/numgqtests)
if (numsignificant1/numgqtests < 0.01) dum <- 'OK' else dum <- 'NOK'
a<-table.element(a,dum)
a<-table.row.end(a)
a<-table.row.start(a)
a<-table.element(a,'5% type I error level',header=TRUE)
a<-table.element(a,numsignificant5)
a<-table.element(a,numsignificant5/numgqtests)
if (numsignificant5/numgqtests < 0.05) dum <- 'OK' else dum <- 'NOK'
a<-table.element(a,dum)
a<-table.row.end(a)
a<-table.row.start(a)
a<-table.element(a,'10% type I error level',header=TRUE)
a<-table.element(a,numsignificant10)
a<-table.element(a,numsignificant10/numgqtests)
if (numsignificant10/numgqtests < 0.1) dum <- 'OK' else dum <- 'NOK'
a<-table.element(a,dum)
a<-table.row.end(a)
a<-table.end(a)
table.save(a,file='mytable6.tab')
}