Free Statistics

of Irreproducible Research!

Author's title

Author*The author of this computation has been verified*
R Software Modulerwasp_multipleregression.wasp
Title produced by softwareMultiple Regression
Date of computationSat, 25 Dec 2010 19:33:12 +0000
Cite this page as followsStatistical Computations at FreeStatistics.org, Office for Research Development and Education, URL https://freestatistics.org/blog/index.php?v=date/2010/Dec/25/t1293305537hxb7qdvruxmcfzs.htm/, Retrieved Sun, 28 Apr 2024 21:40:37 +0000
Statistical Computations at FreeStatistics.org, Office for Research Development and Education, URL https://freestatistics.org/blog/index.php?pk=115443, Retrieved Sun, 28 Apr 2024 21:40:37 +0000
QR Codes:

Original text written by user:
IsPrivate?No (this computation is public)
User-defined keywords
Estimated Impact141
Family? (F = Feedback message, R = changed R code, M = changed R Module, P = changed Parameters, D = changed Data)
-     [Multiple Regression] [Q1 The Seatbeltlaw] [2007-11-14 19:27:43] [8cd6641b921d30ebe00b648d1481bba0]
- RMPD  [Multiple Regression] [Seatbelt] [2009-11-12 13:54:52] [b98453cac15ba1066b407e146608df68]
- R  D    [Multiple Regression] [Regressiemodel - ...] [2009-11-19 16:32:08] [54d83950395cfb8ca1091bdb7440f70a]
-    D        [Multiple Regression] [Regressie Analyse] [2010-12-25 19:33:12] [d42b17bf3b3c0d56878eb3f5a4351e6d] [Current]
Feedback Forum

Post a new message
Dataseries X:
493	797
514	840
522	988
490	819
484	831
506	904
501	814
462	798
465	828
454	789
464	930
427	744
460	832
473	826
465	907
422	776
415	835
413	715
420	729
363	733
376	736
380	712
384	711
346	667
389	799
407	661
393	692
346	649
348	729
353	622
364	671
305	635
307	648
312	745
312	624
286	477
324	710
336	515
327	461
302	590
299	415
311	554
315	585
264	513
278	591
278	561
287	684
279	668
324	795
354	776
354	1 043
360	964
363	762
385	1 030
412	939
370	779
389	918
395	839
417	874
404	840


Summary of computational transaction
Raw Inputview raw input (R code)
Raw Outputview raw output of R engine
Computing time6 seconds
R Server'Gwilym Jenkins' @ 72.249.127.135

\begin{tabular}{lllllllll}
\hline
Summary of computational transaction \tabularnewline
Raw Input & view raw input (R code)  \tabularnewline
Raw Output & view raw output of R engine  \tabularnewline
Computing time & 6 seconds \tabularnewline
R Server & 'Gwilym Jenkins' @ 72.249.127.135 \tabularnewline
\hline
\end{tabular}
%Source: https://freestatistics.org/blog/index.php?pk=115443&T=0

[TABLE]
[ROW][C]Summary of computational transaction[/C][/ROW]
[ROW][C]Raw Input[/C][C]view raw input (R code) [/C][/ROW]
[ROW][C]Raw Output[/C][C]view raw output of R engine [/C][/ROW]
[ROW][C]Computing time[/C][C]6 seconds[/C][/ROW]
[ROW][C]R Server[/C][C]'Gwilym Jenkins' @ 72.249.127.135[/C][/ROW]
[/TABLE]
Source: https://freestatistics.org/blog/index.php?pk=115443&T=0

Globally Unique Identifier (entire table): ba.freestatistics.org/blog/index.php?pk=115443&T=0

As an alternative you can also use a QR Code:  

The GUIDs for individual cells are displayed in the table below:

Summary of computational transaction
Raw Inputview raw input (R code)
Raw Outputview raw output of R engine
Computing time6 seconds
R Server'Gwilym Jenkins' @ 72.249.127.135


Multiple Linear Regression - Estimated Regression Equation
WLH[t] = + 238.252733996356 + 0.216708479297129Faill[t] + e[t]

\begin{tabular}{lllllllll}
\hline
Multiple Linear Regression - Estimated Regression Equation \tabularnewline
WLH[t] =  +  238.252733996356 +  0.216708479297129Faill[t]  + e[t] \tabularnewline
\hline
\end{tabular}
%Source: https://freestatistics.org/blog/index.php?pk=115443&T=1

[TABLE]
[ROW][C]Multiple Linear Regression - Estimated Regression Equation[/C][/ROW]
[ROW][C]WLH[t] =  +  238.252733996356 +  0.216708479297129Faill[t]  + e[t][/C][/ROW]
[/TABLE]
Source: https://freestatistics.org/blog/index.php?pk=115443&T=1

Globally Unique Identifier (entire table): ba.freestatistics.org/blog/index.php?pk=115443&T=1

As an alternative you can also use a QR Code:  

The GUIDs for individual cells are displayed in the table below:

Multiple Linear Regression - Estimated Regression Equation
WLH[t] = + 238.252733996356 + 0.216708479297129Faill[t] + e[t]


Multiple Linear Regression - Ordinary Least Squares
VariableParameterS.D.T-STATH0: parameter = 02-tail p-value1-tail p-value
(Intercept)238.25273399635660.6436393.92870.000230.000115
Faill0.2167084792971290.0852362.54250.0136990.00685

\begin{tabular}{lllllllll}
\hline
Multiple Linear Regression - Ordinary Least Squares \tabularnewline
Variable & Parameter & S.D. & T-STATH0: parameter = 0 & 2-tail p-value & 1-tail p-value \tabularnewline
(Intercept) & 238.252733996356 & 60.643639 & 3.9287 & 0.00023 & 0.000115 \tabularnewline
Faill & 0.216708479297129 & 0.085236 & 2.5425 & 0.013699 & 0.00685 \tabularnewline
\hline
\end{tabular}
%Source: https://freestatistics.org/blog/index.php?pk=115443&T=2

[TABLE]
[ROW][C]Multiple Linear Regression - Ordinary Least Squares[/C][/ROW]
[ROW][C]Variable[/C][C]Parameter[/C][C]S.D.[/C][C]T-STATH0: parameter = 0[/C][C]2-tail p-value[/C][C]1-tail p-value[/C][/ROW]
[ROW][C](Intercept)[/C][C]238.252733996356[/C][C]60.643639[/C][C]3.9287[/C][C]0.00023[/C][C]0.000115[/C][/ROW]
[ROW][C]Faill[/C][C]0.216708479297129[/C][C]0.085236[/C][C]2.5425[/C][C]0.013699[/C][C]0.00685[/C][/ROW]
[/TABLE]
Source: https://freestatistics.org/blog/index.php?pk=115443&T=2

Globally Unique Identifier (entire table): ba.freestatistics.org/blog/index.php?pk=115443&T=2

As an alternative you can also use a QR Code:  

The GUIDs for individual cells are displayed in the table below:

Multiple Linear Regression - Ordinary Least Squares
VariableParameterS.D.T-STATH0: parameter = 02-tail p-value1-tail p-value
(Intercept)238.25273399635660.6436393.92870.000230.000115
Faill0.2167084792971290.0852362.54250.0136990.00685


Multiple Linear Regression - Regression Statistics
Multiple R0.316661441317002
R-squared0.100274468416961
Adjusted R-squared0.0847619592517364
F-TEST (value)6.46410373389184
F-TEST (DF numerator)1
F-TEST (DF denominator)58
p-value0.0136994828546096
Multiple Linear Regression - Residual Statistics
Residual Standard Deviation126.218132664543
Sum Squared Residuals923998.986772809

\begin{tabular}{lllllllll}
\hline
Multiple Linear Regression - Regression Statistics \tabularnewline
Multiple R & 0.316661441317002 \tabularnewline
R-squared & 0.100274468416961 \tabularnewline
Adjusted R-squared & 0.0847619592517364 \tabularnewline
F-TEST (value) & 6.46410373389184 \tabularnewline
F-TEST (DF numerator) & 1 \tabularnewline
F-TEST (DF denominator) & 58 \tabularnewline
p-value & 0.0136994828546096 \tabularnewline
Multiple Linear Regression - Residual Statistics \tabularnewline
Residual Standard Deviation & 126.218132664543 \tabularnewline
Sum Squared Residuals & 923998.986772809 \tabularnewline
\hline
\end{tabular}
%Source: https://freestatistics.org/blog/index.php?pk=115443&T=3

[TABLE]
[ROW][C]Multiple Linear Regression - Regression Statistics[/C][/ROW]
[ROW][C]Multiple R[/C][C]0.316661441317002[/C][/ROW]
[ROW][C]R-squared[/C][C]0.100274468416961[/C][/ROW]
[ROW][C]Adjusted R-squared[/C][C]0.0847619592517364[/C][/ROW]
[ROW][C]F-TEST (value)[/C][C]6.46410373389184[/C][/ROW]
[ROW][C]F-TEST (DF numerator)[/C][C]1[/C][/ROW]
[ROW][C]F-TEST (DF denominator)[/C][C]58[/C][/ROW]
[ROW][C]p-value[/C][C]0.0136994828546096[/C][/ROW]
[ROW][C]Multiple Linear Regression - Residual Statistics[/C][/ROW]
[ROW][C]Residual Standard Deviation[/C][C]126.218132664543[/C][/ROW]
[ROW][C]Sum Squared Residuals[/C][C]923998.986772809[/C][/ROW]
[/TABLE]
Source: https://freestatistics.org/blog/index.php?pk=115443&T=3

Globally Unique Identifier (entire table): ba.freestatistics.org/blog/index.php?pk=115443&T=3

As an alternative you can also use a QR Code:  

The GUIDs for individual cells are displayed in the table below:

Multiple Linear Regression - Regression Statistics
Multiple R0.316661441317002
R-squared0.100274468416961
Adjusted R-squared0.0847619592517364
F-TEST (value)6.46410373389184
F-TEST (DF numerator)1
F-TEST (DF denominator)58
p-value0.0136994828546096
Multiple Linear Regression - Residual Statistics
Residual Standard Deviation126.218132664543
Sum Squared Residuals923998.986772809


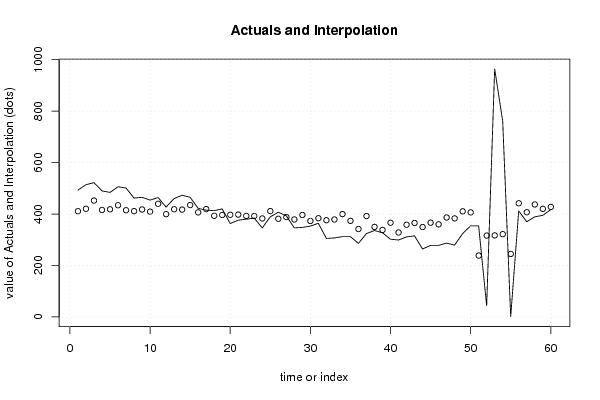
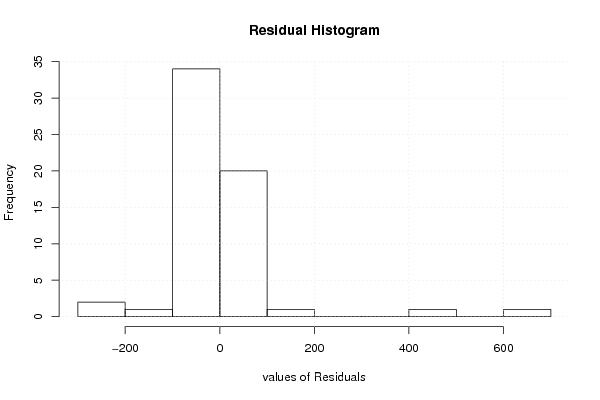
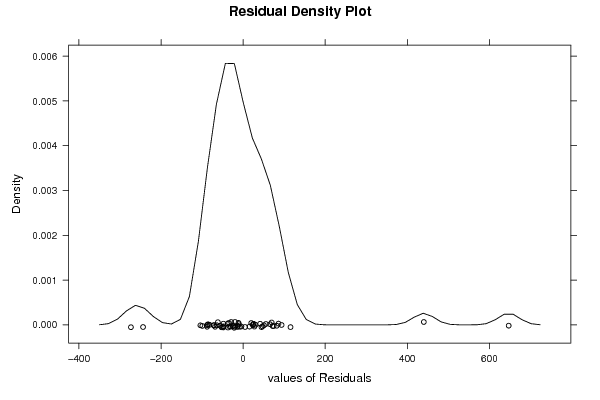
Multiple Linear Regression - Actuals, Interpolation, and Residuals
Time or IndexActualsInterpolationForecastResidualsPrediction Error
1493410.96939199616882.0306080038316
2514420.28785660594493.7121433940557
3522452.36071154191969.6392884580807
4490415.73697854070574.2630214592955
5484418.3374802922765.6625197077299
6506434.15719928096071.8428007190395
7501414.65343614421986.3465638557811
8462411.18610047546550.8138995245352
9465417.68735485437947.3126451456213
10454409.23572416179144.7642758382094
11464439.79161974268624.2083802573142
12427399.4838425934227.5161574065802
13460418.55418877156741.4458112284328
14473417.25393789578455.7460621042156
15465434.80732471885230.1926752811481
16422406.41851393092815.5814860690720
17415419.204314209459-4.20431420945858
18413393.19929669380319.8007033061969
19420396.23321540396323.7667845960371
20363397.100049321151-34.1000493211514
21376397.750174759043-21.7501747590428
22380392.549171255912-12.5491712559117
23384392.332462776615-8.33246277661458
24346382.797289687541-36.7972896875409
25389411.402808954762-22.4028089547619
26407381.49703881175825.5029611882419
27393388.2150016699694.78499833003087
28346378.896537060193-32.8965370601926
29348396.233215403963-48.2332154039629
30353373.04540811917-20.0454081191701
31364383.664123604729-19.6641236047294
32305375.862618350033-70.8626183500328
33307378.679828580895-71.6798285808955
34312399.700551072717-87.700551072717
35312373.478825077764-61.4788250777644
36286341.622678621086-55.6226786210864
37324392.115754297317-68.1157542973175
38336349.857600834377-13.8576008343773
39327338.155342952332-11.1553429523323
40302366.110736781662-64.110736781662
41299328.186752904664-29.1867529046644
42311358.309231526965-47.3092315269653
43315365.027194385176-50.0271943851763
44264349.424183875783-85.424183875783
45278366.327445260959-88.3274452609591
46278359.826190882045-81.8261908820452
47287386.481333835592-99.4813338355921
48279383.013998166838-104.013998166838
49324410.535975037573-86.5359750375734
50354406.418513930928-52.418513930928
51354238.469442475653115.530557524347
5243316.267786543322-273.267786543322
53964316.917911981214647.082088018786
54762321.685498525751440.314501474249
551244.753988375270-243.753988375270
56412441.74199605636-29.74199605636
57370407.068639368819-37.0686393688193
58389437.19111799112-48.1911179911203
59395420.071148126647-25.0711481266471
60417427.655944902047-10.6559449020466

\begin{tabular}{lllllllll}
\hline
Multiple Linear Regression - Actuals, Interpolation, and Residuals \tabularnewline
Time or Index & Actuals & InterpolationForecast & ResidualsPrediction Error \tabularnewline
1 & 493 & 410.969391996168 & 82.0306080038316 \tabularnewline
2 & 514 & 420.287856605944 & 93.7121433940557 \tabularnewline
3 & 522 & 452.360711541919 & 69.6392884580807 \tabularnewline
4 & 490 & 415.736978540705 & 74.2630214592955 \tabularnewline
5 & 484 & 418.33748029227 & 65.6625197077299 \tabularnewline
6 & 506 & 434.157199280960 & 71.8428007190395 \tabularnewline
7 & 501 & 414.653436144219 & 86.3465638557811 \tabularnewline
8 & 462 & 411.186100475465 & 50.8138995245352 \tabularnewline
9 & 465 & 417.687354854379 & 47.3126451456213 \tabularnewline
10 & 454 & 409.235724161791 & 44.7642758382094 \tabularnewline
11 & 464 & 439.791619742686 & 24.2083802573142 \tabularnewline
12 & 427 & 399.48384259342 & 27.5161574065802 \tabularnewline
13 & 460 & 418.554188771567 & 41.4458112284328 \tabularnewline
14 & 473 & 417.253937895784 & 55.7460621042156 \tabularnewline
15 & 465 & 434.807324718852 & 30.1926752811481 \tabularnewline
16 & 422 & 406.418513930928 & 15.5814860690720 \tabularnewline
17 & 415 & 419.204314209459 & -4.20431420945858 \tabularnewline
18 & 413 & 393.199296693803 & 19.8007033061969 \tabularnewline
19 & 420 & 396.233215403963 & 23.7667845960371 \tabularnewline
20 & 363 & 397.100049321151 & -34.1000493211514 \tabularnewline
21 & 376 & 397.750174759043 & -21.7501747590428 \tabularnewline
22 & 380 & 392.549171255912 & -12.5491712559117 \tabularnewline
23 & 384 & 392.332462776615 & -8.33246277661458 \tabularnewline
24 & 346 & 382.797289687541 & -36.7972896875409 \tabularnewline
25 & 389 & 411.402808954762 & -22.4028089547619 \tabularnewline
26 & 407 & 381.497038811758 & 25.5029611882419 \tabularnewline
27 & 393 & 388.215001669969 & 4.78499833003087 \tabularnewline
28 & 346 & 378.896537060193 & -32.8965370601926 \tabularnewline
29 & 348 & 396.233215403963 & -48.2332154039629 \tabularnewline
30 & 353 & 373.04540811917 & -20.0454081191701 \tabularnewline
31 & 364 & 383.664123604729 & -19.6641236047294 \tabularnewline
32 & 305 & 375.862618350033 & -70.8626183500328 \tabularnewline
33 & 307 & 378.679828580895 & -71.6798285808955 \tabularnewline
34 & 312 & 399.700551072717 & -87.700551072717 \tabularnewline
35 & 312 & 373.478825077764 & -61.4788250777644 \tabularnewline
36 & 286 & 341.622678621086 & -55.6226786210864 \tabularnewline
37 & 324 & 392.115754297317 & -68.1157542973175 \tabularnewline
38 & 336 & 349.857600834377 & -13.8576008343773 \tabularnewline
39 & 327 & 338.155342952332 & -11.1553429523323 \tabularnewline
40 & 302 & 366.110736781662 & -64.110736781662 \tabularnewline
41 & 299 & 328.186752904664 & -29.1867529046644 \tabularnewline
42 & 311 & 358.309231526965 & -47.3092315269653 \tabularnewline
43 & 315 & 365.027194385176 & -50.0271943851763 \tabularnewline
44 & 264 & 349.424183875783 & -85.424183875783 \tabularnewline
45 & 278 & 366.327445260959 & -88.3274452609591 \tabularnewline
46 & 278 & 359.826190882045 & -81.8261908820452 \tabularnewline
47 & 287 & 386.481333835592 & -99.4813338355921 \tabularnewline
48 & 279 & 383.013998166838 & -104.013998166838 \tabularnewline
49 & 324 & 410.535975037573 & -86.5359750375734 \tabularnewline
50 & 354 & 406.418513930928 & -52.418513930928 \tabularnewline
51 & 354 & 238.469442475653 & 115.530557524347 \tabularnewline
52 & 43 & 316.267786543322 & -273.267786543322 \tabularnewline
53 & 964 & 316.917911981214 & 647.082088018786 \tabularnewline
54 & 762 & 321.685498525751 & 440.314501474249 \tabularnewline
55 & 1 & 244.753988375270 & -243.753988375270 \tabularnewline
56 & 412 & 441.74199605636 & -29.74199605636 \tabularnewline
57 & 370 & 407.068639368819 & -37.0686393688193 \tabularnewline
58 & 389 & 437.19111799112 & -48.1911179911203 \tabularnewline
59 & 395 & 420.071148126647 & -25.0711481266471 \tabularnewline
60 & 417 & 427.655944902047 & -10.6559449020466 \tabularnewline
\hline
\end{tabular}
%Source: https://freestatistics.org/blog/index.php?pk=115443&T=4

[TABLE]
[ROW][C]Multiple Linear Regression - Actuals, Interpolation, and Residuals[/C][/ROW]
[ROW][C]Time or Index[/C][C]Actuals[/C][C]InterpolationForecast[/C][C]ResidualsPrediction Error[/C][/ROW]
[ROW][C]1[/C][C]493[/C][C]410.969391996168[/C][C]82.0306080038316[/C][/ROW]
[ROW][C]2[/C][C]514[/C][C]420.287856605944[/C][C]93.7121433940557[/C][/ROW]
[ROW][C]3[/C][C]522[/C][C]452.360711541919[/C][C]69.6392884580807[/C][/ROW]
[ROW][C]4[/C][C]490[/C][C]415.736978540705[/C][C]74.2630214592955[/C][/ROW]
[ROW][C]5[/C][C]484[/C][C]418.33748029227[/C][C]65.6625197077299[/C][/ROW]
[ROW][C]6[/C][C]506[/C][C]434.157199280960[/C][C]71.8428007190395[/C][/ROW]
[ROW][C]7[/C][C]501[/C][C]414.653436144219[/C][C]86.3465638557811[/C][/ROW]
[ROW][C]8[/C][C]462[/C][C]411.186100475465[/C][C]50.8138995245352[/C][/ROW]
[ROW][C]9[/C][C]465[/C][C]417.687354854379[/C][C]47.3126451456213[/C][/ROW]
[ROW][C]10[/C][C]454[/C][C]409.235724161791[/C][C]44.7642758382094[/C][/ROW]
[ROW][C]11[/C][C]464[/C][C]439.791619742686[/C][C]24.2083802573142[/C][/ROW]
[ROW][C]12[/C][C]427[/C][C]399.48384259342[/C][C]27.5161574065802[/C][/ROW]
[ROW][C]13[/C][C]460[/C][C]418.554188771567[/C][C]41.4458112284328[/C][/ROW]
[ROW][C]14[/C][C]473[/C][C]417.253937895784[/C][C]55.7460621042156[/C][/ROW]
[ROW][C]15[/C][C]465[/C][C]434.807324718852[/C][C]30.1926752811481[/C][/ROW]
[ROW][C]16[/C][C]422[/C][C]406.418513930928[/C][C]15.5814860690720[/C][/ROW]
[ROW][C]17[/C][C]415[/C][C]419.204314209459[/C][C]-4.20431420945858[/C][/ROW]
[ROW][C]18[/C][C]413[/C][C]393.199296693803[/C][C]19.8007033061969[/C][/ROW]
[ROW][C]19[/C][C]420[/C][C]396.233215403963[/C][C]23.7667845960371[/C][/ROW]
[ROW][C]20[/C][C]363[/C][C]397.100049321151[/C][C]-34.1000493211514[/C][/ROW]
[ROW][C]21[/C][C]376[/C][C]397.750174759043[/C][C]-21.7501747590428[/C][/ROW]
[ROW][C]22[/C][C]380[/C][C]392.549171255912[/C][C]-12.5491712559117[/C][/ROW]
[ROW][C]23[/C][C]384[/C][C]392.332462776615[/C][C]-8.33246277661458[/C][/ROW]
[ROW][C]24[/C][C]346[/C][C]382.797289687541[/C][C]-36.7972896875409[/C][/ROW]
[ROW][C]25[/C][C]389[/C][C]411.402808954762[/C][C]-22.4028089547619[/C][/ROW]
[ROW][C]26[/C][C]407[/C][C]381.497038811758[/C][C]25.5029611882419[/C][/ROW]
[ROW][C]27[/C][C]393[/C][C]388.215001669969[/C][C]4.78499833003087[/C][/ROW]
[ROW][C]28[/C][C]346[/C][C]378.896537060193[/C][C]-32.8965370601926[/C][/ROW]
[ROW][C]29[/C][C]348[/C][C]396.233215403963[/C][C]-48.2332154039629[/C][/ROW]
[ROW][C]30[/C][C]353[/C][C]373.04540811917[/C][C]-20.0454081191701[/C][/ROW]
[ROW][C]31[/C][C]364[/C][C]383.664123604729[/C][C]-19.6641236047294[/C][/ROW]
[ROW][C]32[/C][C]305[/C][C]375.862618350033[/C][C]-70.8626183500328[/C][/ROW]
[ROW][C]33[/C][C]307[/C][C]378.679828580895[/C][C]-71.6798285808955[/C][/ROW]
[ROW][C]34[/C][C]312[/C][C]399.700551072717[/C][C]-87.700551072717[/C][/ROW]
[ROW][C]35[/C][C]312[/C][C]373.478825077764[/C][C]-61.4788250777644[/C][/ROW]
[ROW][C]36[/C][C]286[/C][C]341.622678621086[/C][C]-55.6226786210864[/C][/ROW]
[ROW][C]37[/C][C]324[/C][C]392.115754297317[/C][C]-68.1157542973175[/C][/ROW]
[ROW][C]38[/C][C]336[/C][C]349.857600834377[/C][C]-13.8576008343773[/C][/ROW]
[ROW][C]39[/C][C]327[/C][C]338.155342952332[/C][C]-11.1553429523323[/C][/ROW]
[ROW][C]40[/C][C]302[/C][C]366.110736781662[/C][C]-64.110736781662[/C][/ROW]
[ROW][C]41[/C][C]299[/C][C]328.186752904664[/C][C]-29.1867529046644[/C][/ROW]
[ROW][C]42[/C][C]311[/C][C]358.309231526965[/C][C]-47.3092315269653[/C][/ROW]
[ROW][C]43[/C][C]315[/C][C]365.027194385176[/C][C]-50.0271943851763[/C][/ROW]
[ROW][C]44[/C][C]264[/C][C]349.424183875783[/C][C]-85.424183875783[/C][/ROW]
[ROW][C]45[/C][C]278[/C][C]366.327445260959[/C][C]-88.3274452609591[/C][/ROW]
[ROW][C]46[/C][C]278[/C][C]359.826190882045[/C][C]-81.8261908820452[/C][/ROW]
[ROW][C]47[/C][C]287[/C][C]386.481333835592[/C][C]-99.4813338355921[/C][/ROW]
[ROW][C]48[/C][C]279[/C][C]383.013998166838[/C][C]-104.013998166838[/C][/ROW]
[ROW][C]49[/C][C]324[/C][C]410.535975037573[/C][C]-86.5359750375734[/C][/ROW]
[ROW][C]50[/C][C]354[/C][C]406.418513930928[/C][C]-52.418513930928[/C][/ROW]
[ROW][C]51[/C][C]354[/C][C]238.469442475653[/C][C]115.530557524347[/C][/ROW]
[ROW][C]52[/C][C]43[/C][C]316.267786543322[/C][C]-273.267786543322[/C][/ROW]
[ROW][C]53[/C][C]964[/C][C]316.917911981214[/C][C]647.082088018786[/C][/ROW]
[ROW][C]54[/C][C]762[/C][C]321.685498525751[/C][C]440.314501474249[/C][/ROW]
[ROW][C]55[/C][C]1[/C][C]244.753988375270[/C][C]-243.753988375270[/C][/ROW]
[ROW][C]56[/C][C]412[/C][C]441.74199605636[/C][C]-29.74199605636[/C][/ROW]
[ROW][C]57[/C][C]370[/C][C]407.068639368819[/C][C]-37.0686393688193[/C][/ROW]
[ROW][C]58[/C][C]389[/C][C]437.19111799112[/C][C]-48.1911179911203[/C][/ROW]
[ROW][C]59[/C][C]395[/C][C]420.071148126647[/C][C]-25.0711481266471[/C][/ROW]
[ROW][C]60[/C][C]417[/C][C]427.655944902047[/C][C]-10.6559449020466[/C][/ROW]
[/TABLE]
Source: https://freestatistics.org/blog/index.php?pk=115443&T=4

Globally Unique Identifier (entire table): ba.freestatistics.org/blog/index.php?pk=115443&T=4

As an alternative you can also use a QR Code:  

The GUIDs for individual cells are displayed in the table below:

Multiple Linear Regression - Actuals, Interpolation, and Residuals
Time or IndexActualsInterpolationForecastResidualsPrediction Error
1493410.96939199616882.0306080038316
2514420.28785660594493.7121433940557
3522452.36071154191969.6392884580807
4490415.73697854070574.2630214592955
5484418.3374802922765.6625197077299
6506434.15719928096071.8428007190395
7501414.65343614421986.3465638557811
8462411.18610047546550.8138995245352
9465417.68735485437947.3126451456213
10454409.23572416179144.7642758382094
11464439.79161974268624.2083802573142
12427399.4838425934227.5161574065802
13460418.55418877156741.4458112284328
14473417.25393789578455.7460621042156
15465434.80732471885230.1926752811481
16422406.41851393092815.5814860690720
17415419.204314209459-4.20431420945858
18413393.19929669380319.8007033061969
19420396.23321540396323.7667845960371
20363397.100049321151-34.1000493211514
21376397.750174759043-21.7501747590428
22380392.549171255912-12.5491712559117
23384392.332462776615-8.33246277661458
24346382.797289687541-36.7972896875409
25389411.402808954762-22.4028089547619
26407381.49703881175825.5029611882419
27393388.2150016699694.78499833003087
28346378.896537060193-32.8965370601926
29348396.233215403963-48.2332154039629
30353373.04540811917-20.0454081191701
31364383.664123604729-19.6641236047294
32305375.862618350033-70.8626183500328
33307378.679828580895-71.6798285808955
34312399.700551072717-87.700551072717
35312373.478825077764-61.4788250777644
36286341.622678621086-55.6226786210864
37324392.115754297317-68.1157542973175
38336349.857600834377-13.8576008343773
39327338.155342952332-11.1553429523323
40302366.110736781662-64.110736781662
41299328.186752904664-29.1867529046644
42311358.309231526965-47.3092315269653
43315365.027194385176-50.0271943851763
44264349.424183875783-85.424183875783
45278366.327445260959-88.3274452609591
46278359.826190882045-81.8261908820452
47287386.481333835592-99.4813338355921
48279383.013998166838-104.013998166838
49324410.535975037573-86.5359750375734
50354406.418513930928-52.418513930928
51354238.469442475653115.530557524347
5243316.267786543322-273.267786543322
53964316.917911981214647.082088018786
54762321.685498525751440.314501474249
551244.753988375270-243.753988375270
56412441.74199605636-29.74199605636
57370407.068639368819-37.0686393688193
58389437.19111799112-48.1911179911203
59395420.071148126647-25.0711481266471
60417427.655944902047-10.6559449020466


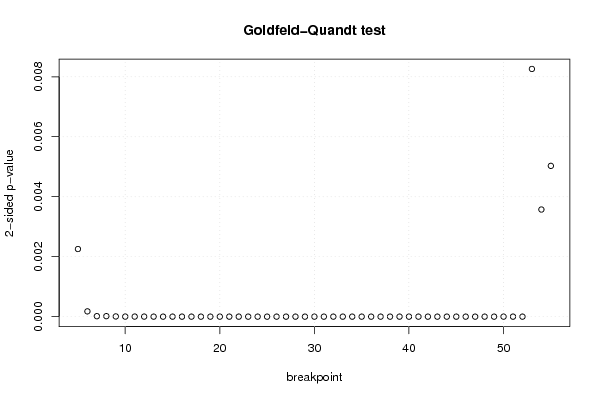
Goldfeld-Quandt test for Heteroskedasticity
p-valuesAlternative Hypothesis
breakpoint indexgreater2-sidedless
50.00112771875271870.00225543750543740.998872281247281
68.81814211320073e-050.0001763628422640150.999911818578868
77.81653814919834e-061.56330762983967e-050.99999218346185
88.14725325849e-061.629450651698e-050.999991852746742
93.46965149368275e-066.9393029873655e-060.999996530348506
101.11093389761539e-062.22186779523078e-060.999998889066102
111.42874121514483e-062.85748243028966e-060.999998571258785
128.10401047048716e-071.62080209409743e-060.999999189598953
131.86262954734251e-073.72525909468502e-070.999999813737045
143.10543974762305e-086.21087949524611e-080.999999968945603
151.14127892855033e-082.28255785710066e-080.99999998858721
167.3077962604366e-091.46155925208732e-080.999999992692204
171.31805677265179e-082.63611354530358e-080.999999986819432
183.47676554661281e-096.95353109322562e-090.999999996523234
197.63215965606024e-101.52643193121205e-090.999999999236784
201.95816192594289e-093.91632385188578e-090.999999998041838
211.20706745816785e-092.41413491633570e-090.999999998792933
223.61139313402538e-107.22278626805076e-100.99999999963886
238.8828207892772e-111.77656415785544e-100.999999999911172
242.92388479345311e-115.84776958690621e-110.999999999970761
252.1894089654191e-114.3788179308382e-110.999999999978106
267.42032769866762e-121.48406553973352e-110.99999999999258
271.47534690156053e-122.95069380312107e-120.999999999998525
283.52445018511716e-137.04890037023432e-130.999999999999648
292.93423532089552e-135.86847064179105e-130.999999999999707
305.52353921970559e-141.10470784394112e-130.999999999999945
311.04884204868252e-142.09768409736505e-140.99999999999999
325.22185070394647e-151.04437014078929e-140.999999999999995
332.54186069252230e-155.08372138504461e-150.999999999999997
341.43645484572826e-142.87290969145651e-140.999999999999986
353.28640866936711e-156.57281733873422e-150.999999999999997
369.85039092685998e-161.97007818537200e-150.999999999999999
376.51629956158993e-161.30325991231799e-151
383.49314705933293e-166.98629411866586e-161
392.42532771602973e-164.85065543205947e-161
405.8135822242872e-171.16271644485744e-161
412.38280133980836e-174.76560267961672e-171
424.26737446507367e-188.53474893014733e-181
437.8763835726494e-191.57527671452988e-181
442.07143090489578e-194.14286180979155e-191
459.17795290887289e-201.83559058177458e-191
462.54265175016614e-205.08530350033227e-201
474.36690132325945e-208.7338026465189e-201
486.29670328253349e-201.25934065650670e-191
491.44194349826495e-192.8838869965299e-191
505.37556069305754e-201.07511213861151e-191
512.65973607893268e-165.31947215786536e-161
525.32400859033375e-131.06480171806675e-120.999999999999468
530.004130119584804490.008260239169608970.995869880415196
540.9982138541109980.003572291778003460.00178614588900173
550.9974859742898560.005028051420288880.00251402571014444

\begin{tabular}{lllllllll}
\hline
Goldfeld-Quandt test for Heteroskedasticity \tabularnewline
p-values & Alternative Hypothesis \tabularnewline
breakpoint index & greater & 2-sided & less \tabularnewline
5 & 0.0011277187527187 & 0.0022554375054374 & 0.998872281247281 \tabularnewline
6 & 8.81814211320073e-05 & 0.000176362842264015 & 0.999911818578868 \tabularnewline
7 & 7.81653814919834e-06 & 1.56330762983967e-05 & 0.99999218346185 \tabularnewline
8 & 8.14725325849e-06 & 1.629450651698e-05 & 0.999991852746742 \tabularnewline
9 & 3.46965149368275e-06 & 6.9393029873655e-06 & 0.999996530348506 \tabularnewline
10 & 1.11093389761539e-06 & 2.22186779523078e-06 & 0.999998889066102 \tabularnewline
11 & 1.42874121514483e-06 & 2.85748243028966e-06 & 0.999998571258785 \tabularnewline
12 & 8.10401047048716e-07 & 1.62080209409743e-06 & 0.999999189598953 \tabularnewline
13 & 1.86262954734251e-07 & 3.72525909468502e-07 & 0.999999813737045 \tabularnewline
14 & 3.10543974762305e-08 & 6.21087949524611e-08 & 0.999999968945603 \tabularnewline
15 & 1.14127892855033e-08 & 2.28255785710066e-08 & 0.99999998858721 \tabularnewline
16 & 7.3077962604366e-09 & 1.46155925208732e-08 & 0.999999992692204 \tabularnewline
17 & 1.31805677265179e-08 & 2.63611354530358e-08 & 0.999999986819432 \tabularnewline
18 & 3.47676554661281e-09 & 6.95353109322562e-09 & 0.999999996523234 \tabularnewline
19 & 7.63215965606024e-10 & 1.52643193121205e-09 & 0.999999999236784 \tabularnewline
20 & 1.95816192594289e-09 & 3.91632385188578e-09 & 0.999999998041838 \tabularnewline
21 & 1.20706745816785e-09 & 2.41413491633570e-09 & 0.999999998792933 \tabularnewline
22 & 3.61139313402538e-10 & 7.22278626805076e-10 & 0.99999999963886 \tabularnewline
23 & 8.8828207892772e-11 & 1.77656415785544e-10 & 0.999999999911172 \tabularnewline
24 & 2.92388479345311e-11 & 5.84776958690621e-11 & 0.999999999970761 \tabularnewline
25 & 2.1894089654191e-11 & 4.3788179308382e-11 & 0.999999999978106 \tabularnewline
26 & 7.42032769866762e-12 & 1.48406553973352e-11 & 0.99999999999258 \tabularnewline
27 & 1.47534690156053e-12 & 2.95069380312107e-12 & 0.999999999998525 \tabularnewline
28 & 3.52445018511716e-13 & 7.04890037023432e-13 & 0.999999999999648 \tabularnewline
29 & 2.93423532089552e-13 & 5.86847064179105e-13 & 0.999999999999707 \tabularnewline
30 & 5.52353921970559e-14 & 1.10470784394112e-13 & 0.999999999999945 \tabularnewline
31 & 1.04884204868252e-14 & 2.09768409736505e-14 & 0.99999999999999 \tabularnewline
32 & 5.22185070394647e-15 & 1.04437014078929e-14 & 0.999999999999995 \tabularnewline
33 & 2.54186069252230e-15 & 5.08372138504461e-15 & 0.999999999999997 \tabularnewline
34 & 1.43645484572826e-14 & 2.87290969145651e-14 & 0.999999999999986 \tabularnewline
35 & 3.28640866936711e-15 & 6.57281733873422e-15 & 0.999999999999997 \tabularnewline
36 & 9.85039092685998e-16 & 1.97007818537200e-15 & 0.999999999999999 \tabularnewline
37 & 6.51629956158993e-16 & 1.30325991231799e-15 & 1 \tabularnewline
38 & 3.49314705933293e-16 & 6.98629411866586e-16 & 1 \tabularnewline
39 & 2.42532771602973e-16 & 4.85065543205947e-16 & 1 \tabularnewline
40 & 5.8135822242872e-17 & 1.16271644485744e-16 & 1 \tabularnewline
41 & 2.38280133980836e-17 & 4.76560267961672e-17 & 1 \tabularnewline
42 & 4.26737446507367e-18 & 8.53474893014733e-18 & 1 \tabularnewline
43 & 7.8763835726494e-19 & 1.57527671452988e-18 & 1 \tabularnewline
44 & 2.07143090489578e-19 & 4.14286180979155e-19 & 1 \tabularnewline
45 & 9.17795290887289e-20 & 1.83559058177458e-19 & 1 \tabularnewline
46 & 2.54265175016614e-20 & 5.08530350033227e-20 & 1 \tabularnewline
47 & 4.36690132325945e-20 & 8.7338026465189e-20 & 1 \tabularnewline
48 & 6.29670328253349e-20 & 1.25934065650670e-19 & 1 \tabularnewline
49 & 1.44194349826495e-19 & 2.8838869965299e-19 & 1 \tabularnewline
50 & 5.37556069305754e-20 & 1.07511213861151e-19 & 1 \tabularnewline
51 & 2.65973607893268e-16 & 5.31947215786536e-16 & 1 \tabularnewline
52 & 5.32400859033375e-13 & 1.06480171806675e-12 & 0.999999999999468 \tabularnewline
53 & 0.00413011958480449 & 0.00826023916960897 & 0.995869880415196 \tabularnewline
54 & 0.998213854110998 & 0.00357229177800346 & 0.00178614588900173 \tabularnewline
55 & 0.997485974289856 & 0.00502805142028888 & 0.00251402571014444 \tabularnewline
\hline
\end{tabular}
%Source: https://freestatistics.org/blog/index.php?pk=115443&T=5

[TABLE]
[ROW][C]Goldfeld-Quandt test for Heteroskedasticity[/C][/ROW]
[ROW][C]p-values[/C][C]Alternative Hypothesis[/C][/ROW]
[ROW][C]breakpoint index[/C][C]greater[/C][C]2-sided[/C][C]less[/C][/ROW]
[ROW][C]5[/C][C]0.0011277187527187[/C][C]0.0022554375054374[/C][C]0.998872281247281[/C][/ROW]
[ROW][C]6[/C][C]8.81814211320073e-05[/C][C]0.000176362842264015[/C][C]0.999911818578868[/C][/ROW]
[ROW][C]7[/C][C]7.81653814919834e-06[/C][C]1.56330762983967e-05[/C][C]0.99999218346185[/C][/ROW]
[ROW][C]8[/C][C]8.14725325849e-06[/C][C]1.629450651698e-05[/C][C]0.999991852746742[/C][/ROW]
[ROW][C]9[/C][C]3.46965149368275e-06[/C][C]6.9393029873655e-06[/C][C]0.999996530348506[/C][/ROW]
[ROW][C]10[/C][C]1.11093389761539e-06[/C][C]2.22186779523078e-06[/C][C]0.999998889066102[/C][/ROW]
[ROW][C]11[/C][C]1.42874121514483e-06[/C][C]2.85748243028966e-06[/C][C]0.999998571258785[/C][/ROW]
[ROW][C]12[/C][C]8.10401047048716e-07[/C][C]1.62080209409743e-06[/C][C]0.999999189598953[/C][/ROW]
[ROW][C]13[/C][C]1.86262954734251e-07[/C][C]3.72525909468502e-07[/C][C]0.999999813737045[/C][/ROW]
[ROW][C]14[/C][C]3.10543974762305e-08[/C][C]6.21087949524611e-08[/C][C]0.999999968945603[/C][/ROW]
[ROW][C]15[/C][C]1.14127892855033e-08[/C][C]2.28255785710066e-08[/C][C]0.99999998858721[/C][/ROW]
[ROW][C]16[/C][C]7.3077962604366e-09[/C][C]1.46155925208732e-08[/C][C]0.999999992692204[/C][/ROW]
[ROW][C]17[/C][C]1.31805677265179e-08[/C][C]2.63611354530358e-08[/C][C]0.999999986819432[/C][/ROW]
[ROW][C]18[/C][C]3.47676554661281e-09[/C][C]6.95353109322562e-09[/C][C]0.999999996523234[/C][/ROW]
[ROW][C]19[/C][C]7.63215965606024e-10[/C][C]1.52643193121205e-09[/C][C]0.999999999236784[/C][/ROW]
[ROW][C]20[/C][C]1.95816192594289e-09[/C][C]3.91632385188578e-09[/C][C]0.999999998041838[/C][/ROW]
[ROW][C]21[/C][C]1.20706745816785e-09[/C][C]2.41413491633570e-09[/C][C]0.999999998792933[/C][/ROW]
[ROW][C]22[/C][C]3.61139313402538e-10[/C][C]7.22278626805076e-10[/C][C]0.99999999963886[/C][/ROW]
[ROW][C]23[/C][C]8.8828207892772e-11[/C][C]1.77656415785544e-10[/C][C]0.999999999911172[/C][/ROW]
[ROW][C]24[/C][C]2.92388479345311e-11[/C][C]5.84776958690621e-11[/C][C]0.999999999970761[/C][/ROW]
[ROW][C]25[/C][C]2.1894089654191e-11[/C][C]4.3788179308382e-11[/C][C]0.999999999978106[/C][/ROW]
[ROW][C]26[/C][C]7.42032769866762e-12[/C][C]1.48406553973352e-11[/C][C]0.99999999999258[/C][/ROW]
[ROW][C]27[/C][C]1.47534690156053e-12[/C][C]2.95069380312107e-12[/C][C]0.999999999998525[/C][/ROW]
[ROW][C]28[/C][C]3.52445018511716e-13[/C][C]7.04890037023432e-13[/C][C]0.999999999999648[/C][/ROW]
[ROW][C]29[/C][C]2.93423532089552e-13[/C][C]5.86847064179105e-13[/C][C]0.999999999999707[/C][/ROW]
[ROW][C]30[/C][C]5.52353921970559e-14[/C][C]1.10470784394112e-13[/C][C]0.999999999999945[/C][/ROW]
[ROW][C]31[/C][C]1.04884204868252e-14[/C][C]2.09768409736505e-14[/C][C]0.99999999999999[/C][/ROW]
[ROW][C]32[/C][C]5.22185070394647e-15[/C][C]1.04437014078929e-14[/C][C]0.999999999999995[/C][/ROW]
[ROW][C]33[/C][C]2.54186069252230e-15[/C][C]5.08372138504461e-15[/C][C]0.999999999999997[/C][/ROW]
[ROW][C]34[/C][C]1.43645484572826e-14[/C][C]2.87290969145651e-14[/C][C]0.999999999999986[/C][/ROW]
[ROW][C]35[/C][C]3.28640866936711e-15[/C][C]6.57281733873422e-15[/C][C]0.999999999999997[/C][/ROW]
[ROW][C]36[/C][C]9.85039092685998e-16[/C][C]1.97007818537200e-15[/C][C]0.999999999999999[/C][/ROW]
[ROW][C]37[/C][C]6.51629956158993e-16[/C][C]1.30325991231799e-15[/C][C]1[/C][/ROW]
[ROW][C]38[/C][C]3.49314705933293e-16[/C][C]6.98629411866586e-16[/C][C]1[/C][/ROW]
[ROW][C]39[/C][C]2.42532771602973e-16[/C][C]4.85065543205947e-16[/C][C]1[/C][/ROW]
[ROW][C]40[/C][C]5.8135822242872e-17[/C][C]1.16271644485744e-16[/C][C]1[/C][/ROW]
[ROW][C]41[/C][C]2.38280133980836e-17[/C][C]4.76560267961672e-17[/C][C]1[/C][/ROW]
[ROW][C]42[/C][C]4.26737446507367e-18[/C][C]8.53474893014733e-18[/C][C]1[/C][/ROW]
[ROW][C]43[/C][C]7.8763835726494e-19[/C][C]1.57527671452988e-18[/C][C]1[/C][/ROW]
[ROW][C]44[/C][C]2.07143090489578e-19[/C][C]4.14286180979155e-19[/C][C]1[/C][/ROW]
[ROW][C]45[/C][C]9.17795290887289e-20[/C][C]1.83559058177458e-19[/C][C]1[/C][/ROW]
[ROW][C]46[/C][C]2.54265175016614e-20[/C][C]5.08530350033227e-20[/C][C]1[/C][/ROW]
[ROW][C]47[/C][C]4.36690132325945e-20[/C][C]8.7338026465189e-20[/C][C]1[/C][/ROW]
[ROW][C]48[/C][C]6.29670328253349e-20[/C][C]1.25934065650670e-19[/C][C]1[/C][/ROW]
[ROW][C]49[/C][C]1.44194349826495e-19[/C][C]2.8838869965299e-19[/C][C]1[/C][/ROW]
[ROW][C]50[/C][C]5.37556069305754e-20[/C][C]1.07511213861151e-19[/C][C]1[/C][/ROW]
[ROW][C]51[/C][C]2.65973607893268e-16[/C][C]5.31947215786536e-16[/C][C]1[/C][/ROW]
[ROW][C]52[/C][C]5.32400859033375e-13[/C][C]1.06480171806675e-12[/C][C]0.999999999999468[/C][/ROW]
[ROW][C]53[/C][C]0.00413011958480449[/C][C]0.00826023916960897[/C][C]0.995869880415196[/C][/ROW]
[ROW][C]54[/C][C]0.998213854110998[/C][C]0.00357229177800346[/C][C]0.00178614588900173[/C][/ROW]
[ROW][C]55[/C][C]0.997485974289856[/C][C]0.00502805142028888[/C][C]0.00251402571014444[/C][/ROW]
[/TABLE]
Source: https://freestatistics.org/blog/index.php?pk=115443&T=5

Globally Unique Identifier (entire table): ba.freestatistics.org/blog/index.php?pk=115443&T=5

As an alternative you can also use a QR Code:  

The GUIDs for individual cells are displayed in the table below:

Goldfeld-Quandt test for Heteroskedasticity
p-valuesAlternative Hypothesis
breakpoint indexgreater2-sidedless
50.00112771875271870.00225543750543740.998872281247281
68.81814211320073e-050.0001763628422640150.999911818578868
77.81653814919834e-061.56330762983967e-050.99999218346185
88.14725325849e-061.629450651698e-050.999991852746742
93.46965149368275e-066.9393029873655e-060.999996530348506
101.11093389761539e-062.22186779523078e-060.999998889066102
111.42874121514483e-062.85748243028966e-060.999998571258785
128.10401047048716e-071.62080209409743e-060.999999189598953
131.86262954734251e-073.72525909468502e-070.999999813737045
143.10543974762305e-086.21087949524611e-080.999999968945603
151.14127892855033e-082.28255785710066e-080.99999998858721
167.3077962604366e-091.46155925208732e-080.999999992692204
171.31805677265179e-082.63611354530358e-080.999999986819432
183.47676554661281e-096.95353109322562e-090.999999996523234
197.63215965606024e-101.52643193121205e-090.999999999236784
201.95816192594289e-093.91632385188578e-090.999999998041838
211.20706745816785e-092.41413491633570e-090.999999998792933
223.61139313402538e-107.22278626805076e-100.99999999963886
238.8828207892772e-111.77656415785544e-100.999999999911172
242.92388479345311e-115.84776958690621e-110.999999999970761
252.1894089654191e-114.3788179308382e-110.999999999978106
267.42032769866762e-121.48406553973352e-110.99999999999258
271.47534690156053e-122.95069380312107e-120.999999999998525
283.52445018511716e-137.04890037023432e-130.999999999999648
292.93423532089552e-135.86847064179105e-130.999999999999707
305.52353921970559e-141.10470784394112e-130.999999999999945
311.04884204868252e-142.09768409736505e-140.99999999999999
325.22185070394647e-151.04437014078929e-140.999999999999995
332.54186069252230e-155.08372138504461e-150.999999999999997
341.43645484572826e-142.87290969145651e-140.999999999999986
353.28640866936711e-156.57281733873422e-150.999999999999997
369.85039092685998e-161.97007818537200e-150.999999999999999
376.51629956158993e-161.30325991231799e-151
383.49314705933293e-166.98629411866586e-161
392.42532771602973e-164.85065543205947e-161
405.8135822242872e-171.16271644485744e-161
412.38280133980836e-174.76560267961672e-171
424.26737446507367e-188.53474893014733e-181
437.8763835726494e-191.57527671452988e-181
442.07143090489578e-194.14286180979155e-191
459.17795290887289e-201.83559058177458e-191
462.54265175016614e-205.08530350033227e-201
474.36690132325945e-208.7338026465189e-201
486.29670328253349e-201.25934065650670e-191
491.44194349826495e-192.8838869965299e-191
505.37556069305754e-201.07511213861151e-191
512.65973607893268e-165.31947215786536e-161
525.32400859033375e-131.06480171806675e-120.999999999999468
530.004130119584804490.008260239169608970.995869880415196
540.9982138541109980.003572291778003460.00178614588900173
550.9974859742898560.005028051420288880.00251402571014444


Meta Analysis of Goldfeld-Quandt test for Heteroskedasticity
Description# significant tests% significant testsOK/NOK
1% type I error level511NOK
5% type I error level511NOK
10% type I error level511NOK

\begin{tabular}{lllllllll}
\hline
Meta Analysis of Goldfeld-Quandt test for Heteroskedasticity \tabularnewline
Description & # significant tests & % significant tests & OK/NOK \tabularnewline
1% type I error level & 51 & 1 & NOK \tabularnewline
5% type I error level & 51 & 1 & NOK \tabularnewline
10% type I error level & 51 & 1 & NOK \tabularnewline
\hline
\end{tabular}
%Source: https://freestatistics.org/blog/index.php?pk=115443&T=6

[TABLE]
[ROW][C]Meta Analysis of Goldfeld-Quandt test for Heteroskedasticity[/C][/ROW]
[ROW][C]Description[/C][C]# significant tests[/C][C]% significant tests[/C][C]OK/NOK[/C][/ROW]
[ROW][C]1% type I error level[/C][C]51[/C][C]1[/C][C]NOK[/C][/ROW]
[ROW][C]5% type I error level[/C][C]51[/C][C]1[/C][C]NOK[/C][/ROW]
[ROW][C]10% type I error level[/C][C]51[/C][C]1[/C][C]NOK[/C][/ROW]
[/TABLE]
Source: https://freestatistics.org/blog/index.php?pk=115443&T=6

Globally Unique Identifier (entire table): ba.freestatistics.org/blog/index.php?pk=115443&T=6

As an alternative you can also use a QR Code:  

The GUIDs for individual cells are displayed in the table below:

Meta Analysis of Goldfeld-Quandt test for Heteroskedasticity
Description# significant tests% significant testsOK/NOK
1% type I error level511NOK
5% type I error level511NOK
10% type I error level511NOK


Parameters (Session):
par1 = 1 ; par2 = Do not include Seasonal Dummies ; par3 = No Linear Trend ;
Parameters (R input):
par1 = 1 ; par2 = Do not include Seasonal Dummies ; par3 = No Linear Trend ;
R code (references can be found in the software module):
library(lattice)
library(lmtest)
n25 <- 25 #minimum number of obs. for Goldfeld-Quandt test
par1 <- as.numeric(par1)
x <- t(y)
k <- length(x[1,])
n <- length(x[,1])
x1 <- cbind(x[,par1], x[,1:k!=par1])
mycolnames <- c(colnames(x)[par1], colnames(x)[1:k!=par1])
colnames(x1) <- mycolnames #colnames(x)[par1]
x <- x1
if (par3 == 'First Differences'){
x2 <- array(0, dim=c(n-1,k), dimnames=list(1:(n-1), paste('(1-B)',colnames(x),sep='')))
for (i in 1:n-1) {
for (j in 1:k) {
x2[i,j] <- x[i+1,j] - x[i,j]
}
}
x <- x2
}
if (par2 == 'Include Monthly Dummies'){
x2 <- array(0, dim=c(n,11), dimnames=list(1:n, paste('M', seq(1:11), sep ='')))
for (i in 1:11){
x2[seq(i,n,12),i] <- 1
}
x <- cbind(x, x2)
}
if (par2 == 'Include Quarterly Dummies'){
x2 <- array(0, dim=c(n,3), dimnames=list(1:n, paste('Q', seq(1:3), sep ='')))
for (i in 1:3){
x2[seq(i,n,4),i] <- 1
}
x <- cbind(x, x2)
}
k <- length(x[1,])
if (par3 == 'Linear Trend'){
x <- cbind(x, c(1:n))
colnames(x)[k+1] <- 't'
}
x
k <- length(x[1,])
df <- as.data.frame(x)
(mylm <- lm(df))
(mysum <- summary(mylm))
if (n > n25) {
kp3 <- k + 3
nmkm3 <- n - k - 3
gqarr <- array(NA, dim=c(nmkm3-kp3+1,3))
numgqtests <- 0
numsignificant1 <- 0
numsignificant5 <- 0
numsignificant10 <- 0
for (mypoint in kp3:nmkm3) {
j <- 0
numgqtests <- numgqtests + 1
for (myalt in c('greater', 'two.sided', 'less')) {
j <- j + 1
gqarr[mypoint-kp3+1,j] <- gqtest(mylm, point=mypoint, alternative=myalt)$p.value
}
if (gqarr[mypoint-kp3+1,2] < 0.01) numsignificant1 <- numsignificant1 + 1
if (gqarr[mypoint-kp3+1,2] < 0.05) numsignificant5 <- numsignificant5 + 1
if (gqarr[mypoint-kp3+1,2] < 0.10) numsignificant10 <- numsignificant10 + 1
}
gqarr
}
bitmap(file='test0.png')
plot(x[,1], type='l', main='Actuals and Interpolation', ylab='value of Actuals and Interpolation (dots)', xlab='time or index')
points(x[,1]-mysum$resid)
grid()
dev.off()
bitmap(file='test1.png')
plot(mysum$resid, type='b', pch=19, main='Residuals', ylab='value of Residuals', xlab='time or index')
grid()
dev.off()
bitmap(file='test2.png')
hist(mysum$resid, main='Residual Histogram', xlab='values of Residuals')
grid()
dev.off()
bitmap(file='test3.png')
densityplot(~mysum$resid,col='black',main='Residual Density Plot', xlab='values of Residuals')
dev.off()
bitmap(file='test4.png')
qqnorm(mysum$resid, main='Residual Normal Q-Q Plot')
qqline(mysum$resid)
grid()
dev.off()
(myerror <- as.ts(mysum$resid))
bitmap(file='test5.png')
dum <- cbind(lag(myerror,k=1),myerror)
dum
dum1 <- dum[2:length(myerror),]
dum1
z <- as.data.frame(dum1)
z
plot(z,main=paste('Residual Lag plot, lowess, and regression line'), ylab='values of Residuals', xlab='lagged values of Residuals')
lines(lowess(z))
abline(lm(z))
grid()
dev.off()
bitmap(file='test6.png')
acf(mysum$resid, lag.max=length(mysum$resid)/2, main='Residual Autocorrelation Function')
grid()
dev.off()
bitmap(file='test7.png')
pacf(mysum$resid, lag.max=length(mysum$resid)/2, main='Residual Partial Autocorrelation Function')
grid()
dev.off()
bitmap(file='test8.png')
opar <- par(mfrow = c(2,2), oma = c(0, 0, 1.1, 0))
plot(mylm, las = 1, sub='Residual Diagnostics')
par(opar)
dev.off()
if (n > n25) {
bitmap(file='test9.png')
plot(kp3:nmkm3,gqarr[,2], main='Goldfeld-Quandt test',ylab='2-sided p-value',xlab='breakpoint')
grid()
dev.off()
}
load(file='createtable')
a<-table.start()
a<-table.row.start(a)
a<-table.element(a, 'Multiple Linear Regression - Estimated Regression Equation', 1, TRUE)
a<-table.row.end(a)
myeq <- colnames(x)[1]
myeq <- paste(myeq, '[t] = ', sep='')
for (i in 1:k){
if (mysum$coefficients[i,1] > 0) myeq <- paste(myeq, '+', '')
myeq <- paste(myeq, mysum$coefficients[i,1], sep=' ')
if (rownames(mysum$coefficients)[i] != '(Intercept)') {
myeq <- paste(myeq, rownames(mysum$coefficients)[i], sep='')
if (rownames(mysum$coefficients)[i] != 't') myeq <- paste(myeq, '[t]', sep='')
}
}
myeq <- paste(myeq, ' + e[t]')
a<-table.row.start(a)
a<-table.element(a, myeq)
a<-table.row.end(a)
a<-table.end(a)
table.save(a,file='mytable1.tab')
a<-table.start()
a<-table.row.start(a)
a<-table.element(a,hyperlink('ols1.htm','Multiple Linear Regression - Ordinary Least Squares',''), 6, TRUE)
a<-table.row.end(a)
a<-table.row.start(a)
a<-table.element(a,'Variable',header=TRUE)
a<-table.element(a,'Parameter',header=TRUE)
a<-table.element(a,'S.D.',header=TRUE)
a<-table.element(a,'T-STAT
H0: parameter = 0',header=TRUE)
a<-table.element(a,'2-tail p-value',header=TRUE)
a<-table.element(a,'1-tail p-value',header=TRUE)
a<-table.row.end(a)
for (i in 1:k){
a<-table.row.start(a)
a<-table.element(a,rownames(mysum$coefficients)[i],header=TRUE)
a<-table.element(a,mysum$coefficients[i,1])
a<-table.element(a, round(mysum$coefficients[i,2],6))
a<-table.element(a, round(mysum$coefficients[i,3],4))
a<-table.element(a, round(mysum$coefficients[i,4],6))
a<-table.element(a, round(mysum$coefficients[i,4]/2,6))
a<-table.row.end(a)
}
a<-table.end(a)
table.save(a,file='mytable2.tab')
a<-table.start()
a<-table.row.start(a)
a<-table.element(a, 'Multiple Linear Regression - Regression Statistics', 2, TRUE)
a<-table.row.end(a)
a<-table.row.start(a)
a<-table.element(a, 'Multiple R',1,TRUE)
a<-table.element(a, sqrt(mysum$r.squared))
a<-table.row.end(a)
a<-table.row.start(a)
a<-table.element(a, 'R-squared',1,TRUE)
a<-table.element(a, mysum$r.squared)
a<-table.row.end(a)
a<-table.row.start(a)
a<-table.element(a, 'Adjusted R-squared',1,TRUE)
a<-table.element(a, mysum$adj.r.squared)
a<-table.row.end(a)
a<-table.row.start(a)
a<-table.element(a, 'F-TEST (value)',1,TRUE)
a<-table.element(a, mysum$fstatistic[1])
a<-table.row.end(a)
a<-table.row.start(a)
a<-table.element(a, 'F-TEST (DF numerator)',1,TRUE)
a<-table.element(a, mysum$fstatistic[2])
a<-table.row.end(a)
a<-table.row.start(a)
a<-table.element(a, 'F-TEST (DF denominator)',1,TRUE)
a<-table.element(a, mysum$fstatistic[3])
a<-table.row.end(a)
a<-table.row.start(a)
a<-table.element(a, 'p-value',1,TRUE)
a<-table.element(a, 1-pf(mysum$fstatistic[1],mysum$fstatistic[2],mysum$fstatistic[3]))
a<-table.row.end(a)
a<-table.row.start(a)
a<-table.element(a, 'Multiple Linear Regression - Residual Statistics', 2, TRUE)
a<-table.row.end(a)
a<-table.row.start(a)
a<-table.element(a, 'Residual Standard Deviation',1,TRUE)
a<-table.element(a, mysum$sigma)
a<-table.row.end(a)
a<-table.row.start(a)
a<-table.element(a, 'Sum Squared Residuals',1,TRUE)
a<-table.element(a, sum(myerror*myerror))
a<-table.row.end(a)
a<-table.end(a)
table.save(a,file='mytable3.tab')
a<-table.start()
a<-table.row.start(a)
a<-table.element(a, 'Multiple Linear Regression - Actuals, Interpolation, and Residuals', 4, TRUE)
a<-table.row.end(a)
a<-table.row.start(a)
a<-table.element(a, 'Time or Index', 1, TRUE)
a<-table.element(a, 'Actuals', 1, TRUE)
a<-table.element(a, 'Interpolation
Forecast', 1, TRUE)
a<-table.element(a, 'Residuals
Prediction Error', 1, TRUE)
a<-table.row.end(a)
for (i in 1:n) {
a<-table.row.start(a)
a<-table.element(a,i, 1, TRUE)
a<-table.element(a,x[i])
a<-table.element(a,x[i]-mysum$resid[i])
a<-table.element(a,mysum$resid[i])
a<-table.row.end(a)
}
a<-table.end(a)
table.save(a,file='mytable4.tab')
if (n > n25) {
a<-table.start()
a<-table.row.start(a)
a<-table.element(a,'Goldfeld-Quandt test for Heteroskedasticity',4,TRUE)
a<-table.row.end(a)
a<-table.row.start(a)
a<-table.element(a,'p-values',header=TRUE)
a<-table.element(a,'Alternative Hypothesis',3,header=TRUE)
a<-table.row.end(a)
a<-table.row.start(a)
a<-table.element(a,'breakpoint index',header=TRUE)
a<-table.element(a,'greater',header=TRUE)
a<-table.element(a,'2-sided',header=TRUE)
a<-table.element(a,'less',header=TRUE)
a<-table.row.end(a)
for (mypoint in kp3:nmkm3) {
a<-table.row.start(a)
a<-table.element(a,mypoint,header=TRUE)
a<-table.element(a,gqarr[mypoint-kp3+1,1])
a<-table.element(a,gqarr[mypoint-kp3+1,2])
a<-table.element(a,gqarr[mypoint-kp3+1,3])
a<-table.row.end(a)
}
a<-table.end(a)
table.save(a,file='mytable5.tab')
a<-table.start()
a<-table.row.start(a)
a<-table.element(a,'Meta Analysis of Goldfeld-Quandt test for Heteroskedasticity',4,TRUE)
a<-table.row.end(a)
a<-table.row.start(a)
a<-table.element(a,'Description',header=TRUE)
a<-table.element(a,'# significant tests',header=TRUE)
a<-table.element(a,'% significant tests',header=TRUE)
a<-table.element(a,'OK/NOK',header=TRUE)
a<-table.row.end(a)
a<-table.row.start(a)
a<-table.element(a,'1% type I error level',header=TRUE)
a<-table.element(a,numsignificant1)
a<-table.element(a,numsignificant1/numgqtests)
if (numsignificant1/numgqtests < 0.01) dum <- 'OK' else dum <- 'NOK'
a<-table.element(a,dum)
a<-table.row.end(a)
a<-table.row.start(a)
a<-table.element(a,'5% type I error level',header=TRUE)
a<-table.element(a,numsignificant5)
a<-table.element(a,numsignificant5/numgqtests)
if (numsignificant5/numgqtests < 0.05) dum <- 'OK' else dum <- 'NOK'
a<-table.element(a,dum)
a<-table.row.end(a)
a<-table.row.start(a)
a<-table.element(a,'10% type I error level',header=TRUE)
a<-table.element(a,numsignificant10)
a<-table.element(a,numsignificant10/numgqtests)
if (numsignificant10/numgqtests < 0.1) dum <- 'OK' else dum <- 'NOK'
a<-table.element(a,dum)
a<-table.row.end(a)
a<-table.end(a)
table.save(a,file='mytable6.tab')
}