Free Statistics

of Irreproducible Research!

Author's title

Author*The author of this computation has been verified*
R Software Modulerwasp_regression_trees1.wasp
Title produced by softwareRecursive Partitioning (Regression Trees)
Date of computationSat, 25 Dec 2010 19:22:30 +0000
Cite this page as followsStatistical Computations at FreeStatistics.org, Office for Research Development and Education, URL https://freestatistics.org/blog/index.php?v=date/2010/Dec/25/t1293305026alttkh05xex7l7a.htm/, Retrieved Mon, 29 Apr 2024 07:00:51 +0000
Statistical Computations at FreeStatistics.org, Office for Research Development and Education, URL https://freestatistics.org/blog/index.php?pk=115442, Retrieved Mon, 29 Apr 2024 07:00:51 +0000
QR Codes:

Original text written by user:
IsPrivate?No (this computation is public)
User-defined keywords
Estimated Impact143
Family? (F = Feedback message, R = changed R code, M = changed R Module, P = changed Parameters, D = changed Data)
-     [Univariate Explorative Data Analysis] [Monthly US soldie...] [2010-11-02 12:07:39] [b98453cac15ba1066b407e146608df68]
- RMP   [Exponential Smoothing] [Soldiers] [2010-11-30 14:09:25] [b98453cac15ba1066b407e146608df68]
- RMPD    [Recursive Partitioning (Regression Trees)] [BEL20-RP1(no cat)] [2010-12-22 17:58:31] [d672a41e0af7ff107c03f1d65e47fd32]
-   P       [Recursive Partitioning (Regression Trees)] [BEL20-RP2(cat)] [2010-12-22 18:45:42] [d672a41e0af7ff107c03f1d65e47fd32]
-   P           [Recursive Partitioning (Regression Trees)] [BEL20-RP(crossval...] [2010-12-25 19:22:30] [4c7d8c32b2e34fcaa7f14928b91d45ae] [Current]
Feedback Forum

Post a new message
Dataseries X:
3.04	493	9	3.030	9.026	25.64	104.8
3.28	481	11	2.803	9.787	27.97	105.2
3.51	462	13	2.768	9.536	27.62	105.6
3.69	457	12	2.883	9.490	23.31	105.8
3.92	442	13	2.863	9.736	29.07	106.1
4.29	439	15	2.897	9.694	29.58	106.5
4.31	488	13	3.013	9.647	28.63	106.71
4.42	521	16	3.143	9.753	29.92	106.68
4.59	501	10	3.033	10.070	32.68	107.41
4.76	485	14	3.046	10.137	31.54	107.15
4.83	464	14	3.111	9.984	32.43	107.5
4.83	460	45	3.013	9.732	26.54	107.22
4.76	467	13	2.987	9.103	25.85	107.11
4.99	460	8	2.996	9.155	27.60	107.57
4.78	448	7	2.833	9.308	25.71	107.81
5.06	443	3	2.849	9.394	25.38	108.75
4.65	436	3	2.795	9.948	28.57	109.43
4.54	431	4	2.845	10.177	27.64	109.62
4.51	484	4	2.915	10.002	25.36	109.54
4.49	510	0	2.893	9.728	25.90	109.53
3.99	513	-4	2.604	10.002	26.29	109.84
3.97	503	-14	2.642	10.063	21.74	109.67
3.51	471	-18	2.660	10.018	19.20	109.79
3.34	471	-8	2.639	9.960	19.32	109.56
3.29	476	-1	2.720	10.236	19.82	110.22
3.28	475	1	2.746	10.893	20.36	110.4
3.26	470	2	2.736	10.756	24.31	110.69
3.32	461	0	2.812	10.940	25.97	110.72
3.31	455	1	2.799	10.997	25.61	110.89
3.35	456	0	2.555	10.827	24.67	110.58
3.30	517	-1	2.305	10.166	25.59	110.94
3.29	525	-3	2.215	10.186	26.09	110.91
3.32	523	-3	2.066	10.457	28.37	111.22
3.30	519	-3	1.940	10.368	27.34	111.09
3.30	509	-4	2.042	10.244	24.46	111
3.09	512	-8	1.995	10.511	27.46	111.06
2.79	519	-9	1.947	10.812	30.23	111.55
2.76	517	-13	1.766	10.738	32.33	112.32
2.75	510	-18	1.635	10.171	29.87	112.64
2.56	509	-11	1.833	9.721	24.87	112.36
2.56	501	-9	1.910	9.897	25.48	112.04
2.21	507	-10	1.960	9.828	27.28	112.37
2.08	569	-13	1.970	9.924	28.24	112.59
2.10	580	-11	2.061	10.371	29.58	112.89
2.02	578	-5	2.093	10.846	26.95	113.22
2.01	565	-15	2.121	10.413	29.08	112.85
1.97	547	-6	2.175	10.709	28.76	113.06
2.06	555	-6	2.197	10.662	29.59	112.99
2.02	562	-3	2.350	10.570	30.70	113.32
2.03	561	-1	2.440	10.297	30.52	113.74
2.01	555	-3	2.409	10.635	32.67	113.91
2.08	544	-4	2.473	10.872	33.19	114.52
2.02	537	-6	2.408	10.296	37.13	114.96
2.03	543	0	2.455	10.383	35.54	114.91
2.07	594	-4	2.448	10.431	37.75	115.3
2.04	611	-2	2.498	10.574	41.84	115.44
2.05	613	-2	2.646	10.653	42.94	115.52
2.11	611	-6	2.757	10.805	49.14	116.08
2.09	594	-7	2.849	10.872	44.61	115.94
2.05	595	-6	2.921	10.625	40.22	115.56
2.08	591	-6	2.982	10.407	44.23	115.88
2.06	589	-3	3.081	10.463	45.85	116.66
2.06	584	-2	3.106	10.556	53.38	117.41
2.08	573	-5	3.119	10.646	53.26	117.68
2.07	567	-11	3.061	10.702	51.80	117.85
2.06	569	-11	3.097	11.353	55.30	118.21
2.07	621	-11	3.162	11.346	57.81	118.92
2.06	629	-10	3.257	11.451	63.96	119.03
2.09	628	-14	3.277	11.964	63.77	119.17
2.07	612	-8	3.295	12.574	59.15	118.95
2.09	595	-9	3.364	13.031	56.12	118.92
2.28	597	-5	3.494	13.812	57.42	118.9
2.33	593	-1	3.667	14.544	63.52	118.92
2.35	590	-2	3.813	14.931	61.71	119.44
2.52	580	-5	3.918	14.886	63.01	119.40
2.63	574	-4	3.896	16.005	68.18	119.98
2.58	573	-6	3.801	17.064	72.03	120.43
2.70	573	-2	3.570	15.168	69.75	120.41
2.81	620	-2	3.702	16.050	74.41	120.82
2.97	626	-2	3.862	15.839	74.33	120.97
3.04	620	-2	3.970	15.137	64.24	120.63
3.28	588	2	4.139	14.954	60.03	120.38
3.33	566	1	4.200	15.648	59.44	120.68
3.50	557	-8	4.291	15.305	62.50	120.84
3.56	561	-1	4.444	15.579	55.04	120.90
3.57	549	1	4.503	16.348	58.34	121.56
3.69	532	-1	4.357	15.928	61.92	121.57
3.82	526	2	4.591	16.171	67.65	122.12
3.79	511	2	4.697	15.937	67.68	121.97
3.96	499	1	4.621	15.713	70.30	121.96
4.06	555	-1	4.563	15.594	75.26	122.48
4.05	565	-2	4.203	15.683	71.44	122.33
4.03	542	-2	4.296	16.438	76.36	122.44
3.94	527	-1	4.435	17.032	81.71	123.08
4.02	510	-8	4.105	17.696	92.60	124.23
3.88	514	-4	4.117	17.745	90.60	124.58
4.02	517	-6	3.844	19.394	92.23	125.08
4.03	508	-3	3.721	20.148	94.09	125.98
4.09	493	-3	3.674	20.108	102.79	126.90
3.99	490	-7	3.858	18.584	109.65	127.19
4.01	469	-9	3.801	18.441	124.05	128.33
4.01	478	-11	3.504	18.391	132.69	129.04
4.19	528	-13	3.033	19.178	135.81	129.72
4.30	534	-11	3.047	18.079	116.07	128.92
4.27	518	-9	2.962	18.483	101.42	129.13
3.82	506	-17	2.198	19.644	75.73	128.90
3.15	502	-22	2.014	19.195	55.48	128.13
2.49	516	-25	1.863	19.650	43.80	127.85
1.81	528	-20	1.905	20.830	45.29	127.98
1.26	533	-24	1.811	23.595	44.01	128.42
1.06	536	-24	1.670	22.937	47.48	127.68
0.84	537	-22	1.864	21.814	51.07	127.95
0.78	524	-19	2.052	21.928	57.84	127.85
0.70	536	-18	2.030	21.777	69.04	127.61
0.36	587	-17	2.071	21.383	65.61	127.53
0.35	597	-11	2.293	21.467	72.87	127.92
0.36	581	-11	2.443	22.052	68.41	127.59
0.36	564	-12	2.513	22.680	73.25	127.65
0.36	558	-10	2.467	24.320	77.43	127.98
0.35	575	-15	2.503	24.977	75.28	128.19
0.34	580	-15	2.540	25.204	77.33	128.77
0.34	575	-15	2.483	25.739	74.31	129.31
0.35	563	-13	2.626	26.434	79.70	129.80
0.35	552	-8	2.656	27.525	85.47	130.24
0.34	537	-13	2.447	30.695	77.98	130.76
0.35	545	-9	2.467	32.436	75.69	130.75
0.48	601	-7	2.462	30.160	75.20	130.81
0.43	604	-4	2.505	30.236	77.21	130.89
0.45	586	-4	2.579	31.293	77.85	131.30
0.70	564	-2	2.649	31.077	83.53	131.49
0.59	549	0	2.637	32.226	85.99	131.65


Summary of computational transaction
Raw Inputview raw input (R code)
Raw Outputview raw output of R engine
Computing time7 seconds
R Server'Gwilym Jenkins' @ 72.249.127.135

\begin{tabular}{lllllllll}
\hline
Summary of computational transaction \tabularnewline
Raw Input & view raw input (R code)  \tabularnewline
Raw Output & view raw output of R engine  \tabularnewline
Computing time & 7 seconds \tabularnewline
R Server & 'Gwilym Jenkins' @ 72.249.127.135 \tabularnewline
\hline
\end{tabular}
%Source: https://freestatistics.org/blog/index.php?pk=115442&T=0

[TABLE]
[ROW][C]Summary of computational transaction[/C][/ROW]
[ROW][C]Raw Input[/C][C]view raw input (R code) [/C][/ROW]
[ROW][C]Raw Output[/C][C]view raw output of R engine [/C][/ROW]
[ROW][C]Computing time[/C][C]7 seconds[/C][/ROW]
[ROW][C]R Server[/C][C]'Gwilym Jenkins' @ 72.249.127.135[/C][/ROW]
[/TABLE]
Source: https://freestatistics.org/blog/index.php?pk=115442&T=0

Globally Unique Identifier (entire table): ba.freestatistics.org/blog/index.php?pk=115442&T=0

As an alternative you can also use a QR Code:  

The GUIDs for individual cells are displayed in the table below:

Summary of computational transaction
Raw Inputview raw input (R code)
Raw Outputview raw output of R engine
Computing time7 seconds
R Server'Gwilym Jenkins' @ 72.249.127.135


10-Fold Cross Validation
Prediction (training)Prediction (testing)
ActualC1C2C3CVC1C2C3CV
C13653010.921736800.8182
C2102277130.7066143220.6667
C33333540.907721370.925
Overall---0.8455---0.7955

\begin{tabular}{lllllllll}
\hline
10-Fold Cross Validation \tabularnewline
 & Prediction (training) & Prediction (testing) \tabularnewline
Actual & C1 & C2 & C3 & CV & C1 & C2 & C3 & CV \tabularnewline
C1 & 365 & 30 & 1 & 0.9217 & 36 & 8 & 0 & 0.8182 \tabularnewline
C2 & 102 & 277 & 13 & 0.7066 & 14 & 32 & 2 & 0.6667 \tabularnewline
C3 & 3 & 33 & 354 & 0.9077 & 2 & 1 & 37 & 0.925 \tabularnewline
Overall & - & - & - & 0.8455 & - & - & - & 0.7955 \tabularnewline
\hline
\end{tabular}
%Source: https://freestatistics.org/blog/index.php?pk=115442&T=1

[TABLE]
[ROW][C]10-Fold Cross Validation[/C][/ROW]
[ROW][C][/C][C]Prediction (training)[/C][C]Prediction (testing)[/C][/ROW]
[ROW][C]Actual[/C][C]C1[/C][C]C2[/C][C]C3[/C][C]CV[/C][C]C1[/C][C]C2[/C][C]C3[/C][C]CV[/C][/ROW]
[ROW][C]C1[/C][C]365[/C][C]30[/C][C]1[/C][C]0.9217[/C][C]36[/C][C]8[/C][C]0[/C][C]0.8182[/C][/ROW]
[ROW][C]C2[/C][C]102[/C][C]277[/C][C]13[/C][C]0.7066[/C][C]14[/C][C]32[/C][C]2[/C][C]0.6667[/C][/ROW]
[ROW][C]C3[/C][C]3[/C][C]33[/C][C]354[/C][C]0.9077[/C][C]2[/C][C]1[/C][C]37[/C][C]0.925[/C][/ROW]
[ROW][C]Overall[/C][C]-[/C][C]-[/C][C]-[/C][C]0.8455[/C][C]-[/C][C]-[/C][C]-[/C][C]0.7955[/C][/ROW]
[/TABLE]
Source: https://freestatistics.org/blog/index.php?pk=115442&T=1

Globally Unique Identifier (entire table): ba.freestatistics.org/blog/index.php?pk=115442&T=1

As an alternative you can also use a QR Code:  

The GUIDs for individual cells are displayed in the table below:

10-Fold Cross Validation
Prediction (training)Prediction (testing)
ActualC1C2C3CVC1C2C3CV
C13653010.921736800.8182
C2102277130.7066143220.6667
C33333540.907721370.925
Overall---0.8455---0.7955


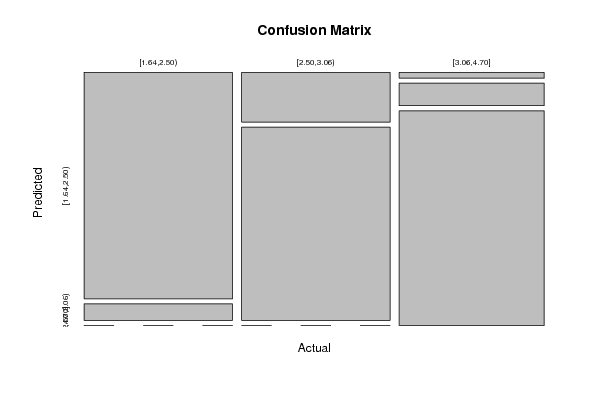
Confusion Matrix (predicted in columns / actuals in rows)
C1C2C3
C14130
C29350
C31438

\begin{tabular}{lllllllll}
\hline
Confusion Matrix (predicted in columns / actuals in rows) \tabularnewline
 & C1 & C2 & C3 \tabularnewline
C1 & 41 & 3 & 0 \tabularnewline
C2 & 9 & 35 & 0 \tabularnewline
C3 & 1 & 4 & 38 \tabularnewline
\hline
\end{tabular}
%Source: https://freestatistics.org/blog/index.php?pk=115442&T=2

[TABLE]
[ROW][C]Confusion Matrix (predicted in columns / actuals in rows)[/C][/ROW]
[ROW][C][/C][C]C1[/C][C]C2[/C][C]C3[/C][/ROW]
[ROW][C]C1[/C][C]41[/C][C]3[/C][C]0[/C][/ROW]
[ROW][C]C2[/C][C]9[/C][C]35[/C][C]0[/C][/ROW]
[ROW][C]C3[/C][C]1[/C][C]4[/C][C]38[/C][/ROW]
[/TABLE]
Source: https://freestatistics.org/blog/index.php?pk=115442&T=2

Globally Unique Identifier (entire table): ba.freestatistics.org/blog/index.php?pk=115442&T=2

As an alternative you can also use a QR Code:  

The GUIDs for individual cells are displayed in the table below:

Confusion Matrix (predicted in columns / actuals in rows)
C1C2C3
C14130
C29350
C31438


Parameters (Session):
par1 = 4 ; par2 = quantiles ; par3 = 3 ; par4 = yes ;
Parameters (R input):
par1 = 4 ; par2 = quantiles ; par3 = 3 ; par4 = yes ;
R code (references can be found in the software module):
library(party)
library(Hmisc)
par1 <- as.numeric(par1)
par3 <- as.numeric(par3)
x <- data.frame(t(y))
is.data.frame(x)
x <- x[!is.na(x[,par1]),]
k <- length(x[1,])
n <- length(x[,1])
colnames(x)[par1]
x[,par1]
if (par2 == 'kmeans') {
cl <- kmeans(x[,par1], par3)
print(cl)
clm <- matrix(cbind(cl$centers,1:par3),ncol=2)
clm <- clm[sort.list(clm[,1]),]
for (i in 1:par3) {
cl$cluster[cl$cluster==clm[i,2]] <- paste('C',i,sep='')
}
cl$cluster <- as.factor(cl$cluster)
print(cl$cluster)
x[,par1] <- cl$cluster
}
if (par2 == 'quantiles') {
x[,par1] <- cut2(x[,par1],g=par3)
}
if (par2 == 'hclust') {
hc <- hclust(dist(x[,par1])^2, 'cen')
print(hc)
memb <- cutree(hc, k = par3)
dum <- c(mean(x[memb==1,par1]))
for (i in 2:par3) {
dum <- c(dum, mean(x[memb==i,par1]))
}
hcm <- matrix(cbind(dum,1:par3),ncol=2)
hcm <- hcm[sort.list(hcm[,1]),]
for (i in 1:par3) {
memb[memb==hcm[i,2]] <- paste('C',i,sep='')
}
memb <- as.factor(memb)
print(memb)
x[,par1] <- memb
}
if (par2=='equal') {
ed <- cut(as.numeric(x[,par1]),par3,labels=paste('C',1:par3,sep=''))
x[,par1] <- as.factor(ed)
}
table(x[,par1])
colnames(x)
colnames(x)[par1]
x[,par1]
if (par2 == 'none') {
m <- ctree(as.formula(paste(colnames(x)[par1],' ~ .',sep='')),data = x)
}
load(file='createtable')
if (par2 != 'none') {
m <- ctree(as.formula(paste('as.factor(',colnames(x)[par1],') ~ .',sep='')),data = x)
if (par4=='yes') {
a<-table.start()
a<-table.row.start(a)
a<-table.element(a,'10-Fold Cross Validation',3+2*par3,TRUE)
a<-table.row.end(a)
a<-table.row.start(a)
a<-table.element(a,'',1,TRUE)
a<-table.element(a,'Prediction (training)',par3+1,TRUE)
a<-table.element(a,'Prediction (testing)',par3+1,TRUE)
a<-table.row.end(a)
a<-table.row.start(a)
a<-table.element(a,'Actual',1,TRUE)
for (jjj in 1:par3) a<-table.element(a,paste('C',jjj,sep=''),1,TRUE)
a<-table.element(a,'CV',1,TRUE)
for (jjj in 1:par3) a<-table.element(a,paste('C',jjj,sep=''),1,TRUE)
a<-table.element(a,'CV',1,TRUE)
a<-table.row.end(a)
for (i in 1:10) {
ind <- sample(2, nrow(x), replace=T, prob=c(0.9,0.1))
m.ct <- ctree(as.formula(paste('as.factor(',colnames(x)[par1],') ~ .',sep='')),data =x[ind==1,])
if (i==1) {
m.ct.i.pred <- predict(m.ct, newdata=x[ind==1,])
m.ct.i.actu <- x[ind==1,par1]
m.ct.x.pred <- predict(m.ct, newdata=x[ind==2,])
m.ct.x.actu <- x[ind==2,par1]
} else {
m.ct.i.pred <- c(m.ct.i.pred,predict(m.ct, newdata=x[ind==1,]))
m.ct.i.actu <- c(m.ct.i.actu,x[ind==1,par1])
m.ct.x.pred <- c(m.ct.x.pred,predict(m.ct, newdata=x[ind==2,]))
m.ct.x.actu <- c(m.ct.x.actu,x[ind==2,par1])
}
}
print(m.ct.i.tab <- table(m.ct.i.actu,m.ct.i.pred))
numer <- 0
for (i in 1:par3) {
print(m.ct.i.tab[i,i] / sum(m.ct.i.tab[i,]))
numer <- numer + m.ct.i.tab[i,i]
}
print(m.ct.i.cp <- numer / sum(m.ct.i.tab))
print(m.ct.x.tab <- table(m.ct.x.actu,m.ct.x.pred))
numer <- 0
for (i in 1:par3) {
print(m.ct.x.tab[i,i] / sum(m.ct.x.tab[i,]))
numer <- numer + m.ct.x.tab[i,i]
}
print(m.ct.x.cp <- numer / sum(m.ct.x.tab))
for (i in 1:par3) {
a<-table.row.start(a)
a<-table.element(a,paste('C',i,sep=''),1,TRUE)
for (jjj in 1:par3) a<-table.element(a,m.ct.i.tab[i,jjj])
a<-table.element(a,round(m.ct.i.tab[i,i]/sum(m.ct.i.tab[i,]),4))
for (jjj in 1:par3) a<-table.element(a,m.ct.x.tab[i,jjj])
a<-table.element(a,round(m.ct.x.tab[i,i]/sum(m.ct.x.tab[i,]),4))
a<-table.row.end(a)
}
a<-table.row.start(a)
a<-table.element(a,'Overall',1,TRUE)
for (jjj in 1:par3) a<-table.element(a,'-')
a<-table.element(a,round(m.ct.i.cp,4))
for (jjj in 1:par3) a<-table.element(a,'-')
a<-table.element(a,round(m.ct.x.cp,4))
a<-table.row.end(a)
a<-table.end(a)
table.save(a,file='mytable3.tab')
}
}
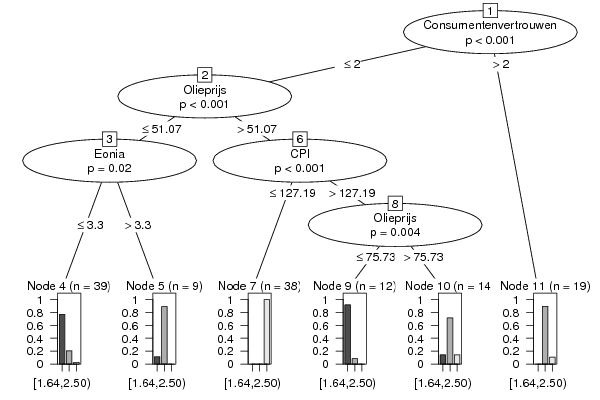
m
bitmap(file='test1.png')
plot(m)
dev.off()
bitmap(file='test1a.png')
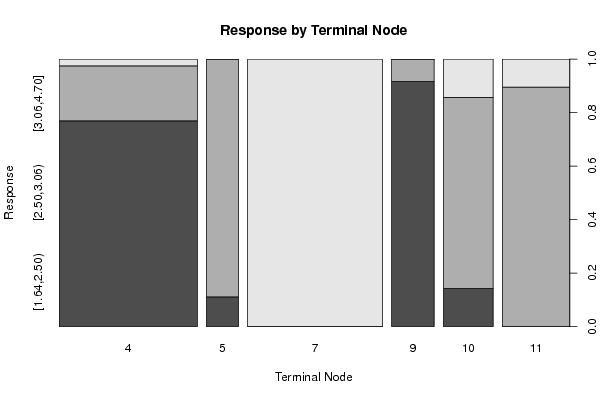
plot(x[,par1] ~ as.factor(where(m)),main='Response by Terminal Node',xlab='Terminal Node',ylab='Response')
dev.off()
if (par2 == 'none') {
forec <- predict(m)
result <- as.data.frame(cbind(x[,par1],forec,x[,par1]-forec))
colnames(result) <- c('Actuals','Forecasts','Residuals')
print(result)
}
if (par2 != 'none') {
print(cbind(as.factor(x[,par1]),predict(m)))
myt <- table(as.factor(x[,par1]),predict(m))
print(myt)
}
bitmap(file='test2.png')
if(par2=='none') {
op <- par(mfrow=c(2,2))
plot(density(result$Actuals),main='Kernel Density Plot of Actuals')
plot(density(result$Residuals),main='Kernel Density Plot of Residuals')
plot(result$Forecasts,result$Actuals,main='Actuals versus Predictions',xlab='Predictions',ylab='Actuals')
plot(density(result$Forecasts),main='Kernel Density Plot of Predictions')
par(op)
}
if(par2!='none') {
plot(myt,main='Confusion Matrix',xlab='Actual',ylab='Predicted')
}
dev.off()
if (par2 == 'none') {
detcoef <- cor(result$Forecasts,result$Actuals)
a<-table.start()
a<-table.row.start(a)
a<-table.element(a,'Goodness of Fit',2,TRUE)
a<-table.row.end(a)
a<-table.row.start(a)
a<-table.element(a,'Correlation',1,TRUE)
a<-table.element(a,round(detcoef,4))
a<-table.row.end(a)
a<-table.row.start(a)
a<-table.element(a,'R-squared',1,TRUE)
a<-table.element(a,round(detcoef*detcoef,4))
a<-table.row.end(a)
a<-table.row.start(a)
a<-table.element(a,'RMSE',1,TRUE)
a<-table.element(a,round(sqrt(mean((result$Residuals)^2)),4))
a<-table.row.end(a)
a<-table.end(a)
table.save(a,file='mytable1.tab')
a<-table.start()
a<-table.row.start(a)
a<-table.element(a,'Actuals, Predictions, and Residuals',4,TRUE)
a<-table.row.end(a)
a<-table.row.start(a)
a<-table.element(a,'#',header=TRUE)
a<-table.element(a,'Actuals',header=TRUE)
a<-table.element(a,'Forecasts',header=TRUE)
a<-table.element(a,'Residuals',header=TRUE)
a<-table.row.end(a)
for (i in 1:length(result$Actuals)) {
a<-table.row.start(a)
a<-table.element(a,i,header=TRUE)
a<-table.element(a,result$Actuals[i])
a<-table.element(a,result$Forecasts[i])
a<-table.element(a,result$Residuals[i])
a<-table.row.end(a)
}
a<-table.end(a)
table.save(a,file='mytable.tab')
}
if (par2 != 'none') {
a<-table.start()
a<-table.row.start(a)
a<-table.element(a,'Confusion Matrix (predicted in columns / actuals in rows)',par3+1,TRUE)
a<-table.row.end(a)
a<-table.row.start(a)
a<-table.element(a,'',1,TRUE)
for (i in 1:par3) {
a<-table.element(a,paste('C',i,sep=''),1,TRUE)
}
a<-table.row.end(a)
for (i in 1:par3) {
a<-table.row.start(a)
a<-table.element(a,paste('C',i,sep=''),1,TRUE)
for (j in 1:par3) {
a<-table.element(a,myt[i,j])
}
a<-table.row.end(a)
}
a<-table.end(a)
table.save(a,file='mytable2.tab')
}