Free Statistics

of Irreproducible Research!

Author's title

Author*The author of this computation has been verified*
R Software Modulerwasp_arimabackwardselection.wasp
Title produced by softwareARIMA Backward Selection
Date of computationSat, 25 Dec 2010 16:11:12 +0000
Cite this page as followsStatistical Computations at FreeStatistics.org, Office for Research Development and Education, URL https://freestatistics.org/blog/index.php?v=date/2010/Dec/25/t1293293579vqtjqzn197rpo04.htm/, Retrieved Sun, 28 Apr 2024 19:06:27 +0000
Statistical Computations at FreeStatistics.org, Office for Research Development and Education, URL https://freestatistics.org/blog/index.php?pk=115412, Retrieved Sun, 28 Apr 2024 19:06:27 +0000
QR Codes:

Original text written by user:
IsPrivate?No (this computation is public)
User-defined keywords
Estimated Impact134
Family? (F = Feedback message, R = changed R code, M = changed R Module, P = changed Parameters, D = changed Data)
-       [ARIMA Backward Selection] [] [2010-12-25 16:11:12] [b7dd4adfab743bef2d672ff51f950617] [Current]
Feedback Forum

Post a new message
Dataseries X:
186448
190530
194207
190855
200779
204428
207617
212071
214239
215883
223484
221529
225247
226699
231406
232324
237192
236727
240698
240688
245283
243556
247826
245798
250479
249216
251896
247616
249994
246552
248771
247551
249745
245742
249019
245841
248771
244723
246878
246014
248496
244351
248016
246509
249426
247840
251035
250161
254278
250801
253985
249174
251287
247947
249992
243805
255812
250417
253033
248705
253950
251484
251093
245996
252721
248019
250464
245571
252690
250183
253639
254436
265280
268705
270643
271480


Summary of computational transaction
Raw Inputview raw input (R code)
Raw Outputview raw output of R engine
Computing time4 seconds
R Server'RServer@AstonUniversity' @ vre.aston.ac.uk

\begin{tabular}{lllllllll}
\hline
Summary of computational transaction \tabularnewline
Raw Input & view raw input (R code)  \tabularnewline
Raw Output & view raw output of R engine  \tabularnewline
Computing time & 4 seconds \tabularnewline
R Server & 'RServer@AstonUniversity' @ vre.aston.ac.uk \tabularnewline
\hline
\end{tabular}
%Source: https://freestatistics.org/blog/index.php?pk=115412&T=0

[TABLE]
[ROW][C]Summary of computational transaction[/C][/ROW]
[ROW][C]Raw Input[/C][C]view raw input (R code) [/C][/ROW]
[ROW][C]Raw Output[/C][C]view raw output of R engine [/C][/ROW]
[ROW][C]Computing time[/C][C]4 seconds[/C][/ROW]
[ROW][C]R Server[/C][C]'RServer@AstonUniversity' @ vre.aston.ac.uk[/C][/ROW]
[/TABLE]
Source: https://freestatistics.org/blog/index.php?pk=115412&T=0

Globally Unique Identifier (entire table): ba.freestatistics.org/blog/index.php?pk=115412&T=0

As an alternative you can also use a QR Code:  

The GUIDs for individual cells are displayed in the table below:

Summary of computational transaction
Raw Inputview raw input (R code)
Raw Outputview raw output of R engine
Computing time4 seconds
R Server'RServer@AstonUniversity' @ vre.aston.ac.uk


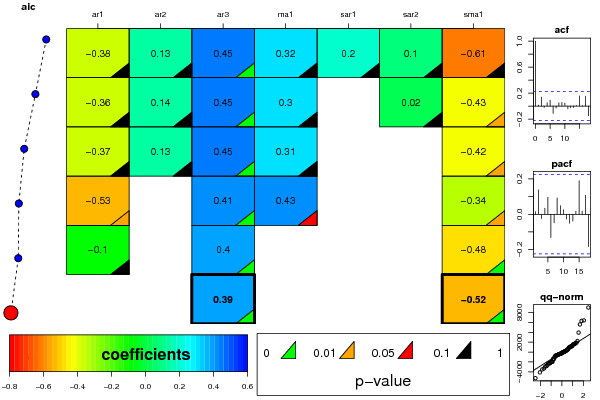
ARIMA Parameter Estimation and Backward Selection
Iterationar1ar2ar3ma1sar1sar2sma1
Estimates ( 1 )-0.37890.13160.45440.31790.19580.095-0.6129
(p-val)(0.2114 )(0.3133 )(4e-04 )(0.303 )(0.7784 )(0.776 )(0.3445 )
Estimates ( 2 )-0.3580.13810.44980.296300.023-0.4343
(p-val)(0.2539 )(0.2826 )(5e-04 )(0.3506 )(NA )(0.8953 )(0.0305 )
Estimates ( 3 )-0.37250.13470.45490.309200-0.4214
(p-val)(0.1833 )(0.2863 )(2e-04 )(0.2827 )(NA )(NA )(0.0137 )
Estimates ( 4 )-0.527200.41040.425400-0.3424
(p-val)(0.017 )(NA )(2e-04 )(0.0673 )(NA )(NA )(0.0358 )
Estimates ( 5 )-0.099800.4001000-0.4849
(p-val)(0.4041 )(NA )(0.0011 )(NA )(NA )(NA )(4e-04 )
Estimates ( 6 )000.39000-0.5242
(p-val)(NA )(NA )(0.0015 )(NA )(NA )(NA )(0 )
Estimates ( 7 )NANANANANANANA
(p-val)(NA )(NA )(NA )(NA )(NA )(NA )(NA )
Estimates ( 8 )NANANANANANANA
(p-val)(NA )(NA )(NA )(NA )(NA )(NA )(NA )
Estimates ( 9 )NANANANANANANA
(p-val)(NA )(NA )(NA )(NA )(NA )(NA )(NA )
Estimates ( 10 )NANANANANANANA
(p-val)(NA )(NA )(NA )(NA )(NA )(NA )(NA )
Estimates ( 11 )NANANANANANANA
(p-val)(NA )(NA )(NA )(NA )(NA )(NA )(NA )
Estimates ( 12 )NANANANANANANA
(p-val)(NA )(NA )(NA )(NA )(NA )(NA )(NA )
Estimates ( 13 )NANANANANANANA
(p-val)(NA )(NA )(NA )(NA )(NA )(NA )(NA )

\begin{tabular}{lllllllll}
\hline
ARIMA Parameter Estimation and Backward Selection \tabularnewline
Iteration & ar1 & ar2 & ar3 & ma1 & sar1 & sar2 & sma1 \tabularnewline
Estimates ( 1 ) & -0.3789 & 0.1316 & 0.4544 & 0.3179 & 0.1958 & 0.095 & -0.6129 \tabularnewline
(p-val) & (0.2114 ) & (0.3133 ) & (4e-04 ) & (0.303 ) & (0.7784 ) & (0.776 ) & (0.3445 ) \tabularnewline
Estimates ( 2 ) & -0.358 & 0.1381 & 0.4498 & 0.2963 & 0 & 0.023 & -0.4343 \tabularnewline
(p-val) & (0.2539 ) & (0.2826 ) & (5e-04 ) & (0.3506 ) & (NA ) & (0.8953 ) & (0.0305 ) \tabularnewline
Estimates ( 3 ) & -0.3725 & 0.1347 & 0.4549 & 0.3092 & 0 & 0 & -0.4214 \tabularnewline
(p-val) & (0.1833 ) & (0.2863 ) & (2e-04 ) & (0.2827 ) & (NA ) & (NA ) & (0.0137 ) \tabularnewline
Estimates ( 4 ) & -0.5272 & 0 & 0.4104 & 0.4254 & 0 & 0 & -0.3424 \tabularnewline
(p-val) & (0.017 ) & (NA ) & (2e-04 ) & (0.0673 ) & (NA ) & (NA ) & (0.0358 ) \tabularnewline
Estimates ( 5 ) & -0.0998 & 0 & 0.4001 & 0 & 0 & 0 & -0.4849 \tabularnewline
(p-val) & (0.4041 ) & (NA ) & (0.0011 ) & (NA ) & (NA ) & (NA ) & (4e-04 ) \tabularnewline
Estimates ( 6 ) & 0 & 0 & 0.39 & 0 & 0 & 0 & -0.5242 \tabularnewline
(p-val) & (NA ) & (NA ) & (0.0015 ) & (NA ) & (NA ) & (NA ) & (0 ) \tabularnewline
Estimates ( 7 ) & NA & NA & NA & NA & NA & NA & NA \tabularnewline
(p-val) & (NA ) & (NA ) & (NA ) & (NA ) & (NA ) & (NA ) & (NA ) \tabularnewline
Estimates ( 8 ) & NA & NA & NA & NA & NA & NA & NA \tabularnewline
(p-val) & (NA ) & (NA ) & (NA ) & (NA ) & (NA ) & (NA ) & (NA ) \tabularnewline
Estimates ( 9 ) & NA & NA & NA & NA & NA & NA & NA \tabularnewline
(p-val) & (NA ) & (NA ) & (NA ) & (NA ) & (NA ) & (NA ) & (NA ) \tabularnewline
Estimates ( 10 ) & NA & NA & NA & NA & NA & NA & NA \tabularnewline
(p-val) & (NA ) & (NA ) & (NA ) & (NA ) & (NA ) & (NA ) & (NA ) \tabularnewline
Estimates ( 11 ) & NA & NA & NA & NA & NA & NA & NA \tabularnewline
(p-val) & (NA ) & (NA ) & (NA ) & (NA ) & (NA ) & (NA ) & (NA ) \tabularnewline
Estimates ( 12 ) & NA & NA & NA & NA & NA & NA & NA \tabularnewline
(p-val) & (NA ) & (NA ) & (NA ) & (NA ) & (NA ) & (NA ) & (NA ) \tabularnewline
Estimates ( 13 ) & NA & NA & NA & NA & NA & NA & NA \tabularnewline
(p-val) & (NA ) & (NA ) & (NA ) & (NA ) & (NA ) & (NA ) & (NA ) \tabularnewline
\hline
\end{tabular}
%Source: https://freestatistics.org/blog/index.php?pk=115412&T=1

[TABLE]
[ROW][C]ARIMA Parameter Estimation and Backward Selection[/C][/ROW]
[ROW][C]Iteration[/C][C]ar1[/C][C]ar2[/C][C]ar3[/C][C]ma1[/C][C]sar1[/C][C]sar2[/C][C]sma1[/C][/ROW]
[ROW][C]Estimates ( 1 )[/C][C]-0.3789[/C][C]0.1316[/C][C]0.4544[/C][C]0.3179[/C][C]0.1958[/C][C]0.095[/C][C]-0.6129[/C][/ROW]
[ROW][C](p-val)[/C][C](0.2114 )[/C][C](0.3133 )[/C][C](4e-04 )[/C][C](0.303 )[/C][C](0.7784 )[/C][C](0.776 )[/C][C](0.3445 )[/C][/ROW]
[ROW][C]Estimates ( 2 )[/C][C]-0.358[/C][C]0.1381[/C][C]0.4498[/C][C]0.2963[/C][C]0[/C][C]0.023[/C][C]-0.4343[/C][/ROW]
[ROW][C](p-val)[/C][C](0.2539 )[/C][C](0.2826 )[/C][C](5e-04 )[/C][C](0.3506 )[/C][C](NA )[/C][C](0.8953 )[/C][C](0.0305 )[/C][/ROW]
[ROW][C]Estimates ( 3 )[/C][C]-0.3725[/C][C]0.1347[/C][C]0.4549[/C][C]0.3092[/C][C]0[/C][C]0[/C][C]-0.4214[/C][/ROW]
[ROW][C](p-val)[/C][C](0.1833 )[/C][C](0.2863 )[/C][C](2e-04 )[/C][C](0.2827 )[/C][C](NA )[/C][C](NA )[/C][C](0.0137 )[/C][/ROW]
[ROW][C]Estimates ( 4 )[/C][C]-0.5272[/C][C]0[/C][C]0.4104[/C][C]0.4254[/C][C]0[/C][C]0[/C][C]-0.3424[/C][/ROW]
[ROW][C](p-val)[/C][C](0.017 )[/C][C](NA )[/C][C](2e-04 )[/C][C](0.0673 )[/C][C](NA )[/C][C](NA )[/C][C](0.0358 )[/C][/ROW]
[ROW][C]Estimates ( 5 )[/C][C]-0.0998[/C][C]0[/C][C]0.4001[/C][C]0[/C][C]0[/C][C]0[/C][C]-0.4849[/C][/ROW]
[ROW][C](p-val)[/C][C](0.4041 )[/C][C](NA )[/C][C](0.0011 )[/C][C](NA )[/C][C](NA )[/C][C](NA )[/C][C](4e-04 )[/C][/ROW]
[ROW][C]Estimates ( 6 )[/C][C]0[/C][C]0[/C][C]0.39[/C][C]0[/C][C]0[/C][C]0[/C][C]-0.5242[/C][/ROW]
[ROW][C](p-val)[/C][C](NA )[/C][C](NA )[/C][C](0.0015 )[/C][C](NA )[/C][C](NA )[/C][C](NA )[/C][C](0 )[/C][/ROW]
[ROW][C]Estimates ( 7 )[/C][C]NA[/C][C]NA[/C][C]NA[/C][C]NA[/C][C]NA[/C][C]NA[/C][C]NA[/C][/ROW]
[ROW][C](p-val)[/C][C](NA )[/C][C](NA )[/C][C](NA )[/C][C](NA )[/C][C](NA )[/C][C](NA )[/C][C](NA )[/C][/ROW]
[ROW][C]Estimates ( 8 )[/C][C]NA[/C][C]NA[/C][C]NA[/C][C]NA[/C][C]NA[/C][C]NA[/C][C]NA[/C][/ROW]
[ROW][C](p-val)[/C][C](NA )[/C][C](NA )[/C][C](NA )[/C][C](NA )[/C][C](NA )[/C][C](NA )[/C][C](NA )[/C][/ROW]
[ROW][C]Estimates ( 9 )[/C][C]NA[/C][C]NA[/C][C]NA[/C][C]NA[/C][C]NA[/C][C]NA[/C][C]NA[/C][/ROW]
[ROW][C](p-val)[/C][C](NA )[/C][C](NA )[/C][C](NA )[/C][C](NA )[/C][C](NA )[/C][C](NA )[/C][C](NA )[/C][/ROW]
[ROW][C]Estimates ( 10 )[/C][C]NA[/C][C]NA[/C][C]NA[/C][C]NA[/C][C]NA[/C][C]NA[/C][C]NA[/C][/ROW]
[ROW][C](p-val)[/C][C](NA )[/C][C](NA )[/C][C](NA )[/C][C](NA )[/C][C](NA )[/C][C](NA )[/C][C](NA )[/C][/ROW]
[ROW][C]Estimates ( 11 )[/C][C]NA[/C][C]NA[/C][C]NA[/C][C]NA[/C][C]NA[/C][C]NA[/C][C]NA[/C][/ROW]
[ROW][C](p-val)[/C][C](NA )[/C][C](NA )[/C][C](NA )[/C][C](NA )[/C][C](NA )[/C][C](NA )[/C][C](NA )[/C][/ROW]
[ROW][C]Estimates ( 12 )[/C][C]NA[/C][C]NA[/C][C]NA[/C][C]NA[/C][C]NA[/C][C]NA[/C][C]NA[/C][/ROW]
[ROW][C](p-val)[/C][C](NA )[/C][C](NA )[/C][C](NA )[/C][C](NA )[/C][C](NA )[/C][C](NA )[/C][C](NA )[/C][/ROW]
[ROW][C]Estimates ( 13 )[/C][C]NA[/C][C]NA[/C][C]NA[/C][C]NA[/C][C]NA[/C][C]NA[/C][C]NA[/C][/ROW]
[ROW][C](p-val)[/C][C](NA )[/C][C](NA )[/C][C](NA )[/C][C](NA )[/C][C](NA )[/C][C](NA )[/C][C](NA )[/C][/ROW]
[/TABLE]
Source: https://freestatistics.org/blog/index.php?pk=115412&T=1

Globally Unique Identifier (entire table): ba.freestatistics.org/blog/index.php?pk=115412&T=1

As an alternative you can also use a QR Code:  

The GUIDs for individual cells are displayed in the table below:

ARIMA Parameter Estimation and Backward Selection
Iterationar1ar2ar3ma1sar1sar2sma1
Estimates ( 1 )-0.37890.13160.45440.31790.19580.095-0.6129
(p-val)(0.2114 )(0.3133 )(4e-04 )(0.303 )(0.7784 )(0.776 )(0.3445 )
Estimates ( 2 )-0.3580.13810.44980.296300.023-0.4343
(p-val)(0.2539 )(0.2826 )(5e-04 )(0.3506 )(NA )(0.8953 )(0.0305 )
Estimates ( 3 )-0.37250.13470.45490.309200-0.4214
(p-val)(0.1833 )(0.2863 )(2e-04 )(0.2827 )(NA )(NA )(0.0137 )
Estimates ( 4 )-0.527200.41040.425400-0.3424
(p-val)(0.017 )(NA )(2e-04 )(0.0673 )(NA )(NA )(0.0358 )
Estimates ( 5 )-0.099800.4001000-0.4849
(p-val)(0.4041 )(NA )(0.0011 )(NA )(NA )(NA )(4e-04 )
Estimates ( 6 )000.39000-0.5242
(p-val)(NA )(NA )(0.0015 )(NA )(NA )(NA )(0 )
Estimates ( 7 )NANANANANANANA
(p-val)(NA )(NA )(NA )(NA )(NA )(NA )(NA )
Estimates ( 8 )NANANANANANANA
(p-val)(NA )(NA )(NA )(NA )(NA )(NA )(NA )
Estimates ( 9 )NANANANANANANA
(p-val)(NA )(NA )(NA )(NA )(NA )(NA )(NA )
Estimates ( 10 )NANANANANANANA
(p-val)(NA )(NA )(NA )(NA )(NA )(NA )(NA )
Estimates ( 11 )NANANANANANANA
(p-val)(NA )(NA )(NA )(NA )(NA )(NA )(NA )
Estimates ( 12 )NANANANANANANA
(p-val)(NA )(NA )(NA )(NA )(NA )(NA )(NA )
Estimates ( 13 )NANANANANANANA
(p-val)(NA )(NA )(NA )(NA )(NA )(NA )(NA )


Estimated ARIMA Residuals
Value
-363.83945188921
-343.321747065242
-489.263001243245
6294.92943037293
-5282.93585005829
-2284.72136388931
1228.62186590805
-623.986456180448
-609.421458642644
-2833.85847894259
198.729585518677
1641.06298808284
1228.35920623529
-1998.89372087127
-1974.60810626374
-672.496087341258
992.144893942072
-1962.82741244733
-412.289849077054
-2203.59188033349
869.224935020408
-598.60305324322
-936.465200909406
-3512.82333987666
-2292.15749447355
-2063.0381192683
-231.736157523561
2232.05665343612
-118.128752306745
-1395.21993340156
-334.583205401361
-696.517771403779
707.726045442992
-1071.3387912021
-505.372327788403
1569.81912070699
144.138999990219
-212.303531117629
329.488498481152
448.135912644547
479.518273390109
1895.35675209649
202.438658337668
629.347808856986
471.891430836052
-664.155209186357
-354.83832915104
-4113.03104027946
-1411.60427879569
-380.66529437784
277.729508204345
-2682.27895957021
9017.37881325937
-796.331285223787
1051.05835120349
-3342.98628604096
-1381.88696174355
1639.48435769393
-2948.74919060045
15.2282840630945
-438.645256589153
-90.2757030825148
1490.67115256693
-97.6609806401635
1096.24591124908
1055.92920772076
1871.28012278336
5585.92623589342
3946.32099204379
6411.33140469441
-2294.99727385037
1106.72335853597

\begin{tabular}{lllllllll}
\hline
Estimated ARIMA Residuals \tabularnewline
Value \tabularnewline
-363.83945188921 \tabularnewline
-343.321747065242 \tabularnewline
-489.263001243245 \tabularnewline
6294.92943037293 \tabularnewline
-5282.93585005829 \tabularnewline
-2284.72136388931 \tabularnewline
1228.62186590805 \tabularnewline
-623.986456180448 \tabularnewline
-609.421458642644 \tabularnewline
-2833.85847894259 \tabularnewline
198.729585518677 \tabularnewline
1641.06298808284 \tabularnewline
1228.35920623529 \tabularnewline
-1998.89372087127 \tabularnewline
-1974.60810626374 \tabularnewline
-672.496087341258 \tabularnewline
992.144893942072 \tabularnewline
-1962.82741244733 \tabularnewline
-412.289849077054 \tabularnewline
-2203.59188033349 \tabularnewline
869.224935020408 \tabularnewline
-598.60305324322 \tabularnewline
-936.465200909406 \tabularnewline
-3512.82333987666 \tabularnewline
-2292.15749447355 \tabularnewline
-2063.0381192683 \tabularnewline
-231.736157523561 \tabularnewline
2232.05665343612 \tabularnewline
-118.128752306745 \tabularnewline
-1395.21993340156 \tabularnewline
-334.583205401361 \tabularnewline
-696.517771403779 \tabularnewline
707.726045442992 \tabularnewline
-1071.3387912021 \tabularnewline
-505.372327788403 \tabularnewline
1569.81912070699 \tabularnewline
144.138999990219 \tabularnewline
-212.303531117629 \tabularnewline
329.488498481152 \tabularnewline
448.135912644547 \tabularnewline
479.518273390109 \tabularnewline
1895.35675209649 \tabularnewline
202.438658337668 \tabularnewline
629.347808856986 \tabularnewline
471.891430836052 \tabularnewline
-664.155209186357 \tabularnewline
-354.83832915104 \tabularnewline
-4113.03104027946 \tabularnewline
-1411.60427879569 \tabularnewline
-380.66529437784 \tabularnewline
277.729508204345 \tabularnewline
-2682.27895957021 \tabularnewline
9017.37881325937 \tabularnewline
-796.331285223787 \tabularnewline
1051.05835120349 \tabularnewline
-3342.98628604096 \tabularnewline
-1381.88696174355 \tabularnewline
1639.48435769393 \tabularnewline
-2948.74919060045 \tabularnewline
15.2282840630945 \tabularnewline
-438.645256589153 \tabularnewline
-90.2757030825148 \tabularnewline
1490.67115256693 \tabularnewline
-97.6609806401635 \tabularnewline
1096.24591124908 \tabularnewline
1055.92920772076 \tabularnewline
1871.28012278336 \tabularnewline
5585.92623589342 \tabularnewline
3946.32099204379 \tabularnewline
6411.33140469441 \tabularnewline
-2294.99727385037 \tabularnewline
1106.72335853597 \tabularnewline
\hline
\end{tabular}
%Source: https://freestatistics.org/blog/index.php?pk=115412&T=2

[TABLE]
[ROW][C]Estimated ARIMA Residuals[/C][/ROW]
[ROW][C]Value[/C][/ROW]
[ROW][C]-363.83945188921[/C][/ROW]
[ROW][C]-343.321747065242[/C][/ROW]
[ROW][C]-489.263001243245[/C][/ROW]
[ROW][C]6294.92943037293[/C][/ROW]
[ROW][C]-5282.93585005829[/C][/ROW]
[ROW][C]-2284.72136388931[/C][/ROW]
[ROW][C]1228.62186590805[/C][/ROW]
[ROW][C]-623.986456180448[/C][/ROW]
[ROW][C]-609.421458642644[/C][/ROW]
[ROW][C]-2833.85847894259[/C][/ROW]
[ROW][C]198.729585518677[/C][/ROW]
[ROW][C]1641.06298808284[/C][/ROW]
[ROW][C]1228.35920623529[/C][/ROW]
[ROW][C]-1998.89372087127[/C][/ROW]
[ROW][C]-1974.60810626374[/C][/ROW]
[ROW][C]-672.496087341258[/C][/ROW]
[ROW][C]992.144893942072[/C][/ROW]
[ROW][C]-1962.82741244733[/C][/ROW]
[ROW][C]-412.289849077054[/C][/ROW]
[ROW][C]-2203.59188033349[/C][/ROW]
[ROW][C]869.224935020408[/C][/ROW]
[ROW][C]-598.60305324322[/C][/ROW]
[ROW][C]-936.465200909406[/C][/ROW]
[ROW][C]-3512.82333987666[/C][/ROW]
[ROW][C]-2292.15749447355[/C][/ROW]
[ROW][C]-2063.0381192683[/C][/ROW]
[ROW][C]-231.736157523561[/C][/ROW]
[ROW][C]2232.05665343612[/C][/ROW]
[ROW][C]-118.128752306745[/C][/ROW]
[ROW][C]-1395.21993340156[/C][/ROW]
[ROW][C]-334.583205401361[/C][/ROW]
[ROW][C]-696.517771403779[/C][/ROW]
[ROW][C]707.726045442992[/C][/ROW]
[ROW][C]-1071.3387912021[/C][/ROW]
[ROW][C]-505.372327788403[/C][/ROW]
[ROW][C]1569.81912070699[/C][/ROW]
[ROW][C]144.138999990219[/C][/ROW]
[ROW][C]-212.303531117629[/C][/ROW]
[ROW][C]329.488498481152[/C][/ROW]
[ROW][C]448.135912644547[/C][/ROW]
[ROW][C]479.518273390109[/C][/ROW]
[ROW][C]1895.35675209649[/C][/ROW]
[ROW][C]202.438658337668[/C][/ROW]
[ROW][C]629.347808856986[/C][/ROW]
[ROW][C]471.891430836052[/C][/ROW]
[ROW][C]-664.155209186357[/C][/ROW]
[ROW][C]-354.83832915104[/C][/ROW]
[ROW][C]-4113.03104027946[/C][/ROW]
[ROW][C]-1411.60427879569[/C][/ROW]
[ROW][C]-380.66529437784[/C][/ROW]
[ROW][C]277.729508204345[/C][/ROW]
[ROW][C]-2682.27895957021[/C][/ROW]
[ROW][C]9017.37881325937[/C][/ROW]
[ROW][C]-796.331285223787[/C][/ROW]
[ROW][C]1051.05835120349[/C][/ROW]
[ROW][C]-3342.98628604096[/C][/ROW]
[ROW][C]-1381.88696174355[/C][/ROW]
[ROW][C]1639.48435769393[/C][/ROW]
[ROW][C]-2948.74919060045[/C][/ROW]
[ROW][C]15.2282840630945[/C][/ROW]
[ROW][C]-438.645256589153[/C][/ROW]
[ROW][C]-90.2757030825148[/C][/ROW]
[ROW][C]1490.67115256693[/C][/ROW]
[ROW][C]-97.6609806401635[/C][/ROW]
[ROW][C]1096.24591124908[/C][/ROW]
[ROW][C]1055.92920772076[/C][/ROW]
[ROW][C]1871.28012278336[/C][/ROW]
[ROW][C]5585.92623589342[/C][/ROW]
[ROW][C]3946.32099204379[/C][/ROW]
[ROW][C]6411.33140469441[/C][/ROW]
[ROW][C]-2294.99727385037[/C][/ROW]
[ROW][C]1106.72335853597[/C][/ROW]
[/TABLE]
Source: https://freestatistics.org/blog/index.php?pk=115412&T=2

Globally Unique Identifier (entire table): ba.freestatistics.org/blog/index.php?pk=115412&T=2

As an alternative you can also use a QR Code:  

The GUIDs for individual cells are displayed in the table below:

Estimated ARIMA Residuals
Value
-363.83945188921
-343.321747065242
-489.263001243245
6294.92943037293
-5282.93585005829
-2284.72136388931
1228.62186590805
-623.986456180448
-609.421458642644
-2833.85847894259
198.729585518677
1641.06298808284
1228.35920623529
-1998.89372087127
-1974.60810626374
-672.496087341258
992.144893942072
-1962.82741244733
-412.289849077054
-2203.59188033349
869.224935020408
-598.60305324322
-936.465200909406
-3512.82333987666
-2292.15749447355
-2063.0381192683
-231.736157523561
2232.05665343612
-118.128752306745
-1395.21993340156
-334.583205401361
-696.517771403779
707.726045442992
-1071.3387912021
-505.372327788403
1569.81912070699
144.138999990219
-212.303531117629
329.488498481152
448.135912644547
479.518273390109
1895.35675209649
202.438658337668
629.347808856986
471.891430836052
-664.155209186357
-354.83832915104
-4113.03104027946
-1411.60427879569
-380.66529437784
277.729508204345
-2682.27895957021
9017.37881325937
-796.331285223787
1051.05835120349
-3342.98628604096
-1381.88696174355
1639.48435769393
-2948.74919060045
15.2282840630945
-438.645256589153
-90.2757030825148
1490.67115256693
-97.6609806401635
1096.24591124908
1055.92920772076
1871.28012278336
5585.92623589342
3946.32099204379
6411.33140469441
-2294.99727385037
1106.72335853597


Parameters (Session):
par1 = FALSE ; par2 = 1 ; par3 = 1 ; par4 = 1 ; par5 = 4 ; par6 = 3 ; par7 = 1 ; par8 = 2 ; par9 = 1 ;
Parameters (R input):
par1 = FALSE ; par2 = 1 ; par3 = 1 ; par4 = 1 ; par5 = 4 ; par6 = 3 ; par7 = 1 ; par8 = 2 ; par9 = 1 ;
R code (references can be found in the software module):
library(lattice)
if (par1 == 'TRUE') par1 <- TRUE
if (par1 == 'FALSE') par1 <- FALSE
par2 <- as.numeric(par2) #Box-Cox lambda transformation parameter
par3 <- as.numeric(par3) #degree of non-seasonal differencing
par4 <- as.numeric(par4) #degree of seasonal differencing
par5 <- as.numeric(par5) #seasonal period
par6 <- as.numeric(par6) #degree (p) of the non-seasonal AR(p) polynomial
par7 <- as.numeric(par7) #degree (q) of the non-seasonal MA(q) polynomial
par8 <- as.numeric(par8) #degree (P) of the seasonal AR(P) polynomial
par9 <- as.numeric(par9) #degree (Q) of the seasonal MA(Q) polynomial
armaGR <- function(arima.out, names, n){
try1 <- arima.out$coef
try2 <- sqrt(diag(arima.out$var.coef))
try.data.frame <- data.frame(matrix(NA,ncol=4,nrow=length(names)))
dimnames(try.data.frame) <- list(names,c('coef','std','tstat','pv'))
try.data.frame[,1] <- try1
for(i in 1:length(try2)) try.data.frame[which(rownames(try.data.frame)==names(try2)[i]),2] <- try2[i]
try.data.frame[,3] <- try.data.frame[,1] / try.data.frame[,2]
try.data.frame[,4] <- round((1-pt(abs(try.data.frame[,3]),df=n-(length(try2)+1)))*2,5)
vector <- rep(NA,length(names))
vector[is.na(try.data.frame[,4])] <- 0
maxi <- which.max(try.data.frame[,4])
continue <- max(try.data.frame[,4],na.rm=TRUE) > .05
vector[maxi] <- 0
list(summary=try.data.frame,next.vector=vector,continue=continue)
}
arimaSelect <- function(series, order=c(13,0,0), seasonal=list(order=c(2,0,0),period=12), include.mean=F){
nrc <- order[1]+order[3]+seasonal$order[1]+seasonal$order[3]
coeff <- matrix(NA, nrow=nrc*2, ncol=nrc)
pval <- matrix(NA, nrow=nrc*2, ncol=nrc)
mylist <- rep(list(NULL), nrc)
names <- NULL
if(order[1] > 0) names <- paste('ar',1:order[1],sep='')
if(order[3] > 0) names <- c( names , paste('ma',1:order[3],sep='') )
if(seasonal$order[1] > 0) names <- c(names, paste('sar',1:seasonal$order[1],sep=''))
if(seasonal$order[3] > 0) names <- c(names, paste('sma',1:seasonal$order[3],sep=''))
arima.out <- arima(series, order=order, seasonal=seasonal, include.mean=include.mean, method='ML')
mylist[[1]] <- arima.out
last.arma <- armaGR(arima.out, names, length(series))
mystop <- FALSE
i <- 1
coeff[i,] <- last.arma[[1]][,1]
pval [i,] <- last.arma[[1]][,4]
i <- 2
aic <- arima.out$aic
while(!mystop){
mylist[[i]] <- arima.out
arima.out <- arima(series, order=order, seasonal=seasonal, include.mean=include.mean, method='ML', fixed=last.arma$next.vector)
aic <- c(aic, arima.out$aic)
last.arma <- armaGR(arima.out, names, length(series))
mystop <- !last.arma$continue
coeff[i,] <- last.arma[[1]][,1]
pval [i,] <- last.arma[[1]][,4]
i <- i+1
}
list(coeff, pval, mylist, aic=aic)
}
arimaSelectplot <- function(arimaSelect.out,noms,choix){
noms <- names(arimaSelect.out[[3]][[1]]$coef)
coeff <- arimaSelect.out[[1]]
k <- min(which(is.na(coeff[,1])))-1
coeff <- coeff[1:k,]
pval <- arimaSelect.out[[2]][1:k,]
aic <- arimaSelect.out$aic[1:k]
coeff[coeff==0] <- NA
n <- ncol(coeff)
if(missing(choix)) choix <- k
layout(matrix(c(1,1,1,2,
3,3,3,2,
3,3,3,4,
5,6,7,7),nr=4),
widths=c(10,35,45,15),
heights=c(30,30,15,15))
couleurs <- rainbow(75)[1:50]#(50)
ticks <- pretty(coeff)
par(mar=c(1,1,3,1))
plot(aic,k:1-.5,type='o',pch=21,bg='blue',cex=2,axes=F,lty=2,xpd=NA)
points(aic[choix],k-choix+.5,pch=21,cex=4,bg=2,xpd=NA)
title('aic',line=2)
par(mar=c(3,0,0,0))
plot(0,axes=F,xlab='',ylab='',xlim=range(ticks),ylim=c(.1,1))
rect(xleft = min(ticks) + (0:49)/50*(max(ticks)-min(ticks)),
xright = min(ticks) + (1:50)/50*(max(ticks)-min(ticks)),
ytop = rep(1,50),
ybottom= rep(0,50),col=couleurs,border=NA)
axis(1,ticks)
rect(xleft=min(ticks),xright=max(ticks),ytop=1,ybottom=0)
text(mean(coeff,na.rm=T),.5,'coefficients',cex=2,font=2)
par(mar=c(1,1,3,1))
image(1:n,1:k,t(coeff[k:1,]),axes=F,col=couleurs,zlim=range(ticks))
for(i in 1:n) for(j in 1:k) if(!is.na(coeff[j,i])) {
if(pval[j,i]<.01) symb = 'green'
else if( (pval[j,i]<.05) & (pval[j,i]>=.01)) symb = 'orange'
else if( (pval[j,i]<.1) & (pval[j,i]>=.05)) symb = 'red'
else symb = 'black'
polygon(c(i+.5 ,i+.2 ,i+.5 ,i+.5),
c(k-j+0.5,k-j+0.5,k-j+0.8,k-j+0.5),
col=symb)
if(j==choix) {
rect(xleft=i-.5,
xright=i+.5,
ybottom=k-j+1.5,
ytop=k-j+.5,
lwd=4)
text(i,
k-j+1,
round(coeff[j,i],2),
cex=1.2,
font=2)
}
else{
rect(xleft=i-.5,xright=i+.5,ybottom=k-j+1.5,ytop=k-j+.5)
text(i,k-j+1,round(coeff[j,i],2),cex=1.2,font=1)
}
}
axis(3,1:n,noms)
par(mar=c(0.5,0,0,0.5))
plot(0,axes=F,xlab='',ylab='',type='n',xlim=c(0,8),ylim=c(-.2,.8))
cols <- c('green','orange','red','black')
niv <- c('0','0.01','0.05','0.1')
for(i in 0:3){
polygon(c(1+2*i ,1+2*i ,1+2*i-.5 ,1+2*i),
c(.4 ,.7 , .4 , .4),
col=cols[i+1])
text(2*i,0.5,niv[i+1],cex=1.5)
}
text(8,.5,1,cex=1.5)
text(4,0,'p-value',cex=2)
box()
residus <- arimaSelect.out[[3]][[choix]]$res
par(mar=c(1,2,4,1))
acf(residus,main='')
title('acf',line=.5)
par(mar=c(1,2,4,1))
pacf(residus,main='')
title('pacf',line=.5)
par(mar=c(2,2,4,1))
qqnorm(residus,main='')
title('qq-norm',line=.5)
qqline(residus)
residus
}
if (par2 == 0) x <- log(x)
if (par2 != 0) x <- x^par2
(selection <- arimaSelect(x, order=c(par6,par3,par7), seasonal=list(order=c(par8,par4,par9), period=par5)))
bitmap(file='test1.png')
resid <- arimaSelectplot(selection)
dev.off()
resid
bitmap(file='test2.png')
acf(resid,length(resid)/2, main='Residual Autocorrelation Function')
dev.off()
bitmap(file='test3.png')
pacf(resid,length(resid)/2, main='Residual Partial Autocorrelation Function')
dev.off()
bitmap(file='test4.png')
cpgram(resid, main='Residual Cumulative Periodogram')
dev.off()
bitmap(file='test5.png')
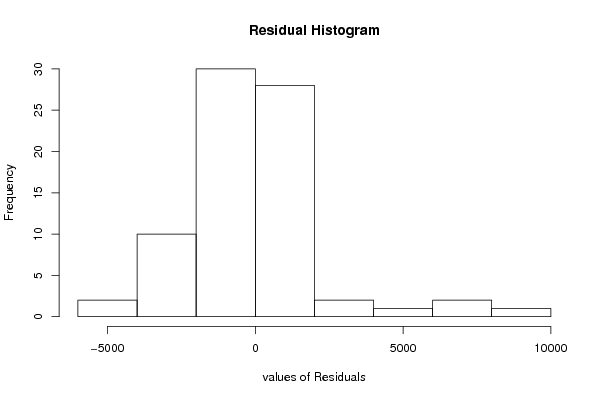
hist(resid, main='Residual Histogram', xlab='values of Residuals')
dev.off()
bitmap(file='test6.png')
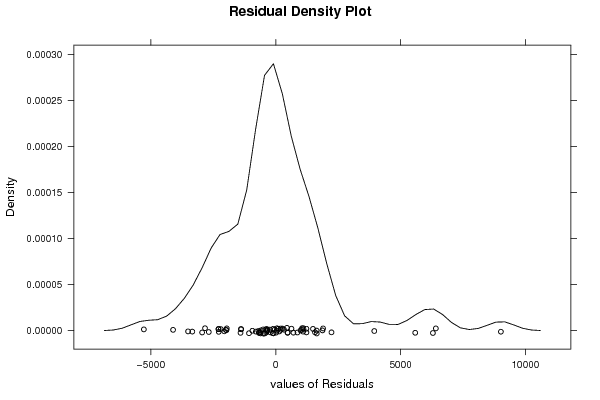
densityplot(~resid,col='black',main='Residual Density Plot', xlab='values of Residuals')
dev.off()
bitmap(file='test7.png')
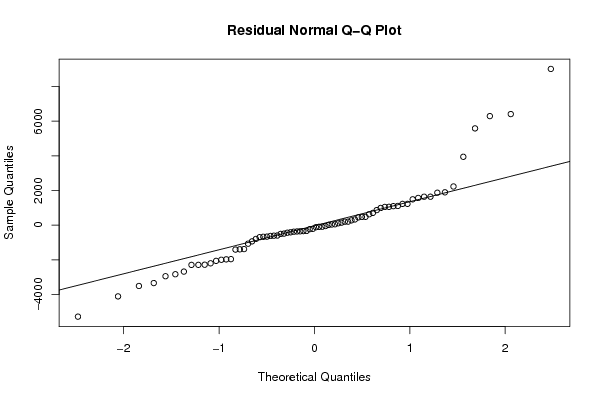
qqnorm(resid, main='Residual Normal Q-Q Plot')
qqline(resid)
dev.off()
ncols <- length(selection[[1]][1,])
nrows <- length(selection[[2]][,1])-1
load(file='createtable')
a<-table.start()
a<-table.row.start(a)
a<-table.element(a,'ARIMA Parameter Estimation and Backward Selection', ncols+1,TRUE)
a<-table.row.end(a)
a<-table.row.start(a)
a<-table.element(a,'Iteration', header=TRUE)
for (i in 1:ncols) {
a<-table.element(a,names(selection[[3]][[1]]$coef)[i],header=TRUE)
}
a<-table.row.end(a)
for (j in 1:nrows) {
a<-table.row.start(a)
mydum <- 'Estimates ('
mydum <- paste(mydum,j)
mydum <- paste(mydum,')')
a<-table.element(a,mydum, header=TRUE)
for (i in 1:ncols) {
a<-table.element(a,round(selection[[1]][j,i],4))
}
a<-table.row.end(a)
a<-table.row.start(a)
a<-table.element(a,'(p-val)', header=TRUE)
for (i in 1:ncols) {
mydum <- '('
mydum <- paste(mydum,round(selection[[2]][j,i],4),sep='')
mydum <- paste(mydum,')')
a<-table.element(a,mydum)
}
a<-table.row.end(a)
}
a<-table.end(a)
table.save(a,file='mytable.tab')
a<-table.start()
a<-table.row.start(a)
a<-table.element(a,'Estimated ARIMA Residuals', 1,TRUE)
a<-table.row.end(a)
a<-table.row.start(a)
a<-table.element(a,'Value', 1,TRUE)
a<-table.row.end(a)
for (i in (par4*par5+par3):length(resid)) {
a<-table.row.start(a)
a<-table.element(a,resid[i])
a<-table.row.end(a)
}
a<-table.end(a)
table.save(a,file='mytable1.tab')