Free Statistics

of Irreproducible Research!

Author's title

Author*Unverified author*
R Software Modulerwasp_autocorrelation.wasp
Title produced by software(Partial) Autocorrelation Function
Date of computationSat, 25 Dec 2010 12:59:27 +0000
Cite this page as followsStatistical Computations at FreeStatistics.org, Office for Research Development and Education, URL https://freestatistics.org/blog/index.php?v=date/2010/Dec/25/t12932819412xas95ez3lwbwib.htm/, Retrieved Mon, 29 Apr 2024 01:14:05 +0000
Statistical Computations at FreeStatistics.org, Office for Research Development and Education, URL https://freestatistics.org/blog/index.php?pk=115381, Retrieved Mon, 29 Apr 2024 01:14:05 +0000
QR Codes:

Original text written by user:
IsPrivate?No (this computation is public)
User-defined keywords
Estimated Impact133
Family? (F = Feedback message, R = changed R code, M = changed R Module, P = changed Parameters, D = changed Data)
-     [Variance Reduction Matrix] [] [2010-12-15 15:38:06] [234dae34fc2a42f724a2786a39cb083b]
- RMPD    [(Partial) Autocorrelation Function] [] [2010-12-25 12:59:27] [b922c1746992c1629690726c4c44723f] [Current]
Feedback Forum

Post a new message
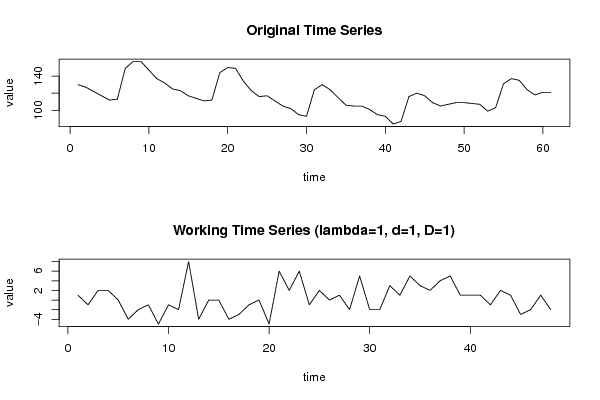
Dataseries X:
130
127
122
117
112
113
149
157
157
147
137
132
125
123
117
114
111
112
144
150
149
134
123
116
117
111
105
102
95
93
124
130
124
115
106
105
105
101
95
93
84
87
116
120
117
109
105
107
109
109
108
107
99
103
131
137
135
124
118
121
121


Summary of computational transaction
Raw Inputview raw input (R code)
Raw Outputview raw output of R engine
Computing time4 seconds
R Server'George Udny Yule' @ 72.249.76.132

\begin{tabular}{lllllllll}
\hline
Summary of computational transaction \tabularnewline
Raw Input & view raw input (R code)  \tabularnewline
Raw Output & view raw output of R engine  \tabularnewline
Computing time & 4 seconds \tabularnewline
R Server & 'George Udny Yule' @ 72.249.76.132 \tabularnewline
\hline
\end{tabular}
%Source: https://freestatistics.org/blog/index.php?pk=115381&T=0

[TABLE]
[ROW][C]Summary of computational transaction[/C][/ROW]
[ROW][C]Raw Input[/C][C]view raw input (R code) [/C][/ROW]
[ROW][C]Raw Output[/C][C]view raw output of R engine [/C][/ROW]
[ROW][C]Computing time[/C][C]4 seconds[/C][/ROW]
[ROW][C]R Server[/C][C]'George Udny Yule' @ 72.249.76.132[/C][/ROW]
[/TABLE]
Source: https://freestatistics.org/blog/index.php?pk=115381&T=0

Globally Unique Identifier (entire table): ba.freestatistics.org/blog/index.php?pk=115381&T=0

As an alternative you can also use a QR Code:  

The GUIDs for individual cells are displayed in the table below:

Summary of computational transaction
Raw Inputview raw input (R code)
Raw Outputview raw output of R engine
Computing time4 seconds
R Server'George Udny Yule' @ 72.249.76.132


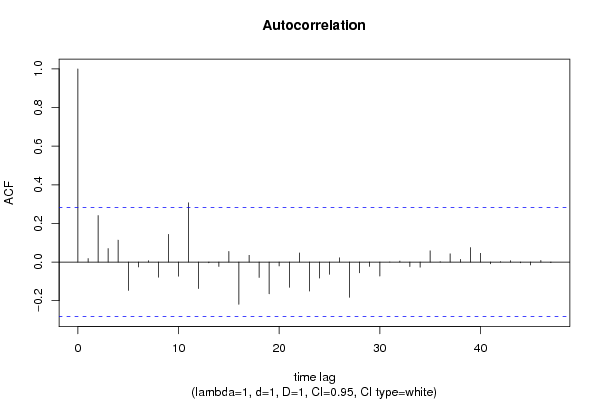
Autocorrelation Function
Time lag kACF(k)T-STATP-value
10.0178150.12340.451144
20.2408061.66830.050879
30.0694780.48140.316225
40.1134710.78620.217821
5-0.147281-1.02040.156329
6-0.02574-0.17830.429607
70.007070.0490.48057
8-0.078743-0.54550.293951
90.1432580.99250.162961
10-0.073203-0.50720.307181
110.3067142.1250.019382
12-0.137193-0.95050.17331
13-0.003774-0.02620.489623
14-0.022927-0.15880.437229
150.0546190.37840.353397
16-0.219-1.51730.067878
170.0348710.24160.405061
18-0.079595-0.55140.291942
19-0.164715-1.14120.129729
20-0.020113-0.13930.44488
21-0.131065-0.9080.184195
220.0469410.32520.373215
23-0.150219-1.04070.151603
24-0.083164-0.57620.283593
25-0.063618-0.44080.330684
260.0218960.15170.440029
27-0.182539-1.26470.106049
28-0.05595-0.38760.35
29-0.022992-0.15930.437052
30-0.072481-0.50220.308924
310.000710.00490.498047
320.0051630.03580.485806
33-0.023788-0.16480.434893
34-0.027006-0.18710.426184
350.058360.40430.343884
360.0017440.01210.495204
370.0424220.29390.385047
380.0137680.09540.462202
390.0752310.52120.302307
400.0454380.31480.377137
41-0.009494-0.06580.473913
420.0019360.01340.494676
430.0070820.04910.480536
44-0.004252-0.02950.488311
45-0.014893-0.10320.459125
460.0085630.05930.476468
47-0.003612-0.0250.490071
48NANANA
49NANANA
50NANANA
51NANANA
52NANANA
53NANANA
54NANANA
55NANANA
56NANANA
57NANANA
58NANANA
59NANANA
60NANANA

\begin{tabular}{lllllllll}
\hline
Autocorrelation Function \tabularnewline
Time lag k & ACF(k) & T-STAT & P-value \tabularnewline
1 & 0.017815 & 0.1234 & 0.451144 \tabularnewline
2 & 0.240806 & 1.6683 & 0.050879 \tabularnewline
3 & 0.069478 & 0.4814 & 0.316225 \tabularnewline
4 & 0.113471 & 0.7862 & 0.217821 \tabularnewline
5 & -0.147281 & -1.0204 & 0.156329 \tabularnewline
6 & -0.02574 & -0.1783 & 0.429607 \tabularnewline
7 & 0.00707 & 0.049 & 0.48057 \tabularnewline
8 & -0.078743 & -0.5455 & 0.293951 \tabularnewline
9 & 0.143258 & 0.9925 & 0.162961 \tabularnewline
10 & -0.073203 & -0.5072 & 0.307181 \tabularnewline
11 & 0.306714 & 2.125 & 0.019382 \tabularnewline
12 & -0.137193 & -0.9505 & 0.17331 \tabularnewline
13 & -0.003774 & -0.0262 & 0.489623 \tabularnewline
14 & -0.022927 & -0.1588 & 0.437229 \tabularnewline
15 & 0.054619 & 0.3784 & 0.353397 \tabularnewline
16 & -0.219 & -1.5173 & 0.067878 \tabularnewline
17 & 0.034871 & 0.2416 & 0.405061 \tabularnewline
18 & -0.079595 & -0.5514 & 0.291942 \tabularnewline
19 & -0.164715 & -1.1412 & 0.129729 \tabularnewline
20 & -0.020113 & -0.1393 & 0.44488 \tabularnewline
21 & -0.131065 & -0.908 & 0.184195 \tabularnewline
22 & 0.046941 & 0.3252 & 0.373215 \tabularnewline
23 & -0.150219 & -1.0407 & 0.151603 \tabularnewline
24 & -0.083164 & -0.5762 & 0.283593 \tabularnewline
25 & -0.063618 & -0.4408 & 0.330684 \tabularnewline
26 & 0.021896 & 0.1517 & 0.440029 \tabularnewline
27 & -0.182539 & -1.2647 & 0.106049 \tabularnewline
28 & -0.05595 & -0.3876 & 0.35 \tabularnewline
29 & -0.022992 & -0.1593 & 0.437052 \tabularnewline
30 & -0.072481 & -0.5022 & 0.308924 \tabularnewline
31 & 0.00071 & 0.0049 & 0.498047 \tabularnewline
32 & 0.005163 & 0.0358 & 0.485806 \tabularnewline
33 & -0.023788 & -0.1648 & 0.434893 \tabularnewline
34 & -0.027006 & -0.1871 & 0.426184 \tabularnewline
35 & 0.05836 & 0.4043 & 0.343884 \tabularnewline
36 & 0.001744 & 0.0121 & 0.495204 \tabularnewline
37 & 0.042422 & 0.2939 & 0.385047 \tabularnewline
38 & 0.013768 & 0.0954 & 0.462202 \tabularnewline
39 & 0.075231 & 0.5212 & 0.302307 \tabularnewline
40 & 0.045438 & 0.3148 & 0.377137 \tabularnewline
41 & -0.009494 & -0.0658 & 0.473913 \tabularnewline
42 & 0.001936 & 0.0134 & 0.494676 \tabularnewline
43 & 0.007082 & 0.0491 & 0.480536 \tabularnewline
44 & -0.004252 & -0.0295 & 0.488311 \tabularnewline
45 & -0.014893 & -0.1032 & 0.459125 \tabularnewline
46 & 0.008563 & 0.0593 & 0.476468 \tabularnewline
47 & -0.003612 & -0.025 & 0.490071 \tabularnewline
48 & NA & NA & NA \tabularnewline
49 & NA & NA & NA \tabularnewline
50 & NA & NA & NA \tabularnewline
51 & NA & NA & NA \tabularnewline
52 & NA & NA & NA \tabularnewline
53 & NA & NA & NA \tabularnewline
54 & NA & NA & NA \tabularnewline
55 & NA & NA & NA \tabularnewline
56 & NA & NA & NA \tabularnewline
57 & NA & NA & NA \tabularnewline
58 & NA & NA & NA \tabularnewline
59 & NA & NA & NA \tabularnewline
60 & NA & NA & NA \tabularnewline
\hline
\end{tabular}
%Source: https://freestatistics.org/blog/index.php?pk=115381&T=1

[TABLE]
[ROW][C]Autocorrelation Function[/C][/ROW]
[ROW][C]Time lag k[/C][C]ACF(k)[/C][C]T-STAT[/C][C]P-value[/C][/ROW]
[ROW][C]1[/C][C]0.017815[/C][C]0.1234[/C][C]0.451144[/C][/ROW]
[ROW][C]2[/C][C]0.240806[/C][C]1.6683[/C][C]0.050879[/C][/ROW]
[ROW][C]3[/C][C]0.069478[/C][C]0.4814[/C][C]0.316225[/C][/ROW]
[ROW][C]4[/C][C]0.113471[/C][C]0.7862[/C][C]0.217821[/C][/ROW]
[ROW][C]5[/C][C]-0.147281[/C][C]-1.0204[/C][C]0.156329[/C][/ROW]
[ROW][C]6[/C][C]-0.02574[/C][C]-0.1783[/C][C]0.429607[/C][/ROW]
[ROW][C]7[/C][C]0.00707[/C][C]0.049[/C][C]0.48057[/C][/ROW]
[ROW][C]8[/C][C]-0.078743[/C][C]-0.5455[/C][C]0.293951[/C][/ROW]
[ROW][C]9[/C][C]0.143258[/C][C]0.9925[/C][C]0.162961[/C][/ROW]
[ROW][C]10[/C][C]-0.073203[/C][C]-0.5072[/C][C]0.307181[/C][/ROW]
[ROW][C]11[/C][C]0.306714[/C][C]2.125[/C][C]0.019382[/C][/ROW]
[ROW][C]12[/C][C]-0.137193[/C][C]-0.9505[/C][C]0.17331[/C][/ROW]
[ROW][C]13[/C][C]-0.003774[/C][C]-0.0262[/C][C]0.489623[/C][/ROW]
[ROW][C]14[/C][C]-0.022927[/C][C]-0.1588[/C][C]0.437229[/C][/ROW]
[ROW][C]15[/C][C]0.054619[/C][C]0.3784[/C][C]0.353397[/C][/ROW]
[ROW][C]16[/C][C]-0.219[/C][C]-1.5173[/C][C]0.067878[/C][/ROW]
[ROW][C]17[/C][C]0.034871[/C][C]0.2416[/C][C]0.405061[/C][/ROW]
[ROW][C]18[/C][C]-0.079595[/C][C]-0.5514[/C][C]0.291942[/C][/ROW]
[ROW][C]19[/C][C]-0.164715[/C][C]-1.1412[/C][C]0.129729[/C][/ROW]
[ROW][C]20[/C][C]-0.020113[/C][C]-0.1393[/C][C]0.44488[/C][/ROW]
[ROW][C]21[/C][C]-0.131065[/C][C]-0.908[/C][C]0.184195[/C][/ROW]
[ROW][C]22[/C][C]0.046941[/C][C]0.3252[/C][C]0.373215[/C][/ROW]
[ROW][C]23[/C][C]-0.150219[/C][C]-1.0407[/C][C]0.151603[/C][/ROW]
[ROW][C]24[/C][C]-0.083164[/C][C]-0.5762[/C][C]0.283593[/C][/ROW]
[ROW][C]25[/C][C]-0.063618[/C][C]-0.4408[/C][C]0.330684[/C][/ROW]
[ROW][C]26[/C][C]0.021896[/C][C]0.1517[/C][C]0.440029[/C][/ROW]
[ROW][C]27[/C][C]-0.182539[/C][C]-1.2647[/C][C]0.106049[/C][/ROW]
[ROW][C]28[/C][C]-0.05595[/C][C]-0.3876[/C][C]0.35[/C][/ROW]
[ROW][C]29[/C][C]-0.022992[/C][C]-0.1593[/C][C]0.437052[/C][/ROW]
[ROW][C]30[/C][C]-0.072481[/C][C]-0.5022[/C][C]0.308924[/C][/ROW]
[ROW][C]31[/C][C]0.00071[/C][C]0.0049[/C][C]0.498047[/C][/ROW]
[ROW][C]32[/C][C]0.005163[/C][C]0.0358[/C][C]0.485806[/C][/ROW]
[ROW][C]33[/C][C]-0.023788[/C][C]-0.1648[/C][C]0.434893[/C][/ROW]
[ROW][C]34[/C][C]-0.027006[/C][C]-0.1871[/C][C]0.426184[/C][/ROW]
[ROW][C]35[/C][C]0.05836[/C][C]0.4043[/C][C]0.343884[/C][/ROW]
[ROW][C]36[/C][C]0.001744[/C][C]0.0121[/C][C]0.495204[/C][/ROW]
[ROW][C]37[/C][C]0.042422[/C][C]0.2939[/C][C]0.385047[/C][/ROW]
[ROW][C]38[/C][C]0.013768[/C][C]0.0954[/C][C]0.462202[/C][/ROW]
[ROW][C]39[/C][C]0.075231[/C][C]0.5212[/C][C]0.302307[/C][/ROW]
[ROW][C]40[/C][C]0.045438[/C][C]0.3148[/C][C]0.377137[/C][/ROW]
[ROW][C]41[/C][C]-0.009494[/C][C]-0.0658[/C][C]0.473913[/C][/ROW]
[ROW][C]42[/C][C]0.001936[/C][C]0.0134[/C][C]0.494676[/C][/ROW]
[ROW][C]43[/C][C]0.007082[/C][C]0.0491[/C][C]0.480536[/C][/ROW]
[ROW][C]44[/C][C]-0.004252[/C][C]-0.0295[/C][C]0.488311[/C][/ROW]
[ROW][C]45[/C][C]-0.014893[/C][C]-0.1032[/C][C]0.459125[/C][/ROW]
[ROW][C]46[/C][C]0.008563[/C][C]0.0593[/C][C]0.476468[/C][/ROW]
[ROW][C]47[/C][C]-0.003612[/C][C]-0.025[/C][C]0.490071[/C][/ROW]
[ROW][C]48[/C][C]NA[/C][C]NA[/C][C]NA[/C][/ROW]
[ROW][C]49[/C][C]NA[/C][C]NA[/C][C]NA[/C][/ROW]
[ROW][C]50[/C][C]NA[/C][C]NA[/C][C]NA[/C][/ROW]
[ROW][C]51[/C][C]NA[/C][C]NA[/C][C]NA[/C][/ROW]
[ROW][C]52[/C][C]NA[/C][C]NA[/C][C]NA[/C][/ROW]
[ROW][C]53[/C][C]NA[/C][C]NA[/C][C]NA[/C][/ROW]
[ROW][C]54[/C][C]NA[/C][C]NA[/C][C]NA[/C][/ROW]
[ROW][C]55[/C][C]NA[/C][C]NA[/C][C]NA[/C][/ROW]
[ROW][C]56[/C][C]NA[/C][C]NA[/C][C]NA[/C][/ROW]
[ROW][C]57[/C][C]NA[/C][C]NA[/C][C]NA[/C][/ROW]
[ROW][C]58[/C][C]NA[/C][C]NA[/C][C]NA[/C][/ROW]
[ROW][C]59[/C][C]NA[/C][C]NA[/C][C]NA[/C][/ROW]
[ROW][C]60[/C][C]NA[/C][C]NA[/C][C]NA[/C][/ROW]
[/TABLE]
Source: https://freestatistics.org/blog/index.php?pk=115381&T=1

Globally Unique Identifier (entire table): ba.freestatistics.org/blog/index.php?pk=115381&T=1

As an alternative you can also use a QR Code:  

The GUIDs for individual cells are displayed in the table below:

Autocorrelation Function
Time lag kACF(k)T-STATP-value
10.0178150.12340.451144
20.2408061.66830.050879
30.0694780.48140.316225
40.1134710.78620.217821
5-0.147281-1.02040.156329
6-0.02574-0.17830.429607
70.007070.0490.48057
8-0.078743-0.54550.293951
90.1432580.99250.162961
10-0.073203-0.50720.307181
110.3067142.1250.019382
12-0.137193-0.95050.17331
13-0.003774-0.02620.489623
14-0.022927-0.15880.437229
150.0546190.37840.353397
16-0.219-1.51730.067878
170.0348710.24160.405061
18-0.079595-0.55140.291942
19-0.164715-1.14120.129729
20-0.020113-0.13930.44488
21-0.131065-0.9080.184195
220.0469410.32520.373215
23-0.150219-1.04070.151603
24-0.083164-0.57620.283593
25-0.063618-0.44080.330684
260.0218960.15170.440029
27-0.182539-1.26470.106049
28-0.05595-0.38760.35
29-0.022992-0.15930.437052
30-0.072481-0.50220.308924
310.000710.00490.498047
320.0051630.03580.485806
33-0.023788-0.16480.434893
34-0.027006-0.18710.426184
350.058360.40430.343884
360.0017440.01210.495204
370.0424220.29390.385047
380.0137680.09540.462202
390.0752310.52120.302307
400.0454380.31480.377137
41-0.009494-0.06580.473913
420.0019360.01340.494676
430.0070820.04910.480536
44-0.004252-0.02950.488311
45-0.014893-0.10320.459125
460.0085630.05930.476468
47-0.003612-0.0250.490071
48NANANA
49NANANA
50NANANA
51NANANA
52NANANA
53NANANA
54NANANA
55NANANA
56NANANA
57NANANA
58NANANA
59NANANA
60NANANA


Partial Autocorrelation Function
Time lag kPACF(k)T-STATP-value
10.0178150.12340.451144
20.2405651.66670.051046
30.065760.45560.325367
40.0583780.40450.343839
5-0.191719-1.32830.095186
6-0.077737-0.53860.296333
70.0798160.5530.291422
8-0.035339-0.24480.403813
90.1844681.2780.103693
10-0.084717-0.58690.279999
110.2565811.77760.040899
12-0.163248-1.1310.131835
13-0.183025-1.2680.105452
140.0651430.45130.326894
150.0598440.41460.340138
16-0.110165-0.76320.224527
170.0415550.28790.387331
18-0.127072-0.88040.19152
19-0.117642-0.8150.209536
20-0.042294-0.2930.385384
21-0.072314-0.5010.309327
220.0837430.58020.28225
23-0.048564-0.33650.368995
24-0.170306-1.17990.121924
257.2e-055e-040.499803
26-0.042673-0.29560.384387
27-0.014557-0.10090.460043
28-0.098166-0.68010.24985
29-0.014405-0.09980.460459
300.0950950.65880.256575
31-0.044933-0.31130.378458
32-0.021729-0.15050.440483
33-0.071042-0.49220.312413
34-0.01299-0.090.464331
350.1291310.89460.18772
36-0.020309-0.14070.444347
37-0.045478-0.31510.377033
380.0937610.64960.259526
390.0140560.09740.461414
40-0.041667-0.28870.387037
41-0.069073-0.47860.317215
42-0.046654-0.32320.373964
430.0090920.0630.475019
44-0.010143-0.07030.472135
45-0.019128-0.13250.447563
46-0.078516-0.5440.294487
47-0.074305-0.51480.304528
48NANANA
49NANANA
50NANANA
51NANANA
52NANANA
53NANANA
54NANANA
55NANANA
56NANANA
57NANANA
58NANANA
59NANANA
60NANANA

\begin{tabular}{lllllllll}
\hline
Partial Autocorrelation Function \tabularnewline
Time lag k & PACF(k) & T-STAT & P-value \tabularnewline
1 & 0.017815 & 0.1234 & 0.451144 \tabularnewline
2 & 0.240565 & 1.6667 & 0.051046 \tabularnewline
3 & 0.06576 & 0.4556 & 0.325367 \tabularnewline
4 & 0.058378 & 0.4045 & 0.343839 \tabularnewline
5 & -0.191719 & -1.3283 & 0.095186 \tabularnewline
6 & -0.077737 & -0.5386 & 0.296333 \tabularnewline
7 & 0.079816 & 0.553 & 0.291422 \tabularnewline
8 & -0.035339 & -0.2448 & 0.403813 \tabularnewline
9 & 0.184468 & 1.278 & 0.103693 \tabularnewline
10 & -0.084717 & -0.5869 & 0.279999 \tabularnewline
11 & 0.256581 & 1.7776 & 0.040899 \tabularnewline
12 & -0.163248 & -1.131 & 0.131835 \tabularnewline
13 & -0.183025 & -1.268 & 0.105452 \tabularnewline
14 & 0.065143 & 0.4513 & 0.326894 \tabularnewline
15 & 0.059844 & 0.4146 & 0.340138 \tabularnewline
16 & -0.110165 & -0.7632 & 0.224527 \tabularnewline
17 & 0.041555 & 0.2879 & 0.387331 \tabularnewline
18 & -0.127072 & -0.8804 & 0.19152 \tabularnewline
19 & -0.117642 & -0.815 & 0.209536 \tabularnewline
20 & -0.042294 & -0.293 & 0.385384 \tabularnewline
21 & -0.072314 & -0.501 & 0.309327 \tabularnewline
22 & 0.083743 & 0.5802 & 0.28225 \tabularnewline
23 & -0.048564 & -0.3365 & 0.368995 \tabularnewline
24 & -0.170306 & -1.1799 & 0.121924 \tabularnewline
25 & 7.2e-05 & 5e-04 & 0.499803 \tabularnewline
26 & -0.042673 & -0.2956 & 0.384387 \tabularnewline
27 & -0.014557 & -0.1009 & 0.460043 \tabularnewline
28 & -0.098166 & -0.6801 & 0.24985 \tabularnewline
29 & -0.014405 & -0.0998 & 0.460459 \tabularnewline
30 & 0.095095 & 0.6588 & 0.256575 \tabularnewline
31 & -0.044933 & -0.3113 & 0.378458 \tabularnewline
32 & -0.021729 & -0.1505 & 0.440483 \tabularnewline
33 & -0.071042 & -0.4922 & 0.312413 \tabularnewline
34 & -0.01299 & -0.09 & 0.464331 \tabularnewline
35 & 0.129131 & 0.8946 & 0.18772 \tabularnewline
36 & -0.020309 & -0.1407 & 0.444347 \tabularnewline
37 & -0.045478 & -0.3151 & 0.377033 \tabularnewline
38 & 0.093761 & 0.6496 & 0.259526 \tabularnewline
39 & 0.014056 & 0.0974 & 0.461414 \tabularnewline
40 & -0.041667 & -0.2887 & 0.387037 \tabularnewline
41 & -0.069073 & -0.4786 & 0.317215 \tabularnewline
42 & -0.046654 & -0.3232 & 0.373964 \tabularnewline
43 & 0.009092 & 0.063 & 0.475019 \tabularnewline
44 & -0.010143 & -0.0703 & 0.472135 \tabularnewline
45 & -0.019128 & -0.1325 & 0.447563 \tabularnewline
46 & -0.078516 & -0.544 & 0.294487 \tabularnewline
47 & -0.074305 & -0.5148 & 0.304528 \tabularnewline
48 & NA & NA & NA \tabularnewline
49 & NA & NA & NA \tabularnewline
50 & NA & NA & NA \tabularnewline
51 & NA & NA & NA \tabularnewline
52 & NA & NA & NA \tabularnewline
53 & NA & NA & NA \tabularnewline
54 & NA & NA & NA \tabularnewline
55 & NA & NA & NA \tabularnewline
56 & NA & NA & NA \tabularnewline
57 & NA & NA & NA \tabularnewline
58 & NA & NA & NA \tabularnewline
59 & NA & NA & NA \tabularnewline
60 & NA & NA & NA \tabularnewline
\hline
\end{tabular}
%Source: https://freestatistics.org/blog/index.php?pk=115381&T=2

[TABLE]
[ROW][C]Partial Autocorrelation Function[/C][/ROW]
[ROW][C]Time lag k[/C][C]PACF(k)[/C][C]T-STAT[/C][C]P-value[/C][/ROW]
[ROW][C]1[/C][C]0.017815[/C][C]0.1234[/C][C]0.451144[/C][/ROW]
[ROW][C]2[/C][C]0.240565[/C][C]1.6667[/C][C]0.051046[/C][/ROW]
[ROW][C]3[/C][C]0.06576[/C][C]0.4556[/C][C]0.325367[/C][/ROW]
[ROW][C]4[/C][C]0.058378[/C][C]0.4045[/C][C]0.343839[/C][/ROW]
[ROW][C]5[/C][C]-0.191719[/C][C]-1.3283[/C][C]0.095186[/C][/ROW]
[ROW][C]6[/C][C]-0.077737[/C][C]-0.5386[/C][C]0.296333[/C][/ROW]
[ROW][C]7[/C][C]0.079816[/C][C]0.553[/C][C]0.291422[/C][/ROW]
[ROW][C]8[/C][C]-0.035339[/C][C]-0.2448[/C][C]0.403813[/C][/ROW]
[ROW][C]9[/C][C]0.184468[/C][C]1.278[/C][C]0.103693[/C][/ROW]
[ROW][C]10[/C][C]-0.084717[/C][C]-0.5869[/C][C]0.279999[/C][/ROW]
[ROW][C]11[/C][C]0.256581[/C][C]1.7776[/C][C]0.040899[/C][/ROW]
[ROW][C]12[/C][C]-0.163248[/C][C]-1.131[/C][C]0.131835[/C][/ROW]
[ROW][C]13[/C][C]-0.183025[/C][C]-1.268[/C][C]0.105452[/C][/ROW]
[ROW][C]14[/C][C]0.065143[/C][C]0.4513[/C][C]0.326894[/C][/ROW]
[ROW][C]15[/C][C]0.059844[/C][C]0.4146[/C][C]0.340138[/C][/ROW]
[ROW][C]16[/C][C]-0.110165[/C][C]-0.7632[/C][C]0.224527[/C][/ROW]
[ROW][C]17[/C][C]0.041555[/C][C]0.2879[/C][C]0.387331[/C][/ROW]
[ROW][C]18[/C][C]-0.127072[/C][C]-0.8804[/C][C]0.19152[/C][/ROW]
[ROW][C]19[/C][C]-0.117642[/C][C]-0.815[/C][C]0.209536[/C][/ROW]
[ROW][C]20[/C][C]-0.042294[/C][C]-0.293[/C][C]0.385384[/C][/ROW]
[ROW][C]21[/C][C]-0.072314[/C][C]-0.501[/C][C]0.309327[/C][/ROW]
[ROW][C]22[/C][C]0.083743[/C][C]0.5802[/C][C]0.28225[/C][/ROW]
[ROW][C]23[/C][C]-0.048564[/C][C]-0.3365[/C][C]0.368995[/C][/ROW]
[ROW][C]24[/C][C]-0.170306[/C][C]-1.1799[/C][C]0.121924[/C][/ROW]
[ROW][C]25[/C][C]7.2e-05[/C][C]5e-04[/C][C]0.499803[/C][/ROW]
[ROW][C]26[/C][C]-0.042673[/C][C]-0.2956[/C][C]0.384387[/C][/ROW]
[ROW][C]27[/C][C]-0.014557[/C][C]-0.1009[/C][C]0.460043[/C][/ROW]
[ROW][C]28[/C][C]-0.098166[/C][C]-0.6801[/C][C]0.24985[/C][/ROW]
[ROW][C]29[/C][C]-0.014405[/C][C]-0.0998[/C][C]0.460459[/C][/ROW]
[ROW][C]30[/C][C]0.095095[/C][C]0.6588[/C][C]0.256575[/C][/ROW]
[ROW][C]31[/C][C]-0.044933[/C][C]-0.3113[/C][C]0.378458[/C][/ROW]
[ROW][C]32[/C][C]-0.021729[/C][C]-0.1505[/C][C]0.440483[/C][/ROW]
[ROW][C]33[/C][C]-0.071042[/C][C]-0.4922[/C][C]0.312413[/C][/ROW]
[ROW][C]34[/C][C]-0.01299[/C][C]-0.09[/C][C]0.464331[/C][/ROW]
[ROW][C]35[/C][C]0.129131[/C][C]0.8946[/C][C]0.18772[/C][/ROW]
[ROW][C]36[/C][C]-0.020309[/C][C]-0.1407[/C][C]0.444347[/C][/ROW]
[ROW][C]37[/C][C]-0.045478[/C][C]-0.3151[/C][C]0.377033[/C][/ROW]
[ROW][C]38[/C][C]0.093761[/C][C]0.6496[/C][C]0.259526[/C][/ROW]
[ROW][C]39[/C][C]0.014056[/C][C]0.0974[/C][C]0.461414[/C][/ROW]
[ROW][C]40[/C][C]-0.041667[/C][C]-0.2887[/C][C]0.387037[/C][/ROW]
[ROW][C]41[/C][C]-0.069073[/C][C]-0.4786[/C][C]0.317215[/C][/ROW]
[ROW][C]42[/C][C]-0.046654[/C][C]-0.3232[/C][C]0.373964[/C][/ROW]
[ROW][C]43[/C][C]0.009092[/C][C]0.063[/C][C]0.475019[/C][/ROW]
[ROW][C]44[/C][C]-0.010143[/C][C]-0.0703[/C][C]0.472135[/C][/ROW]
[ROW][C]45[/C][C]-0.019128[/C][C]-0.1325[/C][C]0.447563[/C][/ROW]
[ROW][C]46[/C][C]-0.078516[/C][C]-0.544[/C][C]0.294487[/C][/ROW]
[ROW][C]47[/C][C]-0.074305[/C][C]-0.5148[/C][C]0.304528[/C][/ROW]
[ROW][C]48[/C][C]NA[/C][C]NA[/C][C]NA[/C][/ROW]
[ROW][C]49[/C][C]NA[/C][C]NA[/C][C]NA[/C][/ROW]
[ROW][C]50[/C][C]NA[/C][C]NA[/C][C]NA[/C][/ROW]
[ROW][C]51[/C][C]NA[/C][C]NA[/C][C]NA[/C][/ROW]
[ROW][C]52[/C][C]NA[/C][C]NA[/C][C]NA[/C][/ROW]
[ROW][C]53[/C][C]NA[/C][C]NA[/C][C]NA[/C][/ROW]
[ROW][C]54[/C][C]NA[/C][C]NA[/C][C]NA[/C][/ROW]
[ROW][C]55[/C][C]NA[/C][C]NA[/C][C]NA[/C][/ROW]
[ROW][C]56[/C][C]NA[/C][C]NA[/C][C]NA[/C][/ROW]
[ROW][C]57[/C][C]NA[/C][C]NA[/C][C]NA[/C][/ROW]
[ROW][C]58[/C][C]NA[/C][C]NA[/C][C]NA[/C][/ROW]
[ROW][C]59[/C][C]NA[/C][C]NA[/C][C]NA[/C][/ROW]
[ROW][C]60[/C][C]NA[/C][C]NA[/C][C]NA[/C][/ROW]
[/TABLE]
Source: https://freestatistics.org/blog/index.php?pk=115381&T=2

Globally Unique Identifier (entire table): ba.freestatistics.org/blog/index.php?pk=115381&T=2

As an alternative you can also use a QR Code:  

The GUIDs for individual cells are displayed in the table below:

Partial Autocorrelation Function
Time lag kPACF(k)T-STATP-value
10.0178150.12340.451144
20.2405651.66670.051046
30.065760.45560.325367
40.0583780.40450.343839
5-0.191719-1.32830.095186
6-0.077737-0.53860.296333
70.0798160.5530.291422
8-0.035339-0.24480.403813
90.1844681.2780.103693
10-0.084717-0.58690.279999
110.2565811.77760.040899
12-0.163248-1.1310.131835
13-0.183025-1.2680.105452
140.0651430.45130.326894
150.0598440.41460.340138
16-0.110165-0.76320.224527
170.0415550.28790.387331
18-0.127072-0.88040.19152
19-0.117642-0.8150.209536
20-0.042294-0.2930.385384
21-0.072314-0.5010.309327
220.0837430.58020.28225
23-0.048564-0.33650.368995
24-0.170306-1.17990.121924
257.2e-055e-040.499803
26-0.042673-0.29560.384387
27-0.014557-0.10090.460043
28-0.098166-0.68010.24985
29-0.014405-0.09980.460459
300.0950950.65880.256575
31-0.044933-0.31130.378458
32-0.021729-0.15050.440483
33-0.071042-0.49220.312413
34-0.01299-0.090.464331
350.1291310.89460.18772
36-0.020309-0.14070.444347
37-0.045478-0.31510.377033
380.0937610.64960.259526
390.0140560.09740.461414
40-0.041667-0.28870.387037
41-0.069073-0.47860.317215
42-0.046654-0.32320.373964
430.0090920.0630.475019
44-0.010143-0.07030.472135
45-0.019128-0.13250.447563
46-0.078516-0.5440.294487
47-0.074305-0.51480.304528
48NANANA
49NANANA
50NANANA
51NANANA
52NANANA
53NANANA
54NANANA
55NANANA
56NANANA
57NANANA
58NANANA
59NANANA
60NANANA


Parameters (Session):
par1 = 60 ; par2 = 1 ; par3 = 1 ; par4 = 1 ; par5 = 12 ; par6 = White Noise ; par7 = 0.95 ;
Parameters (R input):
par1 = 60 ; par2 = 1 ; par3 = 1 ; par4 = 1 ; par5 = 12 ; par6 = White Noise ; par7 = 0.95 ; par8 = ;
R code (references can be found in the software module):
if (par1 == 'Default') {
par1 = 10*log10(length(x))
} else {
par1 <- as.numeric(par1)
}
par2 <- as.numeric(par2)
par3 <- as.numeric(par3)
par4 <- as.numeric(par4)
par5 <- as.numeric(par5)
if (par6 == 'White Noise') par6 <- 'white' else par6 <- 'ma'
par7 <- as.numeric(par7)
if (par8 != '') par8 <- as.numeric(par8)
ox <- x
if (par8 == '') {
if (par2 == 0) {
x <- log(x)
} else {
x <- (x ^ par2 - 1) / par2
}
} else {
x <- log(x,base=par8)
}
if (par3 > 0) x <- diff(x,lag=1,difference=par3)
if (par4 > 0) x <- diff(x,lag=par5,difference=par4)
bitmap(file='picts.png')
op <- par(mfrow=c(2,1))
plot(ox,type='l',main='Original Time Series',xlab='time',ylab='value')
if (par8=='') {
mytitle <- paste('Working Time Series (lambda=',par2,', d=',par3,', D=',par4,')',sep='')
mysub <- paste('(lambda=',par2,', d=',par3,', D=',par4,', CI=', par7, ', CI type=',par6,')',sep='')
} else {
mytitle <- paste('Working Time Series (base=',par8,', d=',par3,', D=',par4,')',sep='')
mysub <- paste('(base=',par8,', d=',par3,', D=',par4,', CI=', par7, ', CI type=',par6,')',sep='')
}
plot(x,type='l', main=mytitle,xlab='time',ylab='value')
par(op)
dev.off()
bitmap(file='pic1.png')
racf <- acf(x, par1, main='Autocorrelation', xlab='time lag', ylab='ACF', ci.type=par6, ci=par7, sub=mysub)
dev.off()
bitmap(file='pic2.png')
rpacf <- pacf(x,par1,main='Partial Autocorrelation',xlab='lags',ylab='PACF',sub=mysub)
dev.off()
(myacf <- c(racf$acf))
(mypacf <- c(rpacf$acf))
lengthx <- length(x)
sqrtn <- sqrt(lengthx)
load(file='createtable')
a<-table.start()
a<-table.row.start(a)
a<-table.element(a,'Autocorrelation Function',4,TRUE)
a<-table.row.end(a)
a<-table.row.start(a)
a<-table.element(a,'Time lag k',header=TRUE)
a<-table.element(a,hyperlink('basics.htm','ACF(k)','click here for more information about the Autocorrelation Function'),header=TRUE)
a<-table.element(a,'T-STAT',header=TRUE)
a<-table.element(a,'P-value',header=TRUE)
a<-table.row.end(a)
for (i in 2:(par1+1)) {
a<-table.row.start(a)
a<-table.element(a,i-1,header=TRUE)
a<-table.element(a,round(myacf[i],6))
mytstat <- myacf[i]*sqrtn
a<-table.element(a,round(mytstat,4))
a<-table.element(a,round(1-pt(abs(mytstat),lengthx),6))
a<-table.row.end(a)
}
a<-table.end(a)
table.save(a,file='mytable.tab')
a<-table.start()
a<-table.row.start(a)
a<-table.element(a,'Partial Autocorrelation Function',4,TRUE)
a<-table.row.end(a)
a<-table.row.start(a)
a<-table.element(a,'Time lag k',header=TRUE)
a<-table.element(a,hyperlink('basics.htm','PACF(k)','click here for more information about the Partial Autocorrelation Function'),header=TRUE)
a<-table.element(a,'T-STAT',header=TRUE)
a<-table.element(a,'P-value',header=TRUE)
a<-table.row.end(a)
for (i in 1:par1) {
a<-table.row.start(a)
a<-table.element(a,i,header=TRUE)
a<-table.element(a,round(mypacf[i],6))
mytstat <- mypacf[i]*sqrtn
a<-table.element(a,round(mytstat,4))
a<-table.element(a,round(1-pt(abs(mytstat),lengthx),6))
a<-table.row.end(a)
}
a<-table.end(a)
table.save(a,file='mytable1.tab')