Free Statistics

of Irreproducible Research!

Author's title

Author*The author of this computation has been verified*
R Software Modulerwasp_autocorrelation.wasp
Title produced by software(Partial) Autocorrelation Function
Date of computationSat, 25 Dec 2010 12:49:36 +0000
Cite this page as followsStatistical Computations at FreeStatistics.org, Office for Research Development and Education, URL https://freestatistics.org/blog/index.php?v=date/2010/Dec/25/t1293281399756uh1o8hllhs7g.htm/, Retrieved Mon, 29 Apr 2024 06:08:01 +0000
Statistical Computations at FreeStatistics.org, Office for Research Development and Education, URL https://freestatistics.org/blog/index.php?pk=115378, Retrieved Mon, 29 Apr 2024 06:08:01 +0000
QR Codes:

Original text written by user:
IsPrivate?No (this computation is public)
User-defined keywords
Estimated Impact156
Family? (F = Feedback message, R = changed R code, M = changed R Module, P = changed Parameters, D = changed Data)
-     [Variance Reduction Matrix] [] [2010-12-15 15:38:06] [234dae34fc2a42f724a2786a39cb083b]
F RMPD    [(Partial) Autocorrelation Function] [] [2010-12-25 12:49:36] [cf84dc108eae081aed36d3d050e63ee7] [Current]
Feedback Forum
2011-01-08 10:15:52 [] [reply
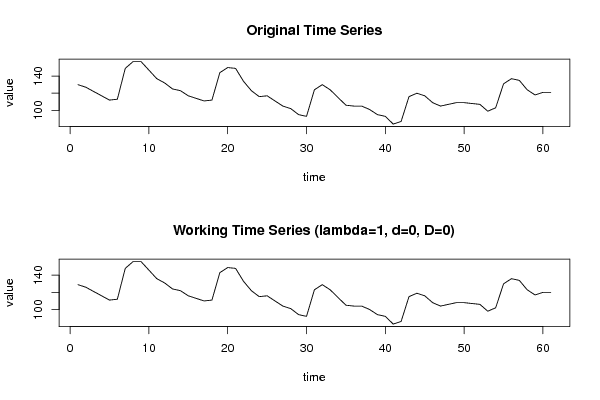
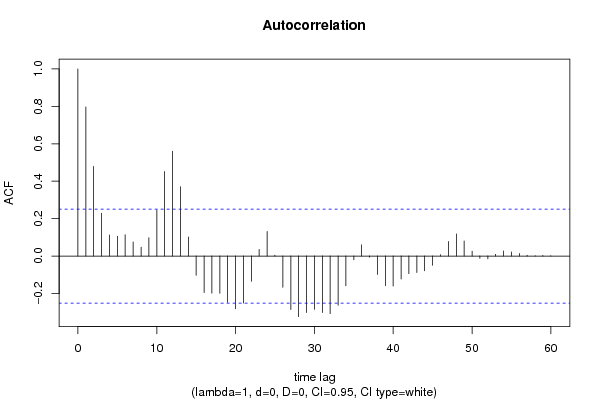
De student zegt in haar bespreking van deze grafiek dat er duidelijk een lange termijn trend is naast de seizoeinaliteit. Over de lange termijn trend heb ik toch een bedenking als ik deze autocorrelatie functie bekijk. Zo moet er inderdaad naar de eerste 10 lags gekeken worden maar deze moeten volgens de theorie
1) langzaam dalend zijn
2) liefst significant (boven het betrouwbaarheidsinterval uitkomen)

Beide voorwaarden zijn in dit geval niet echt voldaan waardoor er aan de hand van deze grafiek niet met 100% zekerheid mag geconcludeerd worden dat er een lange termijn trend aanwezig is.

Post a new message
Dataseries X:
130
127
122
117
112
113
149
157
157
147
137
132
125
123
117
114
111
112
144
150
149
134
123
116
117
111
105
102
95
93
124
130
124
115
106
105
105
101
95
93
84
87
116
120
117
109
105
107
109
109
108
107
99
103
131
137
135
124
118
121
121


Summary of computational transaction
Raw Inputview raw input (R code)
Raw Outputview raw output of R engine
Computing time2 seconds
R Server'RServer@AstonUniversity' @ vre.aston.ac.uk

\begin{tabular}{lllllllll}
\hline
Summary of computational transaction \tabularnewline
Raw Input & view raw input (R code)  \tabularnewline
Raw Output & view raw output of R engine  \tabularnewline
Computing time & 2 seconds \tabularnewline
R Server & 'RServer@AstonUniversity' @ vre.aston.ac.uk \tabularnewline
\hline
\end{tabular}
%Source: https://freestatistics.org/blog/index.php?pk=115378&T=0

[TABLE]
[ROW][C]Summary of computational transaction[/C][/ROW]
[ROW][C]Raw Input[/C][C]view raw input (R code) [/C][/ROW]
[ROW][C]Raw Output[/C][C]view raw output of R engine [/C][/ROW]
[ROW][C]Computing time[/C][C]2 seconds[/C][/ROW]
[ROW][C]R Server[/C][C]'RServer@AstonUniversity' @ vre.aston.ac.uk[/C][/ROW]
[/TABLE]
Source: https://freestatistics.org/blog/index.php?pk=115378&T=0

Globally Unique Identifier (entire table): ba.freestatistics.org/blog/index.php?pk=115378&T=0

As an alternative you can also use a QR Code:  

The GUIDs for individual cells are displayed in the table below:

Summary of computational transaction
Raw Inputview raw input (R code)
Raw Outputview raw output of R engine
Computing time2 seconds
R Server'RServer@AstonUniversity' @ vre.aston.ac.uk


Autocorrelation Function
Time lag kACF(k)T-STATP-value
10.7967866.22310
20.4783973.73640.000207
30.2287071.78630.039514
40.1127670.88070.190958
50.1060040.82790.205471
60.1135490.88680.189323
70.0752880.5880.279345
80.0468470.36590.357857
90.0978190.7640.22391
100.2459241.92070.029722
110.4520373.53050.000398
120.5603794.37672.4e-05
130.3709632.89730.00261
140.1024260.80.213416
15-0.102724-0.80230.212746
16-0.194546-1.51940.066908
17-0.198327-1.5490.063279
18-0.19889-1.55340.062753
19-0.247575-1.93360.028902
20-0.281506-2.19860.015854
21-0.251075-1.9610.027227
22-0.134696-1.0520.148472
230.0347920.27170.393373
240.1312031.02470.154769
250.004610.0360.485697
26-0.16718-1.30570.098275
27-0.286362-2.23660.014491
28-0.32393-2.530.007003
29-0.301576-2.35540.010868
30-0.284974-2.22570.014869
31-0.302176-2.36010.010743
32-0.308061-2.4060.009586
33-0.262924-2.05350.022159
34-0.158545-1.23830.110179
35-0.020039-0.15650.438074
360.0598970.46780.320792
37-0.005962-0.04660.481506
38-0.099128-0.77420.220897
39-0.158644-1.23910.110037
40-0.160367-1.25250.107582
41-0.12309-0.96140.170082
42-0.094045-0.73450.232725
43-0.088135-0.68840.246919
44-0.079018-0.61720.269715
45-0.049512-0.38670.350163
460.0068110.05320.478874
470.0782360.6110.27172
480.1175560.91810.18108
490.0804740.62850.266004
500.0253270.19780.421927
51-0.012202-0.09530.462196
52-0.014601-0.1140.454791
530.0090430.07060.471962
540.0267570.2090.417579
550.021490.16780.433631
560.0136290.10640.457788
570.0045060.03520.48602
580.0020650.01610.493593
590.0035110.02740.489105
600.002010.01570.493764

\begin{tabular}{lllllllll}
\hline
Autocorrelation Function \tabularnewline
Time lag k & ACF(k) & T-STAT & P-value \tabularnewline
1 & 0.796786 & 6.2231 & 0 \tabularnewline
2 & 0.478397 & 3.7364 & 0.000207 \tabularnewline
3 & 0.228707 & 1.7863 & 0.039514 \tabularnewline
4 & 0.112767 & 0.8807 & 0.190958 \tabularnewline
5 & 0.106004 & 0.8279 & 0.205471 \tabularnewline
6 & 0.113549 & 0.8868 & 0.189323 \tabularnewline
7 & 0.075288 & 0.588 & 0.279345 \tabularnewline
8 & 0.046847 & 0.3659 & 0.357857 \tabularnewline
9 & 0.097819 & 0.764 & 0.22391 \tabularnewline
10 & 0.245924 & 1.9207 & 0.029722 \tabularnewline
11 & 0.452037 & 3.5305 & 0.000398 \tabularnewline
12 & 0.560379 & 4.3767 & 2.4e-05 \tabularnewline
13 & 0.370963 & 2.8973 & 0.00261 \tabularnewline
14 & 0.102426 & 0.8 & 0.213416 \tabularnewline
15 & -0.102724 & -0.8023 & 0.212746 \tabularnewline
16 & -0.194546 & -1.5194 & 0.066908 \tabularnewline
17 & -0.198327 & -1.549 & 0.063279 \tabularnewline
18 & -0.19889 & -1.5534 & 0.062753 \tabularnewline
19 & -0.247575 & -1.9336 & 0.028902 \tabularnewline
20 & -0.281506 & -2.1986 & 0.015854 \tabularnewline
21 & -0.251075 & -1.961 & 0.027227 \tabularnewline
22 & -0.134696 & -1.052 & 0.148472 \tabularnewline
23 & 0.034792 & 0.2717 & 0.393373 \tabularnewline
24 & 0.131203 & 1.0247 & 0.154769 \tabularnewline
25 & 0.00461 & 0.036 & 0.485697 \tabularnewline
26 & -0.16718 & -1.3057 & 0.098275 \tabularnewline
27 & -0.286362 & -2.2366 & 0.014491 \tabularnewline
28 & -0.32393 & -2.53 & 0.007003 \tabularnewline
29 & -0.301576 & -2.3554 & 0.010868 \tabularnewline
30 & -0.284974 & -2.2257 & 0.014869 \tabularnewline
31 & -0.302176 & -2.3601 & 0.010743 \tabularnewline
32 & -0.308061 & -2.406 & 0.009586 \tabularnewline
33 & -0.262924 & -2.0535 & 0.022159 \tabularnewline
34 & -0.158545 & -1.2383 & 0.110179 \tabularnewline
35 & -0.020039 & -0.1565 & 0.438074 \tabularnewline
36 & 0.059897 & 0.4678 & 0.320792 \tabularnewline
37 & -0.005962 & -0.0466 & 0.481506 \tabularnewline
38 & -0.099128 & -0.7742 & 0.220897 \tabularnewline
39 & -0.158644 & -1.2391 & 0.110037 \tabularnewline
40 & -0.160367 & -1.2525 & 0.107582 \tabularnewline
41 & -0.12309 & -0.9614 & 0.170082 \tabularnewline
42 & -0.094045 & -0.7345 & 0.232725 \tabularnewline
43 & -0.088135 & -0.6884 & 0.246919 \tabularnewline
44 & -0.079018 & -0.6172 & 0.269715 \tabularnewline
45 & -0.049512 & -0.3867 & 0.350163 \tabularnewline
46 & 0.006811 & 0.0532 & 0.478874 \tabularnewline
47 & 0.078236 & 0.611 & 0.27172 \tabularnewline
48 & 0.117556 & 0.9181 & 0.18108 \tabularnewline
49 & 0.080474 & 0.6285 & 0.266004 \tabularnewline
50 & 0.025327 & 0.1978 & 0.421927 \tabularnewline
51 & -0.012202 & -0.0953 & 0.462196 \tabularnewline
52 & -0.014601 & -0.114 & 0.454791 \tabularnewline
53 & 0.009043 & 0.0706 & 0.471962 \tabularnewline
54 & 0.026757 & 0.209 & 0.417579 \tabularnewline
55 & 0.02149 & 0.1678 & 0.433631 \tabularnewline
56 & 0.013629 & 0.1064 & 0.457788 \tabularnewline
57 & 0.004506 & 0.0352 & 0.48602 \tabularnewline
58 & 0.002065 & 0.0161 & 0.493593 \tabularnewline
59 & 0.003511 & 0.0274 & 0.489105 \tabularnewline
60 & 0.00201 & 0.0157 & 0.493764 \tabularnewline
\hline
\end{tabular}
%Source: https://freestatistics.org/blog/index.php?pk=115378&T=1

[TABLE]
[ROW][C]Autocorrelation Function[/C][/ROW]
[ROW][C]Time lag k[/C][C]ACF(k)[/C][C]T-STAT[/C][C]P-value[/C][/ROW]
[ROW][C]1[/C][C]0.796786[/C][C]6.2231[/C][C]0[/C][/ROW]
[ROW][C]2[/C][C]0.478397[/C][C]3.7364[/C][C]0.000207[/C][/ROW]
[ROW][C]3[/C][C]0.228707[/C][C]1.7863[/C][C]0.039514[/C][/ROW]
[ROW][C]4[/C][C]0.112767[/C][C]0.8807[/C][C]0.190958[/C][/ROW]
[ROW][C]5[/C][C]0.106004[/C][C]0.8279[/C][C]0.205471[/C][/ROW]
[ROW][C]6[/C][C]0.113549[/C][C]0.8868[/C][C]0.189323[/C][/ROW]
[ROW][C]7[/C][C]0.075288[/C][C]0.588[/C][C]0.279345[/C][/ROW]
[ROW][C]8[/C][C]0.046847[/C][C]0.3659[/C][C]0.357857[/C][/ROW]
[ROW][C]9[/C][C]0.097819[/C][C]0.764[/C][C]0.22391[/C][/ROW]
[ROW][C]10[/C][C]0.245924[/C][C]1.9207[/C][C]0.029722[/C][/ROW]
[ROW][C]11[/C][C]0.452037[/C][C]3.5305[/C][C]0.000398[/C][/ROW]
[ROW][C]12[/C][C]0.560379[/C][C]4.3767[/C][C]2.4e-05[/C][/ROW]
[ROW][C]13[/C][C]0.370963[/C][C]2.8973[/C][C]0.00261[/C][/ROW]
[ROW][C]14[/C][C]0.102426[/C][C]0.8[/C][C]0.213416[/C][/ROW]
[ROW][C]15[/C][C]-0.102724[/C][C]-0.8023[/C][C]0.212746[/C][/ROW]
[ROW][C]16[/C][C]-0.194546[/C][C]-1.5194[/C][C]0.066908[/C][/ROW]
[ROW][C]17[/C][C]-0.198327[/C][C]-1.549[/C][C]0.063279[/C][/ROW]
[ROW][C]18[/C][C]-0.19889[/C][C]-1.5534[/C][C]0.062753[/C][/ROW]
[ROW][C]19[/C][C]-0.247575[/C][C]-1.9336[/C][C]0.028902[/C][/ROW]
[ROW][C]20[/C][C]-0.281506[/C][C]-2.1986[/C][C]0.015854[/C][/ROW]
[ROW][C]21[/C][C]-0.251075[/C][C]-1.961[/C][C]0.027227[/C][/ROW]
[ROW][C]22[/C][C]-0.134696[/C][C]-1.052[/C][C]0.148472[/C][/ROW]
[ROW][C]23[/C][C]0.034792[/C][C]0.2717[/C][C]0.393373[/C][/ROW]
[ROW][C]24[/C][C]0.131203[/C][C]1.0247[/C][C]0.154769[/C][/ROW]
[ROW][C]25[/C][C]0.00461[/C][C]0.036[/C][C]0.485697[/C][/ROW]
[ROW][C]26[/C][C]-0.16718[/C][C]-1.3057[/C][C]0.098275[/C][/ROW]
[ROW][C]27[/C][C]-0.286362[/C][C]-2.2366[/C][C]0.014491[/C][/ROW]
[ROW][C]28[/C][C]-0.32393[/C][C]-2.53[/C][C]0.007003[/C][/ROW]
[ROW][C]29[/C][C]-0.301576[/C][C]-2.3554[/C][C]0.010868[/C][/ROW]
[ROW][C]30[/C][C]-0.284974[/C][C]-2.2257[/C][C]0.014869[/C][/ROW]
[ROW][C]31[/C][C]-0.302176[/C][C]-2.3601[/C][C]0.010743[/C][/ROW]
[ROW][C]32[/C][C]-0.308061[/C][C]-2.406[/C][C]0.009586[/C][/ROW]
[ROW][C]33[/C][C]-0.262924[/C][C]-2.0535[/C][C]0.022159[/C][/ROW]
[ROW][C]34[/C][C]-0.158545[/C][C]-1.2383[/C][C]0.110179[/C][/ROW]
[ROW][C]35[/C][C]-0.020039[/C][C]-0.1565[/C][C]0.438074[/C][/ROW]
[ROW][C]36[/C][C]0.059897[/C][C]0.4678[/C][C]0.320792[/C][/ROW]
[ROW][C]37[/C][C]-0.005962[/C][C]-0.0466[/C][C]0.481506[/C][/ROW]
[ROW][C]38[/C][C]-0.099128[/C][C]-0.7742[/C][C]0.220897[/C][/ROW]
[ROW][C]39[/C][C]-0.158644[/C][C]-1.2391[/C][C]0.110037[/C][/ROW]
[ROW][C]40[/C][C]-0.160367[/C][C]-1.2525[/C][C]0.107582[/C][/ROW]
[ROW][C]41[/C][C]-0.12309[/C][C]-0.9614[/C][C]0.170082[/C][/ROW]
[ROW][C]42[/C][C]-0.094045[/C][C]-0.7345[/C][C]0.232725[/C][/ROW]
[ROW][C]43[/C][C]-0.088135[/C][C]-0.6884[/C][C]0.246919[/C][/ROW]
[ROW][C]44[/C][C]-0.079018[/C][C]-0.6172[/C][C]0.269715[/C][/ROW]
[ROW][C]45[/C][C]-0.049512[/C][C]-0.3867[/C][C]0.350163[/C][/ROW]
[ROW][C]46[/C][C]0.006811[/C][C]0.0532[/C][C]0.478874[/C][/ROW]
[ROW][C]47[/C][C]0.078236[/C][C]0.611[/C][C]0.27172[/C][/ROW]
[ROW][C]48[/C][C]0.117556[/C][C]0.9181[/C][C]0.18108[/C][/ROW]
[ROW][C]49[/C][C]0.080474[/C][C]0.6285[/C][C]0.266004[/C][/ROW]
[ROW][C]50[/C][C]0.025327[/C][C]0.1978[/C][C]0.421927[/C][/ROW]
[ROW][C]51[/C][C]-0.012202[/C][C]-0.0953[/C][C]0.462196[/C][/ROW]
[ROW][C]52[/C][C]-0.014601[/C][C]-0.114[/C][C]0.454791[/C][/ROW]
[ROW][C]53[/C][C]0.009043[/C][C]0.0706[/C][C]0.471962[/C][/ROW]
[ROW][C]54[/C][C]0.026757[/C][C]0.209[/C][C]0.417579[/C][/ROW]
[ROW][C]55[/C][C]0.02149[/C][C]0.1678[/C][C]0.433631[/C][/ROW]
[ROW][C]56[/C][C]0.013629[/C][C]0.1064[/C][C]0.457788[/C][/ROW]
[ROW][C]57[/C][C]0.004506[/C][C]0.0352[/C][C]0.48602[/C][/ROW]
[ROW][C]58[/C][C]0.002065[/C][C]0.0161[/C][C]0.493593[/C][/ROW]
[ROW][C]59[/C][C]0.003511[/C][C]0.0274[/C][C]0.489105[/C][/ROW]
[ROW][C]60[/C][C]0.00201[/C][C]0.0157[/C][C]0.493764[/C][/ROW]
[/TABLE]
Source: https://freestatistics.org/blog/index.php?pk=115378&T=1

Globally Unique Identifier (entire table): ba.freestatistics.org/blog/index.php?pk=115378&T=1

As an alternative you can also use a QR Code:  

The GUIDs for individual cells are displayed in the table below:

Autocorrelation Function
Time lag kACF(k)T-STATP-value
10.7967866.22310
20.4783973.73640.000207
30.2287071.78630.039514
40.1127670.88070.190958
50.1060040.82790.205471
60.1135490.88680.189323
70.0752880.5880.279345
80.0468470.36590.357857
90.0978190.7640.22391
100.2459241.92070.029722
110.4520373.53050.000398
120.5603794.37672.4e-05
130.3709632.89730.00261
140.1024260.80.213416
15-0.102724-0.80230.212746
16-0.194546-1.51940.066908
17-0.198327-1.5490.063279
18-0.19889-1.55340.062753
19-0.247575-1.93360.028902
20-0.281506-2.19860.015854
21-0.251075-1.9610.027227
22-0.134696-1.0520.148472
230.0347920.27170.393373
240.1312031.02470.154769
250.004610.0360.485697
26-0.16718-1.30570.098275
27-0.286362-2.23660.014491
28-0.32393-2.530.007003
29-0.301576-2.35540.010868
30-0.284974-2.22570.014869
31-0.302176-2.36010.010743
32-0.308061-2.4060.009586
33-0.262924-2.05350.022159
34-0.158545-1.23830.110179
35-0.020039-0.15650.438074
360.0598970.46780.320792
37-0.005962-0.04660.481506
38-0.099128-0.77420.220897
39-0.158644-1.23910.110037
40-0.160367-1.25250.107582
41-0.12309-0.96140.170082
42-0.094045-0.73450.232725
43-0.088135-0.68840.246919
44-0.079018-0.61720.269715
45-0.049512-0.38670.350163
460.0068110.05320.478874
470.0782360.6110.27172
480.1175560.91810.18108
490.0804740.62850.266004
500.0253270.19780.421927
51-0.012202-0.09530.462196
52-0.014601-0.1140.454791
530.0090430.07060.471962
540.0267570.2090.417579
550.021490.16780.433631
560.0136290.10640.457788
570.0045060.03520.48602
580.0020650.01610.493593
590.0035110.02740.489105
600.002010.01570.493764


Partial Autocorrelation Function
Time lag kPACF(k)T-STATP-value
10.7967866.22310
2-0.42853-3.34690.000702
30.0859720.67150.252231
40.0924040.72170.236618
50.0710580.5550.290469
6-0.066897-0.52250.301614
7-0.071257-0.55650.28994
80.1258160.98270.164829
90.1913951.49480.070055
100.2280741.78130.039919
110.2731642.13350.018458
12-0.029211-0.22810.410148
13-0.601835-4.70058e-06
140.1859921.45260.075723
15-0.072258-0.56430.287293
16-0.146578-1.14480.128379
17-0.107361-0.83850.202507
18-0.054739-0.42750.335251
19-0.109933-0.85860.196961
20-0.036817-0.28760.387332
21-0.070317-0.54920.292438
220.0055680.04350.482726
23-0.044616-0.34850.364347
240.035770.27940.390453
25-0.045961-0.3590.360429
260.0991740.77460.220792
27-0.021314-0.16650.434171
28-0.032861-0.25670.399155
29-0.005146-0.04020.484035
300.0376690.29420.384801
310.0514330.40170.344654
32-0.064093-0.50060.309234
330.034660.27070.393765
34-0.060669-0.47380.318653
35-0.054534-0.42590.33583
36-0.008421-0.06580.473887
370.1101190.86010.196563
38-0.115631-0.90310.18501
39-0.022944-0.17920.429189
400.0515120.40230.344427
410.0190520.14880.441099
42-0.013951-0.1090.456794
430.0551660.43090.334045
44-0.024036-0.18770.425856
45-0.070332-0.54930.292399
46-0.045703-0.3570.36118
47-0.022154-0.1730.431601
480.0144270.11270.455328
490.0141490.11050.456185
50-0.105581-0.82460.206401
51-0.005323-0.04160.483486
520.0153590.120.452454
53-0.009895-0.07730.469327
54-0.033584-0.26230.396988
55-0.088674-0.69260.245605
560.0422450.32990.371287
57-0.107604-0.84040.201979
58-0.037412-0.29220.385563
59-0.052623-0.4110.341257
60-0.003317-0.02590.489708

\begin{tabular}{lllllllll}
\hline
Partial Autocorrelation Function \tabularnewline
Time lag k & PACF(k) & T-STAT & P-value \tabularnewline
1 & 0.796786 & 6.2231 & 0 \tabularnewline
2 & -0.42853 & -3.3469 & 0.000702 \tabularnewline
3 & 0.085972 & 0.6715 & 0.252231 \tabularnewline
4 & 0.092404 & 0.7217 & 0.236618 \tabularnewline
5 & 0.071058 & 0.555 & 0.290469 \tabularnewline
6 & -0.066897 & -0.5225 & 0.301614 \tabularnewline
7 & -0.071257 & -0.5565 & 0.28994 \tabularnewline
8 & 0.125816 & 0.9827 & 0.164829 \tabularnewline
9 & 0.191395 & 1.4948 & 0.070055 \tabularnewline
10 & 0.228074 & 1.7813 & 0.039919 \tabularnewline
11 & 0.273164 & 2.1335 & 0.018458 \tabularnewline
12 & -0.029211 & -0.2281 & 0.410148 \tabularnewline
13 & -0.601835 & -4.7005 & 8e-06 \tabularnewline
14 & 0.185992 & 1.4526 & 0.075723 \tabularnewline
15 & -0.072258 & -0.5643 & 0.287293 \tabularnewline
16 & -0.146578 & -1.1448 & 0.128379 \tabularnewline
17 & -0.107361 & -0.8385 & 0.202507 \tabularnewline
18 & -0.054739 & -0.4275 & 0.335251 \tabularnewline
19 & -0.109933 & -0.8586 & 0.196961 \tabularnewline
20 & -0.036817 & -0.2876 & 0.387332 \tabularnewline
21 & -0.070317 & -0.5492 & 0.292438 \tabularnewline
22 & 0.005568 & 0.0435 & 0.482726 \tabularnewline
23 & -0.044616 & -0.3485 & 0.364347 \tabularnewline
24 & 0.03577 & 0.2794 & 0.390453 \tabularnewline
25 & -0.045961 & -0.359 & 0.360429 \tabularnewline
26 & 0.099174 & 0.7746 & 0.220792 \tabularnewline
27 & -0.021314 & -0.1665 & 0.434171 \tabularnewline
28 & -0.032861 & -0.2567 & 0.399155 \tabularnewline
29 & -0.005146 & -0.0402 & 0.484035 \tabularnewline
30 & 0.037669 & 0.2942 & 0.384801 \tabularnewline
31 & 0.051433 & 0.4017 & 0.344654 \tabularnewline
32 & -0.064093 & -0.5006 & 0.309234 \tabularnewline
33 & 0.03466 & 0.2707 & 0.393765 \tabularnewline
34 & -0.060669 & -0.4738 & 0.318653 \tabularnewline
35 & -0.054534 & -0.4259 & 0.33583 \tabularnewline
36 & -0.008421 & -0.0658 & 0.473887 \tabularnewline
37 & 0.110119 & 0.8601 & 0.196563 \tabularnewline
38 & -0.115631 & -0.9031 & 0.18501 \tabularnewline
39 & -0.022944 & -0.1792 & 0.429189 \tabularnewline
40 & 0.051512 & 0.4023 & 0.344427 \tabularnewline
41 & 0.019052 & 0.1488 & 0.441099 \tabularnewline
42 & -0.013951 & -0.109 & 0.456794 \tabularnewline
43 & 0.055166 & 0.4309 & 0.334045 \tabularnewline
44 & -0.024036 & -0.1877 & 0.425856 \tabularnewline
45 & -0.070332 & -0.5493 & 0.292399 \tabularnewline
46 & -0.045703 & -0.357 & 0.36118 \tabularnewline
47 & -0.022154 & -0.173 & 0.431601 \tabularnewline
48 & 0.014427 & 0.1127 & 0.455328 \tabularnewline
49 & 0.014149 & 0.1105 & 0.456185 \tabularnewline
50 & -0.105581 & -0.8246 & 0.206401 \tabularnewline
51 & -0.005323 & -0.0416 & 0.483486 \tabularnewline
52 & 0.015359 & 0.12 & 0.452454 \tabularnewline
53 & -0.009895 & -0.0773 & 0.469327 \tabularnewline
54 & -0.033584 & -0.2623 & 0.396988 \tabularnewline
55 & -0.088674 & -0.6926 & 0.245605 \tabularnewline
56 & 0.042245 & 0.3299 & 0.371287 \tabularnewline
57 & -0.107604 & -0.8404 & 0.201979 \tabularnewline
58 & -0.037412 & -0.2922 & 0.385563 \tabularnewline
59 & -0.052623 & -0.411 & 0.341257 \tabularnewline
60 & -0.003317 & -0.0259 & 0.489708 \tabularnewline
\hline
\end{tabular}
%Source: https://freestatistics.org/blog/index.php?pk=115378&T=2

[TABLE]
[ROW][C]Partial Autocorrelation Function[/C][/ROW]
[ROW][C]Time lag k[/C][C]PACF(k)[/C][C]T-STAT[/C][C]P-value[/C][/ROW]
[ROW][C]1[/C][C]0.796786[/C][C]6.2231[/C][C]0[/C][/ROW]
[ROW][C]2[/C][C]-0.42853[/C][C]-3.3469[/C][C]0.000702[/C][/ROW]
[ROW][C]3[/C][C]0.085972[/C][C]0.6715[/C][C]0.252231[/C][/ROW]
[ROW][C]4[/C][C]0.092404[/C][C]0.7217[/C][C]0.236618[/C][/ROW]
[ROW][C]5[/C][C]0.071058[/C][C]0.555[/C][C]0.290469[/C][/ROW]
[ROW][C]6[/C][C]-0.066897[/C][C]-0.5225[/C][C]0.301614[/C][/ROW]
[ROW][C]7[/C][C]-0.071257[/C][C]-0.5565[/C][C]0.28994[/C][/ROW]
[ROW][C]8[/C][C]0.125816[/C][C]0.9827[/C][C]0.164829[/C][/ROW]
[ROW][C]9[/C][C]0.191395[/C][C]1.4948[/C][C]0.070055[/C][/ROW]
[ROW][C]10[/C][C]0.228074[/C][C]1.7813[/C][C]0.039919[/C][/ROW]
[ROW][C]11[/C][C]0.273164[/C][C]2.1335[/C][C]0.018458[/C][/ROW]
[ROW][C]12[/C][C]-0.029211[/C][C]-0.2281[/C][C]0.410148[/C][/ROW]
[ROW][C]13[/C][C]-0.601835[/C][C]-4.7005[/C][C]8e-06[/C][/ROW]
[ROW][C]14[/C][C]0.185992[/C][C]1.4526[/C][C]0.075723[/C][/ROW]
[ROW][C]15[/C][C]-0.072258[/C][C]-0.5643[/C][C]0.287293[/C][/ROW]
[ROW][C]16[/C][C]-0.146578[/C][C]-1.1448[/C][C]0.128379[/C][/ROW]
[ROW][C]17[/C][C]-0.107361[/C][C]-0.8385[/C][C]0.202507[/C][/ROW]
[ROW][C]18[/C][C]-0.054739[/C][C]-0.4275[/C][C]0.335251[/C][/ROW]
[ROW][C]19[/C][C]-0.109933[/C][C]-0.8586[/C][C]0.196961[/C][/ROW]
[ROW][C]20[/C][C]-0.036817[/C][C]-0.2876[/C][C]0.387332[/C][/ROW]
[ROW][C]21[/C][C]-0.070317[/C][C]-0.5492[/C][C]0.292438[/C][/ROW]
[ROW][C]22[/C][C]0.005568[/C][C]0.0435[/C][C]0.482726[/C][/ROW]
[ROW][C]23[/C][C]-0.044616[/C][C]-0.3485[/C][C]0.364347[/C][/ROW]
[ROW][C]24[/C][C]0.03577[/C][C]0.2794[/C][C]0.390453[/C][/ROW]
[ROW][C]25[/C][C]-0.045961[/C][C]-0.359[/C][C]0.360429[/C][/ROW]
[ROW][C]26[/C][C]0.099174[/C][C]0.7746[/C][C]0.220792[/C][/ROW]
[ROW][C]27[/C][C]-0.021314[/C][C]-0.1665[/C][C]0.434171[/C][/ROW]
[ROW][C]28[/C][C]-0.032861[/C][C]-0.2567[/C][C]0.399155[/C][/ROW]
[ROW][C]29[/C][C]-0.005146[/C][C]-0.0402[/C][C]0.484035[/C][/ROW]
[ROW][C]30[/C][C]0.037669[/C][C]0.2942[/C][C]0.384801[/C][/ROW]
[ROW][C]31[/C][C]0.051433[/C][C]0.4017[/C][C]0.344654[/C][/ROW]
[ROW][C]32[/C][C]-0.064093[/C][C]-0.5006[/C][C]0.309234[/C][/ROW]
[ROW][C]33[/C][C]0.03466[/C][C]0.2707[/C][C]0.393765[/C][/ROW]
[ROW][C]34[/C][C]-0.060669[/C][C]-0.4738[/C][C]0.318653[/C][/ROW]
[ROW][C]35[/C][C]-0.054534[/C][C]-0.4259[/C][C]0.33583[/C][/ROW]
[ROW][C]36[/C][C]-0.008421[/C][C]-0.0658[/C][C]0.473887[/C][/ROW]
[ROW][C]37[/C][C]0.110119[/C][C]0.8601[/C][C]0.196563[/C][/ROW]
[ROW][C]38[/C][C]-0.115631[/C][C]-0.9031[/C][C]0.18501[/C][/ROW]
[ROW][C]39[/C][C]-0.022944[/C][C]-0.1792[/C][C]0.429189[/C][/ROW]
[ROW][C]40[/C][C]0.051512[/C][C]0.4023[/C][C]0.344427[/C][/ROW]
[ROW][C]41[/C][C]0.019052[/C][C]0.1488[/C][C]0.441099[/C][/ROW]
[ROW][C]42[/C][C]-0.013951[/C][C]-0.109[/C][C]0.456794[/C][/ROW]
[ROW][C]43[/C][C]0.055166[/C][C]0.4309[/C][C]0.334045[/C][/ROW]
[ROW][C]44[/C][C]-0.024036[/C][C]-0.1877[/C][C]0.425856[/C][/ROW]
[ROW][C]45[/C][C]-0.070332[/C][C]-0.5493[/C][C]0.292399[/C][/ROW]
[ROW][C]46[/C][C]-0.045703[/C][C]-0.357[/C][C]0.36118[/C][/ROW]
[ROW][C]47[/C][C]-0.022154[/C][C]-0.173[/C][C]0.431601[/C][/ROW]
[ROW][C]48[/C][C]0.014427[/C][C]0.1127[/C][C]0.455328[/C][/ROW]
[ROW][C]49[/C][C]0.014149[/C][C]0.1105[/C][C]0.456185[/C][/ROW]
[ROW][C]50[/C][C]-0.105581[/C][C]-0.8246[/C][C]0.206401[/C][/ROW]
[ROW][C]51[/C][C]-0.005323[/C][C]-0.0416[/C][C]0.483486[/C][/ROW]
[ROW][C]52[/C][C]0.015359[/C][C]0.12[/C][C]0.452454[/C][/ROW]
[ROW][C]53[/C][C]-0.009895[/C][C]-0.0773[/C][C]0.469327[/C][/ROW]
[ROW][C]54[/C][C]-0.033584[/C][C]-0.2623[/C][C]0.396988[/C][/ROW]
[ROW][C]55[/C][C]-0.088674[/C][C]-0.6926[/C][C]0.245605[/C][/ROW]
[ROW][C]56[/C][C]0.042245[/C][C]0.3299[/C][C]0.371287[/C][/ROW]
[ROW][C]57[/C][C]-0.107604[/C][C]-0.8404[/C][C]0.201979[/C][/ROW]
[ROW][C]58[/C][C]-0.037412[/C][C]-0.2922[/C][C]0.385563[/C][/ROW]
[ROW][C]59[/C][C]-0.052623[/C][C]-0.411[/C][C]0.341257[/C][/ROW]
[ROW][C]60[/C][C]-0.003317[/C][C]-0.0259[/C][C]0.489708[/C][/ROW]
[/TABLE]
Source: https://freestatistics.org/blog/index.php?pk=115378&T=2

Globally Unique Identifier (entire table): ba.freestatistics.org/blog/index.php?pk=115378&T=2

As an alternative you can also use a QR Code:  

The GUIDs for individual cells are displayed in the table below:

Partial Autocorrelation Function
Time lag kPACF(k)T-STATP-value
10.7967866.22310
2-0.42853-3.34690.000702
30.0859720.67150.252231
40.0924040.72170.236618
50.0710580.5550.290469
6-0.066897-0.52250.301614
7-0.071257-0.55650.28994
80.1258160.98270.164829
90.1913951.49480.070055
100.2280741.78130.039919
110.2731642.13350.018458
12-0.029211-0.22810.410148
13-0.601835-4.70058e-06
140.1859921.45260.075723
15-0.072258-0.56430.287293
16-0.146578-1.14480.128379
17-0.107361-0.83850.202507
18-0.054739-0.42750.335251
19-0.109933-0.85860.196961
20-0.036817-0.28760.387332
21-0.070317-0.54920.292438
220.0055680.04350.482726
23-0.044616-0.34850.364347
240.035770.27940.390453
25-0.045961-0.3590.360429
260.0991740.77460.220792
27-0.021314-0.16650.434171
28-0.032861-0.25670.399155
29-0.005146-0.04020.484035
300.0376690.29420.384801
310.0514330.40170.344654
32-0.064093-0.50060.309234
330.034660.27070.393765
34-0.060669-0.47380.318653
35-0.054534-0.42590.33583
36-0.008421-0.06580.473887
370.1101190.86010.196563
38-0.115631-0.90310.18501
39-0.022944-0.17920.429189
400.0515120.40230.344427
410.0190520.14880.441099
42-0.013951-0.1090.456794
430.0551660.43090.334045
44-0.024036-0.18770.425856
45-0.070332-0.54930.292399
46-0.045703-0.3570.36118
47-0.022154-0.1730.431601
480.0144270.11270.455328
490.0141490.11050.456185
50-0.105581-0.82460.206401
51-0.005323-0.04160.483486
520.0153590.120.452454
53-0.009895-0.07730.469327
54-0.033584-0.26230.396988
55-0.088674-0.69260.245605
560.0422450.32990.371287
57-0.107604-0.84040.201979
58-0.037412-0.29220.385563
59-0.052623-0.4110.341257
60-0.003317-0.02590.489708


Parameters (Session):
par1 = 60 ; par2 = 1 ; par3 = 0 ; par4 = 0 ; par5 = 12 ; par6 = White Noise ; par7 = 0.95 ;
Parameters (R input):
par1 = 60 ; par2 = 1 ; par3 = 0 ; par4 = 0 ; par5 = 12 ; par6 = White Noise ; par7 = 0.95 ; par8 = ;
R code (references can be found in the software module):
if (par1 == 'Default') {
par1 = 10*log10(length(x))
} else {
par1 <- as.numeric(par1)
}
par2 <- as.numeric(par2)
par3 <- as.numeric(par3)
par4 <- as.numeric(par4)
par5 <- as.numeric(par5)
if (par6 == 'White Noise') par6 <- 'white' else par6 <- 'ma'
par7 <- as.numeric(par7)
if (par8 != '') par8 <- as.numeric(par8)
ox <- x
if (par8 == '') {
if (par2 == 0) {
x <- log(x)
} else {
x <- (x ^ par2 - 1) / par2
}
} else {
x <- log(x,base=par8)
}
if (par3 > 0) x <- diff(x,lag=1,difference=par3)
if (par4 > 0) x <- diff(x,lag=par5,difference=par4)
bitmap(file='picts.png')
op <- par(mfrow=c(2,1))
plot(ox,type='l',main='Original Time Series',xlab='time',ylab='value')
if (par8=='') {
mytitle <- paste('Working Time Series (lambda=',par2,', d=',par3,', D=',par4,')',sep='')
mysub <- paste('(lambda=',par2,', d=',par3,', D=',par4,', CI=', par7, ', CI type=',par6,')',sep='')
} else {
mytitle <- paste('Working Time Series (base=',par8,', d=',par3,', D=',par4,')',sep='')
mysub <- paste('(base=',par8,', d=',par3,', D=',par4,', CI=', par7, ', CI type=',par6,')',sep='')
}
plot(x,type='l', main=mytitle,xlab='time',ylab='value')
par(op)
dev.off()
bitmap(file='pic1.png')
racf <- acf(x, par1, main='Autocorrelation', xlab='time lag', ylab='ACF', ci.type=par6, ci=par7, sub=mysub)
dev.off()
bitmap(file='pic2.png')
rpacf <- pacf(x,par1,main='Partial Autocorrelation',xlab='lags',ylab='PACF',sub=mysub)
dev.off()
(myacf <- c(racf$acf))
(mypacf <- c(rpacf$acf))
lengthx <- length(x)
sqrtn <- sqrt(lengthx)
load(file='createtable')
a<-table.start()
a<-table.row.start(a)
a<-table.element(a,'Autocorrelation Function',4,TRUE)
a<-table.row.end(a)
a<-table.row.start(a)
a<-table.element(a,'Time lag k',header=TRUE)
a<-table.element(a,hyperlink('basics.htm','ACF(k)','click here for more information about the Autocorrelation Function'),header=TRUE)
a<-table.element(a,'T-STAT',header=TRUE)
a<-table.element(a,'P-value',header=TRUE)
a<-table.row.end(a)
for (i in 2:(par1+1)) {
a<-table.row.start(a)
a<-table.element(a,i-1,header=TRUE)
a<-table.element(a,round(myacf[i],6))
mytstat <- myacf[i]*sqrtn
a<-table.element(a,round(mytstat,4))
a<-table.element(a,round(1-pt(abs(mytstat),lengthx),6))
a<-table.row.end(a)
}
a<-table.end(a)
table.save(a,file='mytable.tab')
a<-table.start()
a<-table.row.start(a)
a<-table.element(a,'Partial Autocorrelation Function',4,TRUE)
a<-table.row.end(a)
a<-table.row.start(a)
a<-table.element(a,'Time lag k',header=TRUE)
a<-table.element(a,hyperlink('basics.htm','PACF(k)','click here for more information about the Partial Autocorrelation Function'),header=TRUE)
a<-table.element(a,'T-STAT',header=TRUE)
a<-table.element(a,'P-value',header=TRUE)
a<-table.row.end(a)
for (i in 1:par1) {
a<-table.row.start(a)
a<-table.element(a,i,header=TRUE)
a<-table.element(a,round(mypacf[i],6))
mytstat <- mypacf[i]*sqrtn
a<-table.element(a,round(mytstat,4))
a<-table.element(a,round(1-pt(abs(mytstat),lengthx),6))
a<-table.row.end(a)
}
a<-table.end(a)
table.save(a,file='mytable1.tab')