Free Statistics

of Irreproducible Research!

Author's title

Author*The author of this computation has been verified*
R Software Modulerwasp_arimabackwardselection.wasp
Title produced by softwareARIMA Backward Selection
Date of computationSat, 25 Dec 2010 11:07:36 +0000
Cite this page as followsStatistical Computations at FreeStatistics.org, Office for Research Development and Education, URL https://freestatistics.org/blog/index.php?v=date/2010/Dec/25/t12932751780yj5yvl4nppb2ni.htm/, Retrieved Mon, 29 Apr 2024 01:47:04 +0000
Statistical Computations at FreeStatistics.org, Office for Research Development and Education, URL https://freestatistics.org/blog/index.php?pk=115350, Retrieved Mon, 29 Apr 2024 01:47:04 +0000
QR Codes:

Original text written by user:
IsPrivate?No (this computation is public)
User-defined keywords
Estimated Impact155
Family? (F = Feedback message, R = changed R code, M = changed R Module, P = changed Parameters, D = changed Data)
-       [ARIMA Backward Selection] [ARIMA Backward Se...] [2010-12-25 11:07:36] [55fca7c82a53ae69fe96aa1750b06058] [Current]
Feedback Forum

Post a new message
Dataseries X:
716
677
710
839
886
891
917
820
793
932
906
844
801
957
1159
1264
1097
1240
1411
1535
1862
1894
2239
2465
2423
2692
2856
3450
4162
4260
4225
4092
4160
3896
3628
3754
3749
3907
4449
5272
6197
6446
7157
7559
7674
6929
7156
6805
7095
7222
7593
7910
7878


Summary of computational transaction
Raw Inputview raw input (R code)
Raw Outputview raw output of R engine
Computing time7 seconds
R Server'George Udny Yule' @ 72.249.76.132

\begin{tabular}{lllllllll}
\hline
Summary of computational transaction \tabularnewline
Raw Input & view raw input (R code)  \tabularnewline
Raw Output & view raw output of R engine  \tabularnewline
Computing time & 7 seconds \tabularnewline
R Server & 'George Udny Yule' @ 72.249.76.132 \tabularnewline
\hline
\end{tabular}
%Source: https://freestatistics.org/blog/index.php?pk=115350&T=0

[TABLE]
[ROW][C]Summary of computational transaction[/C][/ROW]
[ROW][C]Raw Input[/C][C]view raw input (R code) [/C][/ROW]
[ROW][C]Raw Output[/C][C]view raw output of R engine [/C][/ROW]
[ROW][C]Computing time[/C][C]7 seconds[/C][/ROW]
[ROW][C]R Server[/C][C]'George Udny Yule' @ 72.249.76.132[/C][/ROW]
[/TABLE]
Source: https://freestatistics.org/blog/index.php?pk=115350&T=0

Globally Unique Identifier (entire table): ba.freestatistics.org/blog/index.php?pk=115350&T=0

As an alternative you can also use a QR Code:  

The GUIDs for individual cells are displayed in the table below:

Summary of computational transaction
Raw Inputview raw input (R code)
Raw Outputview raw output of R engine
Computing time7 seconds
R Server'George Udny Yule' @ 72.249.76.132


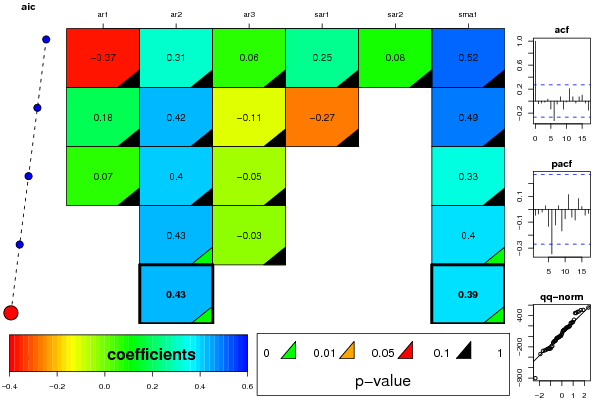
ARIMA Parameter Estimation and Backward Selection
Iterationar1ar2ar3sar1sar2sma1
Estimates ( 1 )-0.36980.30970.06030.25050.08390.5172
(p-val)(0.8603 )(0.8019 )(0.8749 )(0.886 )(0.8908 )(0.6529 )
Estimates ( 2 )0.18220.422-0.1148-0.271200.4881
(p-val)(0.796 )(0.3855 )(0.7468 )(0.8684 )(NA )(0.7594 )
Estimates ( 3 )0.07120.4042-0.0473000.3283
(p-val)(0.9355 )(0.2086 )(0.8665 )(NA )(NA )(0.7089 )
Estimates ( 4 )00.4273-0.0262000.3981
(p-val)(NA )(0.0018 )(0.8353 )(NA )(NA )(0.0053 )
Estimates ( 5 )00.42590000.3928
(p-val)(NA )(0.002 )(NA )(NA )(NA )(0.0048 )
Estimates ( 6 )NANANANANANA
(p-val)(NA )(NA )(NA )(NA )(NA )(NA )
Estimates ( 7 )NANANANANANA
(p-val)(NA )(NA )(NA )(NA )(NA )(NA )
Estimates ( 8 )NANANANANANA
(p-val)(NA )(NA )(NA )(NA )(NA )(NA )
Estimates ( 9 )NANANANANANA
(p-val)(NA )(NA )(NA )(NA )(NA )(NA )
Estimates ( 10 )NANANANANANA
(p-val)(NA )(NA )(NA )(NA )(NA )(NA )
Estimates ( 11 )NANANANANANA
(p-val)(NA )(NA )(NA )(NA )(NA )(NA )

\begin{tabular}{lllllllll}
\hline
ARIMA Parameter Estimation and Backward Selection \tabularnewline
Iteration & ar1 & ar2 & ar3 & sar1 & sar2 & sma1 \tabularnewline
Estimates ( 1 ) & -0.3698 & 0.3097 & 0.0603 & 0.2505 & 0.0839 & 0.5172 \tabularnewline
(p-val) & (0.8603 ) & (0.8019 ) & (0.8749 ) & (0.886 ) & (0.8908 ) & (0.6529 ) \tabularnewline
Estimates ( 2 ) & 0.1822 & 0.422 & -0.1148 & -0.2712 & 0 & 0.4881 \tabularnewline
(p-val) & (0.796 ) & (0.3855 ) & (0.7468 ) & (0.8684 ) & (NA ) & (0.7594 ) \tabularnewline
Estimates ( 3 ) & 0.0712 & 0.4042 & -0.0473 & 0 & 0 & 0.3283 \tabularnewline
(p-val) & (0.9355 ) & (0.2086 ) & (0.8665 ) & (NA ) & (NA ) & (0.7089 ) \tabularnewline
Estimates ( 4 ) & 0 & 0.4273 & -0.0262 & 0 & 0 & 0.3981 \tabularnewline
(p-val) & (NA ) & (0.0018 ) & (0.8353 ) & (NA ) & (NA ) & (0.0053 ) \tabularnewline
Estimates ( 5 ) & 0 & 0.4259 & 0 & 0 & 0 & 0.3928 \tabularnewline
(p-val) & (NA ) & (0.002 ) & (NA ) & (NA ) & (NA ) & (0.0048 ) \tabularnewline
Estimates ( 6 ) & NA & NA & NA & NA & NA & NA \tabularnewline
(p-val) & (NA ) & (NA ) & (NA ) & (NA ) & (NA ) & (NA ) \tabularnewline
Estimates ( 7 ) & NA & NA & NA & NA & NA & NA \tabularnewline
(p-val) & (NA ) & (NA ) & (NA ) & (NA ) & (NA ) & (NA ) \tabularnewline
Estimates ( 8 ) & NA & NA & NA & NA & NA & NA \tabularnewline
(p-val) & (NA ) & (NA ) & (NA ) & (NA ) & (NA ) & (NA ) \tabularnewline
Estimates ( 9 ) & NA & NA & NA & NA & NA & NA \tabularnewline
(p-val) & (NA ) & (NA ) & (NA ) & (NA ) & (NA ) & (NA ) \tabularnewline
Estimates ( 10 ) & NA & NA & NA & NA & NA & NA \tabularnewline
(p-val) & (NA ) & (NA ) & (NA ) & (NA ) & (NA ) & (NA ) \tabularnewline
Estimates ( 11 ) & NA & NA & NA & NA & NA & NA \tabularnewline
(p-val) & (NA ) & (NA ) & (NA ) & (NA ) & (NA ) & (NA ) \tabularnewline
\hline
\end{tabular}
%Source: https://freestatistics.org/blog/index.php?pk=115350&T=1

[TABLE]
[ROW][C]ARIMA Parameter Estimation and Backward Selection[/C][/ROW]
[ROW][C]Iteration[/C][C]ar1[/C][C]ar2[/C][C]ar3[/C][C]sar1[/C][C]sar2[/C][C]sma1[/C][/ROW]
[ROW][C]Estimates ( 1 )[/C][C]-0.3698[/C][C]0.3097[/C][C]0.0603[/C][C]0.2505[/C][C]0.0839[/C][C]0.5172[/C][/ROW]
[ROW][C](p-val)[/C][C](0.8603 )[/C][C](0.8019 )[/C][C](0.8749 )[/C][C](0.886 )[/C][C](0.8908 )[/C][C](0.6529 )[/C][/ROW]
[ROW][C]Estimates ( 2 )[/C][C]0.1822[/C][C]0.422[/C][C]-0.1148[/C][C]-0.2712[/C][C]0[/C][C]0.4881[/C][/ROW]
[ROW][C](p-val)[/C][C](0.796 )[/C][C](0.3855 )[/C][C](0.7468 )[/C][C](0.8684 )[/C][C](NA )[/C][C](0.7594 )[/C][/ROW]
[ROW][C]Estimates ( 3 )[/C][C]0.0712[/C][C]0.4042[/C][C]-0.0473[/C][C]0[/C][C]0[/C][C]0.3283[/C][/ROW]
[ROW][C](p-val)[/C][C](0.9355 )[/C][C](0.2086 )[/C][C](0.8665 )[/C][C](NA )[/C][C](NA )[/C][C](0.7089 )[/C][/ROW]
[ROW][C]Estimates ( 4 )[/C][C]0[/C][C]0.4273[/C][C]-0.0262[/C][C]0[/C][C]0[/C][C]0.3981[/C][/ROW]
[ROW][C](p-val)[/C][C](NA )[/C][C](0.0018 )[/C][C](0.8353 )[/C][C](NA )[/C][C](NA )[/C][C](0.0053 )[/C][/ROW]
[ROW][C]Estimates ( 5 )[/C][C]0[/C][C]0.4259[/C][C]0[/C][C]0[/C][C]0[/C][C]0.3928[/C][/ROW]
[ROW][C](p-val)[/C][C](NA )[/C][C](0.002 )[/C][C](NA )[/C][C](NA )[/C][C](NA )[/C][C](0.0048 )[/C][/ROW]
[ROW][C]Estimates ( 6 )[/C][C]NA[/C][C]NA[/C][C]NA[/C][C]NA[/C][C]NA[/C][C]NA[/C][/ROW]
[ROW][C](p-val)[/C][C](NA )[/C][C](NA )[/C][C](NA )[/C][C](NA )[/C][C](NA )[/C][C](NA )[/C][/ROW]
[ROW][C]Estimates ( 7 )[/C][C]NA[/C][C]NA[/C][C]NA[/C][C]NA[/C][C]NA[/C][C]NA[/C][/ROW]
[ROW][C](p-val)[/C][C](NA )[/C][C](NA )[/C][C](NA )[/C][C](NA )[/C][C](NA )[/C][C](NA )[/C][/ROW]
[ROW][C]Estimates ( 8 )[/C][C]NA[/C][C]NA[/C][C]NA[/C][C]NA[/C][C]NA[/C][C]NA[/C][/ROW]
[ROW][C](p-val)[/C][C](NA )[/C][C](NA )[/C][C](NA )[/C][C](NA )[/C][C](NA )[/C][C](NA )[/C][/ROW]
[ROW][C]Estimates ( 9 )[/C][C]NA[/C][C]NA[/C][C]NA[/C][C]NA[/C][C]NA[/C][C]NA[/C][/ROW]
[ROW][C](p-val)[/C][C](NA )[/C][C](NA )[/C][C](NA )[/C][C](NA )[/C][C](NA )[/C][C](NA )[/C][/ROW]
[ROW][C]Estimates ( 10 )[/C][C]NA[/C][C]NA[/C][C]NA[/C][C]NA[/C][C]NA[/C][C]NA[/C][/ROW]
[ROW][C](p-val)[/C][C](NA )[/C][C](NA )[/C][C](NA )[/C][C](NA )[/C][C](NA )[/C][C](NA )[/C][/ROW]
[ROW][C]Estimates ( 11 )[/C][C]NA[/C][C]NA[/C][C]NA[/C][C]NA[/C][C]NA[/C][C]NA[/C][/ROW]
[ROW][C](p-val)[/C][C](NA )[/C][C](NA )[/C][C](NA )[/C][C](NA )[/C][C](NA )[/C][C](NA )[/C][/ROW]
[/TABLE]
Source: https://freestatistics.org/blog/index.php?pk=115350&T=1

Globally Unique Identifier (entire table): ba.freestatistics.org/blog/index.php?pk=115350&T=1

As an alternative you can also use a QR Code:  

The GUIDs for individual cells are displayed in the table below:

ARIMA Parameter Estimation and Backward Selection
Iterationar1ar2ar3sar1sar2sma1
Estimates ( 1 )-0.36980.30970.06030.25050.08390.5172
(p-val)(0.8603 )(0.8019 )(0.8749 )(0.886 )(0.8908 )(0.6529 )
Estimates ( 2 )0.18220.422-0.1148-0.271200.4881
(p-val)(0.796 )(0.3855 )(0.7468 )(0.8684 )(NA )(0.7594 )
Estimates ( 3 )0.07120.4042-0.0473000.3283
(p-val)(0.9355 )(0.2086 )(0.8665 )(NA )(NA )(0.7089 )
Estimates ( 4 )00.4273-0.0262000.3981
(p-val)(NA )(0.0018 )(0.8353 )(NA )(NA )(0.0053 )
Estimates ( 5 )00.42590000.3928
(p-val)(NA )(0.002 )(NA )(NA )(NA )(0.0048 )
Estimates ( 6 )NANANANANANA
(p-val)(NA )(NA )(NA )(NA )(NA )(NA )
Estimates ( 7 )NANANANANANA
(p-val)(NA )(NA )(NA )(NA )(NA )(NA )
Estimates ( 8 )NANANANANANA
(p-val)(NA )(NA )(NA )(NA )(NA )(NA )
Estimates ( 9 )NANANANANANA
(p-val)(NA )(NA )(NA )(NA )(NA )(NA )
Estimates ( 10 )NANANANANANA
(p-val)(NA )(NA )(NA )(NA )(NA )(NA )
Estimates ( 11 )NANANANANANA
(p-val)(NA )(NA )(NA )(NA )(NA )(NA )


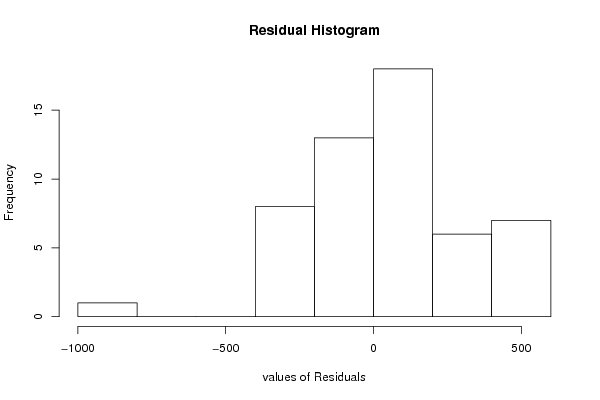
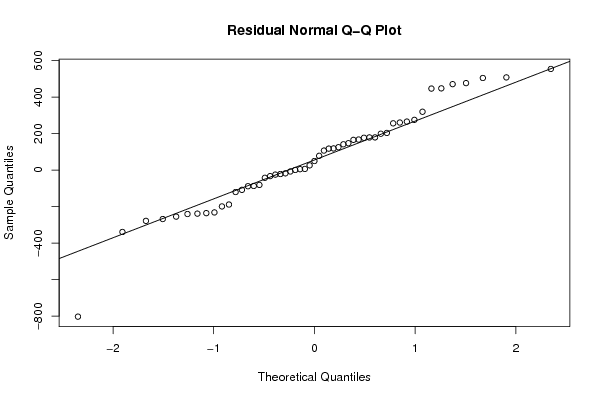
Estimated ARIMA Residuals
Value
0.715999498755167
-32.9599343280933
49.653572684612
125.394337086746
-17.5801021620334
-42.2613318352843
26.1091639773621
-108.299827543883
5.13224105822928
179.085396179223
-88.2893080847088
-86.9554591237869
6.36008487620421
179.281055931487
147.385007547526
-21.4544695405241
-240.694976178237
199.231013178644
165.796615026504
-7.47171842743773
260.645247686401
-120.270246291145
256.391392461961
118.814925901356
-235.88033082693
275.350537036238
78.246763976058
446.808665286172
471.093319889779
-339.060513892973
-188.733398600491
-81.1245189975589
117.812386462277
-254.982291812452
-199.032553416901
319.816773871602
-24.6985096266076
106.982620383998
504.844531439206
554.388511853246
476.844508422258
-278.316661285384
448.059234002561
141.431036116887
-238.601253742175
-803.199798217676
508.108505089714
-231.917137348519
265.838824844377
177.096170444308
167.404391030173
203.677038532303
-268.287305205124

\begin{tabular}{lllllllll}
\hline
Estimated ARIMA Residuals \tabularnewline
Value \tabularnewline
0.715999498755167 \tabularnewline
-32.9599343280933 \tabularnewline
49.653572684612 \tabularnewline
125.394337086746 \tabularnewline
-17.5801021620334 \tabularnewline
-42.2613318352843 \tabularnewline
26.1091639773621 \tabularnewline
-108.299827543883 \tabularnewline
5.13224105822928 \tabularnewline
179.085396179223 \tabularnewline
-88.2893080847088 \tabularnewline
-86.9554591237869 \tabularnewline
6.36008487620421 \tabularnewline
179.281055931487 \tabularnewline
147.385007547526 \tabularnewline
-21.4544695405241 \tabularnewline
-240.694976178237 \tabularnewline
199.231013178644 \tabularnewline
165.796615026504 \tabularnewline
-7.47171842743773 \tabularnewline
260.645247686401 \tabularnewline
-120.270246291145 \tabularnewline
256.391392461961 \tabularnewline
118.814925901356 \tabularnewline
-235.88033082693 \tabularnewline
275.350537036238 \tabularnewline
78.246763976058 \tabularnewline
446.808665286172 \tabularnewline
471.093319889779 \tabularnewline
-339.060513892973 \tabularnewline
-188.733398600491 \tabularnewline
-81.1245189975589 \tabularnewline
117.812386462277 \tabularnewline
-254.982291812452 \tabularnewline
-199.032553416901 \tabularnewline
319.816773871602 \tabularnewline
-24.6985096266076 \tabularnewline
106.982620383998 \tabularnewline
504.844531439206 \tabularnewline
554.388511853246 \tabularnewline
476.844508422258 \tabularnewline
-278.316661285384 \tabularnewline
448.059234002561 \tabularnewline
141.431036116887 \tabularnewline
-238.601253742175 \tabularnewline
-803.199798217676 \tabularnewline
508.108505089714 \tabularnewline
-231.917137348519 \tabularnewline
265.838824844377 \tabularnewline
177.096170444308 \tabularnewline
167.404391030173 \tabularnewline
203.677038532303 \tabularnewline
-268.287305205124 \tabularnewline
\hline
\end{tabular}
%Source: https://freestatistics.org/blog/index.php?pk=115350&T=2

[TABLE]
[ROW][C]Estimated ARIMA Residuals[/C][/ROW]
[ROW][C]Value[/C][/ROW]
[ROW][C]0.715999498755167[/C][/ROW]
[ROW][C]-32.9599343280933[/C][/ROW]
[ROW][C]49.653572684612[/C][/ROW]
[ROW][C]125.394337086746[/C][/ROW]
[ROW][C]-17.5801021620334[/C][/ROW]
[ROW][C]-42.2613318352843[/C][/ROW]
[ROW][C]26.1091639773621[/C][/ROW]
[ROW][C]-108.299827543883[/C][/ROW]
[ROW][C]5.13224105822928[/C][/ROW]
[ROW][C]179.085396179223[/C][/ROW]
[ROW][C]-88.2893080847088[/C][/ROW]
[ROW][C]-86.9554591237869[/C][/ROW]
[ROW][C]6.36008487620421[/C][/ROW]
[ROW][C]179.281055931487[/C][/ROW]
[ROW][C]147.385007547526[/C][/ROW]
[ROW][C]-21.4544695405241[/C][/ROW]
[ROW][C]-240.694976178237[/C][/ROW]
[ROW][C]199.231013178644[/C][/ROW]
[ROW][C]165.796615026504[/C][/ROW]
[ROW][C]-7.47171842743773[/C][/ROW]
[ROW][C]260.645247686401[/C][/ROW]
[ROW][C]-120.270246291145[/C][/ROW]
[ROW][C]256.391392461961[/C][/ROW]
[ROW][C]118.814925901356[/C][/ROW]
[ROW][C]-235.88033082693[/C][/ROW]
[ROW][C]275.350537036238[/C][/ROW]
[ROW][C]78.246763976058[/C][/ROW]
[ROW][C]446.808665286172[/C][/ROW]
[ROW][C]471.093319889779[/C][/ROW]
[ROW][C]-339.060513892973[/C][/ROW]
[ROW][C]-188.733398600491[/C][/ROW]
[ROW][C]-81.1245189975589[/C][/ROW]
[ROW][C]117.812386462277[/C][/ROW]
[ROW][C]-254.982291812452[/C][/ROW]
[ROW][C]-199.032553416901[/C][/ROW]
[ROW][C]319.816773871602[/C][/ROW]
[ROW][C]-24.6985096266076[/C][/ROW]
[ROW][C]106.982620383998[/C][/ROW]
[ROW][C]504.844531439206[/C][/ROW]
[ROW][C]554.388511853246[/C][/ROW]
[ROW][C]476.844508422258[/C][/ROW]
[ROW][C]-278.316661285384[/C][/ROW]
[ROW][C]448.059234002561[/C][/ROW]
[ROW][C]141.431036116887[/C][/ROW]
[ROW][C]-238.601253742175[/C][/ROW]
[ROW][C]-803.199798217676[/C][/ROW]
[ROW][C]508.108505089714[/C][/ROW]
[ROW][C]-231.917137348519[/C][/ROW]
[ROW][C]265.838824844377[/C][/ROW]
[ROW][C]177.096170444308[/C][/ROW]
[ROW][C]167.404391030173[/C][/ROW]
[ROW][C]203.677038532303[/C][/ROW]
[ROW][C]-268.287305205124[/C][/ROW]
[/TABLE]
Source: https://freestatistics.org/blog/index.php?pk=115350&T=2

Globally Unique Identifier (entire table): ba.freestatistics.org/blog/index.php?pk=115350&T=2

As an alternative you can also use a QR Code:  

The GUIDs for individual cells are displayed in the table below:

Estimated ARIMA Residuals
Value
0.715999498755167
-32.9599343280933
49.653572684612
125.394337086746
-17.5801021620334
-42.2613318352843
26.1091639773621
-108.299827543883
5.13224105822928
179.085396179223
-88.2893080847088
-86.9554591237869
6.36008487620421
179.281055931487
147.385007547526
-21.4544695405241
-240.694976178237
199.231013178644
165.796615026504
-7.47171842743773
260.645247686401
-120.270246291145
256.391392461961
118.814925901356
-235.88033082693
275.350537036238
78.246763976058
446.808665286172
471.093319889779
-339.060513892973
-188.733398600491
-81.1245189975589
117.812386462277
-254.982291812452
-199.032553416901
319.816773871602
-24.6985096266076
106.982620383998
504.844531439206
554.388511853246
476.844508422258
-278.316661285384
448.059234002561
141.431036116887
-238.601253742175
-803.199798217676
508.108505089714
-231.917137348519
265.838824844377
177.096170444308
167.404391030173
203.677038532303
-268.287305205124


Parameters (Session):
par1 = FALSE ; par2 = 1 ; par3 = 1 ; par4 = 0 ; par5 = 1 ; par6 = 3 ; par7 = 0 ; par8 = 2 ; par9 = 1 ;
Parameters (R input):
par1 = FALSE ; par2 = 1 ; par3 = 1 ; par4 = 0 ; par5 = 1 ; par6 = 3 ; par7 = 0 ; par8 = 2 ; par9 = 1 ;
R code (references can be found in the software module):
library(lattice)
if (par1 == 'TRUE') par1 <- TRUE
if (par1 == 'FALSE') par1 <- FALSE
par2 <- as.numeric(par2) #Box-Cox lambda transformation parameter
par3 <- as.numeric(par3) #degree of non-seasonal differencing
par4 <- as.numeric(par4) #degree of seasonal differencing
par5 <- as.numeric(par5) #seasonal period
par6 <- as.numeric(par6) #degree (p) of the non-seasonal AR(p) polynomial
par7 <- as.numeric(par7) #degree (q) of the non-seasonal MA(q) polynomial
par8 <- as.numeric(par8) #degree (P) of the seasonal AR(P) polynomial
par9 <- as.numeric(par9) #degree (Q) of the seasonal MA(Q) polynomial
armaGR <- function(arima.out, names, n){
try1 <- arima.out$coef
try2 <- sqrt(diag(arima.out$var.coef))
try.data.frame <- data.frame(matrix(NA,ncol=4,nrow=length(names)))
dimnames(try.data.frame) <- list(names,c('coef','std','tstat','pv'))
try.data.frame[,1] <- try1
for(i in 1:length(try2)) try.data.frame[which(rownames(try.data.frame)==names(try2)[i]),2] <- try2[i]
try.data.frame[,3] <- try.data.frame[,1] / try.data.frame[,2]
try.data.frame[,4] <- round((1-pt(abs(try.data.frame[,3]),df=n-(length(try2)+1)))*2,5)
vector <- rep(NA,length(names))
vector[is.na(try.data.frame[,4])] <- 0
maxi <- which.max(try.data.frame[,4])
continue <- max(try.data.frame[,4],na.rm=TRUE) > .05
vector[maxi] <- 0
list(summary=try.data.frame,next.vector=vector,continue=continue)
}
arimaSelect <- function(series, order=c(13,0,0), seasonal=list(order=c(2,0,0),period=12), include.mean=F){
nrc <- order[1]+order[3]+seasonal$order[1]+seasonal$order[3]
coeff <- matrix(NA, nrow=nrc*2, ncol=nrc)
pval <- matrix(NA, nrow=nrc*2, ncol=nrc)
mylist <- rep(list(NULL), nrc)
names <- NULL
if(order[1] > 0) names <- paste('ar',1:order[1],sep='')
if(order[3] > 0) names <- c( names , paste('ma',1:order[3],sep='') )
if(seasonal$order[1] > 0) names <- c(names, paste('sar',1:seasonal$order[1],sep=''))
if(seasonal$order[3] > 0) names <- c(names, paste('sma',1:seasonal$order[3],sep=''))
arima.out <- arima(series, order=order, seasonal=seasonal, include.mean=include.mean, method='ML')
mylist[[1]] <- arima.out
last.arma <- armaGR(arima.out, names, length(series))
mystop <- FALSE
i <- 1
coeff[i,] <- last.arma[[1]][,1]
pval [i,] <- last.arma[[1]][,4]
i <- 2
aic <- arima.out$aic
while(!mystop){
mylist[[i]] <- arima.out
arima.out <- arima(series, order=order, seasonal=seasonal, include.mean=include.mean, method='ML', fixed=last.arma$next.vector)
aic <- c(aic, arima.out$aic)
last.arma <- armaGR(arima.out, names, length(series))
mystop <- !last.arma$continue
coeff[i,] <- last.arma[[1]][,1]
pval [i,] <- last.arma[[1]][,4]
i <- i+1
}
list(coeff, pval, mylist, aic=aic)
}
arimaSelectplot <- function(arimaSelect.out,noms,choix){
noms <- names(arimaSelect.out[[3]][[1]]$coef)
coeff <- arimaSelect.out[[1]]
k <- min(which(is.na(coeff[,1])))-1
coeff <- coeff[1:k,]
pval <- arimaSelect.out[[2]][1:k,]
aic <- arimaSelect.out$aic[1:k]
coeff[coeff==0] <- NA
n <- ncol(coeff)
if(missing(choix)) choix <- k
layout(matrix(c(1,1,1,2,
3,3,3,2,
3,3,3,4,
5,6,7,7),nr=4),
widths=c(10,35,45,15),
heights=c(30,30,15,15))
couleurs <- rainbow(75)[1:50]#(50)
ticks <- pretty(coeff)
par(mar=c(1,1,3,1))
plot(aic,k:1-.5,type='o',pch=21,bg='blue',cex=2,axes=F,lty=2,xpd=NA)
points(aic[choix],k-choix+.5,pch=21,cex=4,bg=2,xpd=NA)
title('aic',line=2)
par(mar=c(3,0,0,0))
plot(0,axes=F,xlab='',ylab='',xlim=range(ticks),ylim=c(.1,1))
rect(xleft = min(ticks) + (0:49)/50*(max(ticks)-min(ticks)),
xright = min(ticks) + (1:50)/50*(max(ticks)-min(ticks)),
ytop = rep(1,50),
ybottom= rep(0,50),col=couleurs,border=NA)
axis(1,ticks)
rect(xleft=min(ticks),xright=max(ticks),ytop=1,ybottom=0)
text(mean(coeff,na.rm=T),.5,'coefficients',cex=2,font=2)
par(mar=c(1,1,3,1))
image(1:n,1:k,t(coeff[k:1,]),axes=F,col=couleurs,zlim=range(ticks))
for(i in 1:n) for(j in 1:k) if(!is.na(coeff[j,i])) {
if(pval[j,i]<.01) symb = 'green'
else if( (pval[j,i]<.05) & (pval[j,i]>=.01)) symb = 'orange'
else if( (pval[j,i]<.1) & (pval[j,i]>=.05)) symb = 'red'
else symb = 'black'
polygon(c(i+.5 ,i+.2 ,i+.5 ,i+.5),
c(k-j+0.5,k-j+0.5,k-j+0.8,k-j+0.5),
col=symb)
if(j==choix) {
rect(xleft=i-.5,
xright=i+.5,
ybottom=k-j+1.5,
ytop=k-j+.5,
lwd=4)
text(i,
k-j+1,
round(coeff[j,i],2),
cex=1.2,
font=2)
}
else{
rect(xleft=i-.5,xright=i+.5,ybottom=k-j+1.5,ytop=k-j+.5)
text(i,k-j+1,round(coeff[j,i],2),cex=1.2,font=1)
}
}
axis(3,1:n,noms)
par(mar=c(0.5,0,0,0.5))
plot(0,axes=F,xlab='',ylab='',type='n',xlim=c(0,8),ylim=c(-.2,.8))
cols <- c('green','orange','red','black')
niv <- c('0','0.01','0.05','0.1')
for(i in 0:3){
polygon(c(1+2*i ,1+2*i ,1+2*i-.5 ,1+2*i),
c(.4 ,.7 , .4 , .4),
col=cols[i+1])
text(2*i,0.5,niv[i+1],cex=1.5)
}
text(8,.5,1,cex=1.5)
text(4,0,'p-value',cex=2)
box()
residus <- arimaSelect.out[[3]][[choix]]$res
par(mar=c(1,2,4,1))
acf(residus,main='')
title('acf',line=.5)
par(mar=c(1,2,4,1))
pacf(residus,main='')
title('pacf',line=.5)
par(mar=c(2,2,4,1))
qqnorm(residus,main='')
title('qq-norm',line=.5)
qqline(residus)
residus
}
if (par2 == 0) x <- log(x)
if (par2 != 0) x <- x^par2
(selection <- arimaSelect(x, order=c(par6,par3,par7), seasonal=list(order=c(par8,par4,par9), period=par5)))
bitmap(file='test1.png')
resid <- arimaSelectplot(selection)
dev.off()
resid
bitmap(file='test2.png')
acf(resid,length(resid)/2, main='Residual Autocorrelation Function')
dev.off()
bitmap(file='test3.png')
pacf(resid,length(resid)/2, main='Residual Partial Autocorrelation Function')
dev.off()
bitmap(file='test4.png')
cpgram(resid, main='Residual Cumulative Periodogram')
dev.off()
bitmap(file='test5.png')
hist(resid, main='Residual Histogram', xlab='values of Residuals')
dev.off()
bitmap(file='test6.png')
densityplot(~resid,col='black',main='Residual Density Plot', xlab='values of Residuals')
dev.off()
bitmap(file='test7.png')
qqnorm(resid, main='Residual Normal Q-Q Plot')
qqline(resid)
dev.off()
ncols <- length(selection[[1]][1,])
nrows <- length(selection[[2]][,1])-1
load(file='createtable')
a<-table.start()
a<-table.row.start(a)
a<-table.element(a,'ARIMA Parameter Estimation and Backward Selection', ncols+1,TRUE)
a<-table.row.end(a)
a<-table.row.start(a)
a<-table.element(a,'Iteration', header=TRUE)
for (i in 1:ncols) {
a<-table.element(a,names(selection[[3]][[1]]$coef)[i],header=TRUE)
}
a<-table.row.end(a)
for (j in 1:nrows) {
a<-table.row.start(a)
mydum <- 'Estimates ('
mydum <- paste(mydum,j)
mydum <- paste(mydum,')')
a<-table.element(a,mydum, header=TRUE)
for (i in 1:ncols) {
a<-table.element(a,round(selection[[1]][j,i],4))
}
a<-table.row.end(a)
a<-table.row.start(a)
a<-table.element(a,'(p-val)', header=TRUE)
for (i in 1:ncols) {
mydum <- '('
mydum <- paste(mydum,round(selection[[2]][j,i],4),sep='')
mydum <- paste(mydum,')')
a<-table.element(a,mydum)
}
a<-table.row.end(a)
}
a<-table.end(a)
table.save(a,file='mytable.tab')
a<-table.start()
a<-table.row.start(a)
a<-table.element(a,'Estimated ARIMA Residuals', 1,TRUE)
a<-table.row.end(a)
a<-table.row.start(a)
a<-table.element(a,'Value', 1,TRUE)
a<-table.row.end(a)
for (i in (par4*par5+par3):length(resid)) {
a<-table.row.start(a)
a<-table.element(a,resid[i])
a<-table.row.end(a)
}
a<-table.end(a)
table.save(a,file='mytable1.tab')