Free Statistics

of Irreproducible Research!

Author's title

Author*The author of this computation has been verified*
R Software Modulerwasp_autocorrelation.wasp
Title produced by software(Partial) Autocorrelation Function
Date of computationSat, 25 Dec 2010 10:24:30 +0000
Cite this page as followsStatistical Computations at FreeStatistics.org, Office for Research Development and Education, URL https://freestatistics.org/blog/index.php?v=date/2010/Dec/25/t12932728197iqk90ee7y8grzl.htm/, Retrieved Sun, 28 Apr 2024 22:25:17 +0000
Statistical Computations at FreeStatistics.org, Office for Research Development and Education, URL https://freestatistics.org/blog/index.php?pk=115343, Retrieved Sun, 28 Apr 2024 22:25:17 +0000
QR Codes:

Original text written by user:
IsPrivate?No (this computation is public)
User-defined keywords
Estimated Impact153
Family? (F = Feedback message, R = changed R code, M = changed R Module, P = changed Parameters, D = changed Data)
-       [(Partial) Autocorrelation Function] [ACF d=0 D=0] [2010-12-25 10:24:30] [346ac46ef4f6bb745e48fc42fac6253b] [Current]
Feedback Forum

Post a new message
Dataseries X:
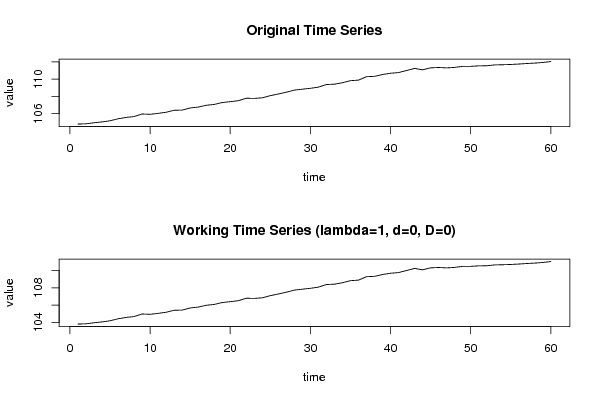
104,79
104,82
104,94
105,04
105,17
105,4
105,56
105,66
105,96
105,92
106,03
106,16
106,39
106,41
106,66
106,76
106,97
107,07
107,29
107,39
107,5
107,79
107,77
107,84
108,09
108,28
108,49
108,73
108,84
108,94
109,08
109,38
109,42
109,59
109,83
109,89
110,29
110,33
110,54
110,69
110,77
111,01
111,25
111,09
111,32
111,36
111,31
111,37
111,49
111,49
111,55
111,56
111,66
111,68
111,71
111,76
111,82
111,87
111,94
112,05


Summary of computational transaction
Raw Inputview raw input (R code)
Raw Outputview raw output of R engine
Computing time2 seconds
R Server'Sir Ronald Aylmer Fisher' @ 193.190.124.24

\begin{tabular}{lllllllll}
\hline
Summary of computational transaction \tabularnewline
Raw Input & view raw input (R code)  \tabularnewline
Raw Output & view raw output of R engine  \tabularnewline
Computing time & 2 seconds \tabularnewline
R Server & 'Sir Ronald Aylmer Fisher' @ 193.190.124.24 \tabularnewline
\hline
\end{tabular}
%Source: https://freestatistics.org/blog/index.php?pk=115343&T=0

[TABLE]
[ROW][C]Summary of computational transaction[/C][/ROW]
[ROW][C]Raw Input[/C][C]view raw input (R code) [/C][/ROW]
[ROW][C]Raw Output[/C][C]view raw output of R engine [/C][/ROW]
[ROW][C]Computing time[/C][C]2 seconds[/C][/ROW]
[ROW][C]R Server[/C][C]'Sir Ronald Aylmer Fisher' @ 193.190.124.24[/C][/ROW]
[/TABLE]
Source: https://freestatistics.org/blog/index.php?pk=115343&T=0

Globally Unique Identifier (entire table): ba.freestatistics.org/blog/index.php?pk=115343&T=0

As an alternative you can also use a QR Code:  

The GUIDs for individual cells are displayed in the table below:

Summary of computational transaction
Raw Inputview raw input (R code)
Raw Outputview raw output of R engine
Computing time2 seconds
R Server'Sir Ronald Aylmer Fisher' @ 193.190.124.24


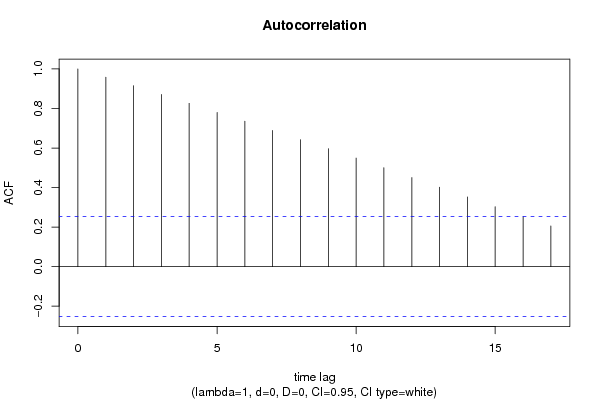
Autocorrelation Function
Time lag kACF(k)T-STATP-value
10.9579917.42060
20.9150817.08820
30.8713226.74920
40.8260646.39870
50.7802676.04390
60.7351065.69410
70.6891095.33781e-06
80.6420774.97353e-06
90.5969094.62361e-05
100.5488984.25173.8e-05
110.5000583.87340.000134
120.4502833.48790.000459
130.4021833.11530.001409
140.3523662.72940.004157
150.3029292.34650.011136
160.252741.95770.027459
170.2052151.58960.058591

\begin{tabular}{lllllllll}
\hline
Autocorrelation Function \tabularnewline
Time lag k & ACF(k) & T-STAT & P-value \tabularnewline
1 & 0.957991 & 7.4206 & 0 \tabularnewline
2 & 0.915081 & 7.0882 & 0 \tabularnewline
3 & 0.871322 & 6.7492 & 0 \tabularnewline
4 & 0.826064 & 6.3987 & 0 \tabularnewline
5 & 0.780267 & 6.0439 & 0 \tabularnewline
6 & 0.735106 & 5.6941 & 0 \tabularnewline
7 & 0.689109 & 5.3378 & 1e-06 \tabularnewline
8 & 0.642077 & 4.9735 & 3e-06 \tabularnewline
9 & 0.596909 & 4.6236 & 1e-05 \tabularnewline
10 & 0.548898 & 4.2517 & 3.8e-05 \tabularnewline
11 & 0.500058 & 3.8734 & 0.000134 \tabularnewline
12 & 0.450283 & 3.4879 & 0.000459 \tabularnewline
13 & 0.402183 & 3.1153 & 0.001409 \tabularnewline
14 & 0.352366 & 2.7294 & 0.004157 \tabularnewline
15 & 0.302929 & 2.3465 & 0.011136 \tabularnewline
16 & 0.25274 & 1.9577 & 0.027459 \tabularnewline
17 & 0.205215 & 1.5896 & 0.058591 \tabularnewline
\hline
\end{tabular}
%Source: https://freestatistics.org/blog/index.php?pk=115343&T=1

[TABLE]
[ROW][C]Autocorrelation Function[/C][/ROW]
[ROW][C]Time lag k[/C][C]ACF(k)[/C][C]T-STAT[/C][C]P-value[/C][/ROW]
[ROW][C]1[/C][C]0.957991[/C][C]7.4206[/C][C]0[/C][/ROW]
[ROW][C]2[/C][C]0.915081[/C][C]7.0882[/C][C]0[/C][/ROW]
[ROW][C]3[/C][C]0.871322[/C][C]6.7492[/C][C]0[/C][/ROW]
[ROW][C]4[/C][C]0.826064[/C][C]6.3987[/C][C]0[/C][/ROW]
[ROW][C]5[/C][C]0.780267[/C][C]6.0439[/C][C]0[/C][/ROW]
[ROW][C]6[/C][C]0.735106[/C][C]5.6941[/C][C]0[/C][/ROW]
[ROW][C]7[/C][C]0.689109[/C][C]5.3378[/C][C]1e-06[/C][/ROW]
[ROW][C]8[/C][C]0.642077[/C][C]4.9735[/C][C]3e-06[/C][/ROW]
[ROW][C]9[/C][C]0.596909[/C][C]4.6236[/C][C]1e-05[/C][/ROW]
[ROW][C]10[/C][C]0.548898[/C][C]4.2517[/C][C]3.8e-05[/C][/ROW]
[ROW][C]11[/C][C]0.500058[/C][C]3.8734[/C][C]0.000134[/C][/ROW]
[ROW][C]12[/C][C]0.450283[/C][C]3.4879[/C][C]0.000459[/C][/ROW]
[ROW][C]13[/C][C]0.402183[/C][C]3.1153[/C][C]0.001409[/C][/ROW]
[ROW][C]14[/C][C]0.352366[/C][C]2.7294[/C][C]0.004157[/C][/ROW]
[ROW][C]15[/C][C]0.302929[/C][C]2.3465[/C][C]0.011136[/C][/ROW]
[ROW][C]16[/C][C]0.25274[/C][C]1.9577[/C][C]0.027459[/C][/ROW]
[ROW][C]17[/C][C]0.205215[/C][C]1.5896[/C][C]0.058591[/C][/ROW]
[/TABLE]
Source: https://freestatistics.org/blog/index.php?pk=115343&T=1

Globally Unique Identifier (entire table): ba.freestatistics.org/blog/index.php?pk=115343&T=1

As an alternative you can also use a QR Code:  

The GUIDs for individual cells are displayed in the table below:

Autocorrelation Function
Time lag kACF(k)T-STATP-value
10.9579917.42060
20.9150817.08820
30.8713226.74920
40.8260646.39870
50.7802676.04390
60.7351065.69410
70.6891095.33781e-06
80.6420774.97353e-06
90.5969094.62361e-05
100.5488984.25173.8e-05
110.5000583.87340.000134
120.4502833.48790.000459
130.4021833.11530.001409
140.3523662.72940.004157
150.3029292.34650.011136
160.252741.95770.027459
170.2052151.58960.058591


Partial Autocorrelation Function
Time lag kPACF(k)T-STATP-value
10.9579917.42060
2-0.032414-0.25110.401305
3-0.032615-0.25260.400706
4-0.04145-0.32110.374636
5-0.030935-0.23960.40572
6-0.017526-0.13580.446235
7-0.035956-0.27850.390788
8-0.039664-0.30720.379865
9-0.005672-0.04390.482551
10-0.063079-0.48860.313451
11-0.040429-0.31320.377623
12-0.044207-0.34240.366615
13-0.012718-0.09850.460926
14-0.054448-0.42180.337355
15-0.032622-0.25270.400685
16-0.04784-0.37060.356133
17-0.005322-0.04120.483627

\begin{tabular}{lllllllll}
\hline
Partial Autocorrelation Function \tabularnewline
Time lag k & PACF(k) & T-STAT & P-value \tabularnewline
1 & 0.957991 & 7.4206 & 0 \tabularnewline
2 & -0.032414 & -0.2511 & 0.401305 \tabularnewline
3 & -0.032615 & -0.2526 & 0.400706 \tabularnewline
4 & -0.04145 & -0.3211 & 0.374636 \tabularnewline
5 & -0.030935 & -0.2396 & 0.40572 \tabularnewline
6 & -0.017526 & -0.1358 & 0.446235 \tabularnewline
7 & -0.035956 & -0.2785 & 0.390788 \tabularnewline
8 & -0.039664 & -0.3072 & 0.379865 \tabularnewline
9 & -0.005672 & -0.0439 & 0.482551 \tabularnewline
10 & -0.063079 & -0.4886 & 0.313451 \tabularnewline
11 & -0.040429 & -0.3132 & 0.377623 \tabularnewline
12 & -0.044207 & -0.3424 & 0.366615 \tabularnewline
13 & -0.012718 & -0.0985 & 0.460926 \tabularnewline
14 & -0.054448 & -0.4218 & 0.337355 \tabularnewline
15 & -0.032622 & -0.2527 & 0.400685 \tabularnewline
16 & -0.04784 & -0.3706 & 0.356133 \tabularnewline
17 & -0.005322 & -0.0412 & 0.483627 \tabularnewline
\hline
\end{tabular}
%Source: https://freestatistics.org/blog/index.php?pk=115343&T=2

[TABLE]
[ROW][C]Partial Autocorrelation Function[/C][/ROW]
[ROW][C]Time lag k[/C][C]PACF(k)[/C][C]T-STAT[/C][C]P-value[/C][/ROW]
[ROW][C]1[/C][C]0.957991[/C][C]7.4206[/C][C]0[/C][/ROW]
[ROW][C]2[/C][C]-0.032414[/C][C]-0.2511[/C][C]0.401305[/C][/ROW]
[ROW][C]3[/C][C]-0.032615[/C][C]-0.2526[/C][C]0.400706[/C][/ROW]
[ROW][C]4[/C][C]-0.04145[/C][C]-0.3211[/C][C]0.374636[/C][/ROW]
[ROW][C]5[/C][C]-0.030935[/C][C]-0.2396[/C][C]0.40572[/C][/ROW]
[ROW][C]6[/C][C]-0.017526[/C][C]-0.1358[/C][C]0.446235[/C][/ROW]
[ROW][C]7[/C][C]-0.035956[/C][C]-0.2785[/C][C]0.390788[/C][/ROW]
[ROW][C]8[/C][C]-0.039664[/C][C]-0.3072[/C][C]0.379865[/C][/ROW]
[ROW][C]9[/C][C]-0.005672[/C][C]-0.0439[/C][C]0.482551[/C][/ROW]
[ROW][C]10[/C][C]-0.063079[/C][C]-0.4886[/C][C]0.313451[/C][/ROW]
[ROW][C]11[/C][C]-0.040429[/C][C]-0.3132[/C][C]0.377623[/C][/ROW]
[ROW][C]12[/C][C]-0.044207[/C][C]-0.3424[/C][C]0.366615[/C][/ROW]
[ROW][C]13[/C][C]-0.012718[/C][C]-0.0985[/C][C]0.460926[/C][/ROW]
[ROW][C]14[/C][C]-0.054448[/C][C]-0.4218[/C][C]0.337355[/C][/ROW]
[ROW][C]15[/C][C]-0.032622[/C][C]-0.2527[/C][C]0.400685[/C][/ROW]
[ROW][C]16[/C][C]-0.04784[/C][C]-0.3706[/C][C]0.356133[/C][/ROW]
[ROW][C]17[/C][C]-0.005322[/C][C]-0.0412[/C][C]0.483627[/C][/ROW]
[/TABLE]
Source: https://freestatistics.org/blog/index.php?pk=115343&T=2

Globally Unique Identifier (entire table): ba.freestatistics.org/blog/index.php?pk=115343&T=2

As an alternative you can also use a QR Code:  

The GUIDs for individual cells are displayed in the table below:

Partial Autocorrelation Function
Time lag kPACF(k)T-STATP-value
10.9579917.42060
2-0.032414-0.25110.401305
3-0.032615-0.25260.400706
4-0.04145-0.32110.374636
5-0.030935-0.23960.40572
6-0.017526-0.13580.446235
7-0.035956-0.27850.390788
8-0.039664-0.30720.379865
9-0.005672-0.04390.482551
10-0.063079-0.48860.313451
11-0.040429-0.31320.377623
12-0.044207-0.34240.366615
13-0.012718-0.09850.460926
14-0.054448-0.42180.337355
15-0.032622-0.25270.400685
16-0.04784-0.37060.356133
17-0.005322-0.04120.483627


Parameters (Session):
par1 = Default ; par2 = 1 ; par3 = 0 ; par4 = 0 ; par5 = 12 ; par6 = White Noise ; par7 = 0.95 ;
Parameters (R input):
par1 = Default ; par2 = 1 ; par3 = 0 ; par4 = 0 ; par5 = 12 ; par6 = White Noise ; par7 = 0.95 ; par8 = ;
R code (references can be found in the software module):
if (par1 == 'Default') {
par1 = 10*log10(length(x))
} else {
par1 <- as.numeric(par1)
}
par2 <- as.numeric(par2)
par3 <- as.numeric(par3)
par4 <- as.numeric(par4)
par5 <- as.numeric(par5)
if (par6 == 'White Noise') par6 <- 'white' else par6 <- 'ma'
par7 <- as.numeric(par7)
if (par8 != '') par8 <- as.numeric(par8)
ox <- x
if (par8 == '') {
if (par2 == 0) {
x <- log(x)
} else {
x <- (x ^ par2 - 1) / par2
}
} else {
x <- log(x,base=par8)
}
if (par3 > 0) x <- diff(x,lag=1,difference=par3)
if (par4 > 0) x <- diff(x,lag=par5,difference=par4)
bitmap(file='picts.png')
op <- par(mfrow=c(2,1))
plot(ox,type='l',main='Original Time Series',xlab='time',ylab='value')
if (par8=='') {
mytitle <- paste('Working Time Series (lambda=',par2,', d=',par3,', D=',par4,')',sep='')
mysub <- paste('(lambda=',par2,', d=',par3,', D=',par4,', CI=', par7, ', CI type=',par6,')',sep='')
} else {
mytitle <- paste('Working Time Series (base=',par8,', d=',par3,', D=',par4,')',sep='')
mysub <- paste('(base=',par8,', d=',par3,', D=',par4,', CI=', par7, ', CI type=',par6,')',sep='')
}
plot(x,type='l', main=mytitle,xlab='time',ylab='value')
par(op)
dev.off()
bitmap(file='pic1.png')
racf <- acf(x, par1, main='Autocorrelation', xlab='time lag', ylab='ACF', ci.type=par6, ci=par7, sub=mysub)
dev.off()
bitmap(file='pic2.png')
rpacf <- pacf(x,par1,main='Partial Autocorrelation',xlab='lags',ylab='PACF',sub=mysub)
dev.off()
(myacf <- c(racf$acf))
(mypacf <- c(rpacf$acf))
lengthx <- length(x)
sqrtn <- sqrt(lengthx)
load(file='createtable')
a<-table.start()
a<-table.row.start(a)
a<-table.element(a,'Autocorrelation Function',4,TRUE)
a<-table.row.end(a)
a<-table.row.start(a)
a<-table.element(a,'Time lag k',header=TRUE)
a<-table.element(a,hyperlink('basics.htm','ACF(k)','click here for more information about the Autocorrelation Function'),header=TRUE)
a<-table.element(a,'T-STAT',header=TRUE)
a<-table.element(a,'P-value',header=TRUE)
a<-table.row.end(a)
for (i in 2:(par1+1)) {
a<-table.row.start(a)
a<-table.element(a,i-1,header=TRUE)
a<-table.element(a,round(myacf[i],6))
mytstat <- myacf[i]*sqrtn
a<-table.element(a,round(mytstat,4))
a<-table.element(a,round(1-pt(abs(mytstat),lengthx),6))
a<-table.row.end(a)
}
a<-table.end(a)
table.save(a,file='mytable.tab')
a<-table.start()
a<-table.row.start(a)
a<-table.element(a,'Partial Autocorrelation Function',4,TRUE)
a<-table.row.end(a)
a<-table.row.start(a)
a<-table.element(a,'Time lag k',header=TRUE)
a<-table.element(a,hyperlink('basics.htm','PACF(k)','click here for more information about the Partial Autocorrelation Function'),header=TRUE)
a<-table.element(a,'T-STAT',header=TRUE)
a<-table.element(a,'P-value',header=TRUE)
a<-table.row.end(a)
for (i in 1:par1) {
a<-table.row.start(a)
a<-table.element(a,i,header=TRUE)
a<-table.element(a,round(mypacf[i],6))
mytstat <- mypacf[i]*sqrtn
a<-table.element(a,round(mytstat,4))
a<-table.element(a,round(1-pt(abs(mytstat),lengthx),6))
a<-table.row.end(a)
}
a<-table.end(a)
table.save(a,file='mytable1.tab')