Free Statistics

of Irreproducible Research!

Author's title

Author*The author of this computation has been verified*
R Software Modulerwasp_autocorrelation.wasp
Title produced by software(Partial) Autocorrelation Function
Date of computationSat, 25 Dec 2010 05:18:47 +0000
Cite this page as followsStatistical Computations at FreeStatistics.org, Office for Research Development and Education, URL https://freestatistics.org/blog/index.php?v=date/2010/Dec/25/t1293254213j1euvcb1lhuddyc.htm/, Retrieved Mon, 29 Apr 2024 01:03:10 +0000
Statistical Computations at FreeStatistics.org, Office for Research Development and Education, URL https://freestatistics.org/blog/index.php?pk=115306, Retrieved Mon, 29 Apr 2024 01:03:10 +0000
QR Codes:

Original text written by user:
IsPrivate?No (this computation is public)
User-defined keywords
Estimated Impact166
Family? (F = Feedback message, R = changed R code, M = changed R Module, P = changed Parameters, D = changed Data)
-     [(Partial) Autocorrelation Function] [] [2009-12-17 10:41:38] [ebd107afac1bd6180acb277edd05815b]
-    D    [(Partial) Autocorrelation Function] [] [2010-12-25 05:18:47] [817f44ab92560f82acbc5e6c80d9a294] [Current]
Feedback Forum

Post a new message
Dataseries X:
19437.50
18885.1
16579
17203.6
19165.7
17107.6
17690.5
18664.9
15878.6
16014.6
16842.6
15986.9
16773.3
16263.1
13597.3
14285.6
15496.8
13916.8
14345.5
15761.3
14531.6
15076.6
15816.8
17180.4
20432.3
21289.5
18203.6
20159.5
21053.2
19673.6
21473.3
20244.7
19049.6
20194.3
18021.9
19537.3
20286.6
17967.7
16409.9
17802.7
18509.9
18161.3
16721.3
19106.9
16772.1
17463.6
16162.3
17862.9
17664.9
17180.8
15672.7
15189.8
17699.4
17444.6
15930.7
19691.6
16698
16896.2
17972.4
17637.4
15214


Summary of computational transaction
Raw Inputview raw input (R code)
Raw Outputview raw output of R engine
Computing time1 seconds
R Server'RServer@AstonUniversity' @ vre.aston.ac.uk

\begin{tabular}{lllllllll}
\hline
Summary of computational transaction \tabularnewline
Raw Input & view raw input (R code)  \tabularnewline
Raw Output & view raw output of R engine  \tabularnewline
Computing time & 1 seconds \tabularnewline
R Server & 'RServer@AstonUniversity' @ vre.aston.ac.uk \tabularnewline
\hline
\end{tabular}
%Source: https://freestatistics.org/blog/index.php?pk=115306&T=0

[TABLE]
[ROW][C]Summary of computational transaction[/C][/ROW]
[ROW][C]Raw Input[/C][C]view raw input (R code) [/C][/ROW]
[ROW][C]Raw Output[/C][C]view raw output of R engine [/C][/ROW]
[ROW][C]Computing time[/C][C]1 seconds[/C][/ROW]
[ROW][C]R Server[/C][C]'RServer@AstonUniversity' @ vre.aston.ac.uk[/C][/ROW]
[/TABLE]
Source: https://freestatistics.org/blog/index.php?pk=115306&T=0

Globally Unique Identifier (entire table): ba.freestatistics.org/blog/index.php?pk=115306&T=0

As an alternative you can also use a QR Code:  

The GUIDs for individual cells are displayed in the table below:

Summary of computational transaction
Raw Inputview raw input (R code)
Raw Outputview raw output of R engine
Computing time1 seconds
R Server'RServer@AstonUniversity' @ vre.aston.ac.uk


Autocorrelation Function
Time lag kACF(k)T-STATP-value
10.6207244.8484e-06
20.5062433.95390.000101
30.5870144.58471.2e-05
40.4237693.30970.000785
50.3143262.4550.008478
60.3266152.55090.006634
70.0916850.71610.238335
8-0.002633-0.02060.49183
9-0.08431-0.65850.256354
10-0.239815-1.8730.03293
11-0.257652-2.01230.024303
12-0.159252-1.24380.109167
13-0.372731-2.91110.002511
14-0.424272-3.31370.000776
15-0.370218-2.89150.002653
16-0.37039-2.89280.002643
17-0.366432-2.86190.002881
18-0.283327-2.21290.01533
19-0.287726-2.24720.014128
20-0.250756-1.95850.027376
21-0.261512-2.04250.022717
22-0.213042-1.66390.05063
23-0.119003-0.92940.178161
24-0.031214-0.24380.404105
25-0.0653-0.510.305942
26-0.092956-0.7260.235306
27-0.022761-0.17780.429745
280.0461420.36040.359905
290.0442010.34520.365559
300.0837530.65410.257742
310.0841690.65740.256705
320.0464250.36260.359082
330.0636950.49750.310321
340.0576460.45020.32707
350.0391180.30550.380504
360.1058690.82690.205769

\begin{tabular}{lllllllll}
\hline
Autocorrelation Function \tabularnewline
Time lag k & ACF(k) & T-STAT & P-value \tabularnewline
1 & 0.620724 & 4.848 & 4e-06 \tabularnewline
2 & 0.506243 & 3.9539 & 0.000101 \tabularnewline
3 & 0.587014 & 4.5847 & 1.2e-05 \tabularnewline
4 & 0.423769 & 3.3097 & 0.000785 \tabularnewline
5 & 0.314326 & 2.455 & 0.008478 \tabularnewline
6 & 0.326615 & 2.5509 & 0.006634 \tabularnewline
7 & 0.091685 & 0.7161 & 0.238335 \tabularnewline
8 & -0.002633 & -0.0206 & 0.49183 \tabularnewline
9 & -0.08431 & -0.6585 & 0.256354 \tabularnewline
10 & -0.239815 & -1.873 & 0.03293 \tabularnewline
11 & -0.257652 & -2.0123 & 0.024303 \tabularnewline
12 & -0.159252 & -1.2438 & 0.109167 \tabularnewline
13 & -0.372731 & -2.9111 & 0.002511 \tabularnewline
14 & -0.424272 & -3.3137 & 0.000776 \tabularnewline
15 & -0.370218 & -2.8915 & 0.002653 \tabularnewline
16 & -0.37039 & -2.8928 & 0.002643 \tabularnewline
17 & -0.366432 & -2.8619 & 0.002881 \tabularnewline
18 & -0.283327 & -2.2129 & 0.01533 \tabularnewline
19 & -0.287726 & -2.2472 & 0.014128 \tabularnewline
20 & -0.250756 & -1.9585 & 0.027376 \tabularnewline
21 & -0.261512 & -2.0425 & 0.022717 \tabularnewline
22 & -0.213042 & -1.6639 & 0.05063 \tabularnewline
23 & -0.119003 & -0.9294 & 0.178161 \tabularnewline
24 & -0.031214 & -0.2438 & 0.404105 \tabularnewline
25 & -0.0653 & -0.51 & 0.305942 \tabularnewline
26 & -0.092956 & -0.726 & 0.235306 \tabularnewline
27 & -0.022761 & -0.1778 & 0.429745 \tabularnewline
28 & 0.046142 & 0.3604 & 0.359905 \tabularnewline
29 & 0.044201 & 0.3452 & 0.365559 \tabularnewline
30 & 0.083753 & 0.6541 & 0.257742 \tabularnewline
31 & 0.084169 & 0.6574 & 0.256705 \tabularnewline
32 & 0.046425 & 0.3626 & 0.359082 \tabularnewline
33 & 0.063695 & 0.4975 & 0.310321 \tabularnewline
34 & 0.057646 & 0.4502 & 0.32707 \tabularnewline
35 & 0.039118 & 0.3055 & 0.380504 \tabularnewline
36 & 0.105869 & 0.8269 & 0.205769 \tabularnewline
\hline
\end{tabular}
%Source: https://freestatistics.org/blog/index.php?pk=115306&T=1

[TABLE]
[ROW][C]Autocorrelation Function[/C][/ROW]
[ROW][C]Time lag k[/C][C]ACF(k)[/C][C]T-STAT[/C][C]P-value[/C][/ROW]
[ROW][C]1[/C][C]0.620724[/C][C]4.848[/C][C]4e-06[/C][/ROW]
[ROW][C]2[/C][C]0.506243[/C][C]3.9539[/C][C]0.000101[/C][/ROW]
[ROW][C]3[/C][C]0.587014[/C][C]4.5847[/C][C]1.2e-05[/C][/ROW]
[ROW][C]4[/C][C]0.423769[/C][C]3.3097[/C][C]0.000785[/C][/ROW]
[ROW][C]5[/C][C]0.314326[/C][C]2.455[/C][C]0.008478[/C][/ROW]
[ROW][C]6[/C][C]0.326615[/C][C]2.5509[/C][C]0.006634[/C][/ROW]
[ROW][C]7[/C][C]0.091685[/C][C]0.7161[/C][C]0.238335[/C][/ROW]
[ROW][C]8[/C][C]-0.002633[/C][C]-0.0206[/C][C]0.49183[/C][/ROW]
[ROW][C]9[/C][C]-0.08431[/C][C]-0.6585[/C][C]0.256354[/C][/ROW]
[ROW][C]10[/C][C]-0.239815[/C][C]-1.873[/C][C]0.03293[/C][/ROW]
[ROW][C]11[/C][C]-0.257652[/C][C]-2.0123[/C][C]0.024303[/C][/ROW]
[ROW][C]12[/C][C]-0.159252[/C][C]-1.2438[/C][C]0.109167[/C][/ROW]
[ROW][C]13[/C][C]-0.372731[/C][C]-2.9111[/C][C]0.002511[/C][/ROW]
[ROW][C]14[/C][C]-0.424272[/C][C]-3.3137[/C][C]0.000776[/C][/ROW]
[ROW][C]15[/C][C]-0.370218[/C][C]-2.8915[/C][C]0.002653[/C][/ROW]
[ROW][C]16[/C][C]-0.37039[/C][C]-2.8928[/C][C]0.002643[/C][/ROW]
[ROW][C]17[/C][C]-0.366432[/C][C]-2.8619[/C][C]0.002881[/C][/ROW]
[ROW][C]18[/C][C]-0.283327[/C][C]-2.2129[/C][C]0.01533[/C][/ROW]
[ROW][C]19[/C][C]-0.287726[/C][C]-2.2472[/C][C]0.014128[/C][/ROW]
[ROW][C]20[/C][C]-0.250756[/C][C]-1.9585[/C][C]0.027376[/C][/ROW]
[ROW][C]21[/C][C]-0.261512[/C][C]-2.0425[/C][C]0.022717[/C][/ROW]
[ROW][C]22[/C][C]-0.213042[/C][C]-1.6639[/C][C]0.05063[/C][/ROW]
[ROW][C]23[/C][C]-0.119003[/C][C]-0.9294[/C][C]0.178161[/C][/ROW]
[ROW][C]24[/C][C]-0.031214[/C][C]-0.2438[/C][C]0.404105[/C][/ROW]
[ROW][C]25[/C][C]-0.0653[/C][C]-0.51[/C][C]0.305942[/C][/ROW]
[ROW][C]26[/C][C]-0.092956[/C][C]-0.726[/C][C]0.235306[/C][/ROW]
[ROW][C]27[/C][C]-0.022761[/C][C]-0.1778[/C][C]0.429745[/C][/ROW]
[ROW][C]28[/C][C]0.046142[/C][C]0.3604[/C][C]0.359905[/C][/ROW]
[ROW][C]29[/C][C]0.044201[/C][C]0.3452[/C][C]0.365559[/C][/ROW]
[ROW][C]30[/C][C]0.083753[/C][C]0.6541[/C][C]0.257742[/C][/ROW]
[ROW][C]31[/C][C]0.084169[/C][C]0.6574[/C][C]0.256705[/C][/ROW]
[ROW][C]32[/C][C]0.046425[/C][C]0.3626[/C][C]0.359082[/C][/ROW]
[ROW][C]33[/C][C]0.063695[/C][C]0.4975[/C][C]0.310321[/C][/ROW]
[ROW][C]34[/C][C]0.057646[/C][C]0.4502[/C][C]0.32707[/C][/ROW]
[ROW][C]35[/C][C]0.039118[/C][C]0.3055[/C][C]0.380504[/C][/ROW]
[ROW][C]36[/C][C]0.105869[/C][C]0.8269[/C][C]0.205769[/C][/ROW]
[/TABLE]
Source: https://freestatistics.org/blog/index.php?pk=115306&T=1

Globally Unique Identifier (entire table): ba.freestatistics.org/blog/index.php?pk=115306&T=1

As an alternative you can also use a QR Code:  

The GUIDs for individual cells are displayed in the table below:

Autocorrelation Function
Time lag kACF(k)T-STATP-value
10.6207244.8484e-06
20.5062433.95390.000101
30.5870144.58471.2e-05
40.4237693.30970.000785
50.3143262.4550.008478
60.3266152.55090.006634
70.0916850.71610.238335
8-0.002633-0.02060.49183
9-0.08431-0.65850.256354
10-0.239815-1.8730.03293
11-0.257652-2.01230.024303
12-0.159252-1.24380.109167
13-0.372731-2.91110.002511
14-0.424272-3.31370.000776
15-0.370218-2.89150.002653
16-0.37039-2.89280.002643
17-0.366432-2.86190.002881
18-0.283327-2.21290.01533
19-0.287726-2.24720.014128
20-0.250756-1.95850.027376
21-0.261512-2.04250.022717
22-0.213042-1.66390.05063
23-0.119003-0.92940.178161
24-0.031214-0.24380.404105
25-0.0653-0.510.305942
26-0.092956-0.7260.235306
27-0.022761-0.17780.429745
280.0461420.36040.359905
290.0442010.34520.365559
300.0837530.65410.257742
310.0841690.65740.256705
320.0464250.36260.359082
330.0636950.49750.310321
340.0576460.45020.32707
350.0391180.30550.380504
360.1058690.82690.205769


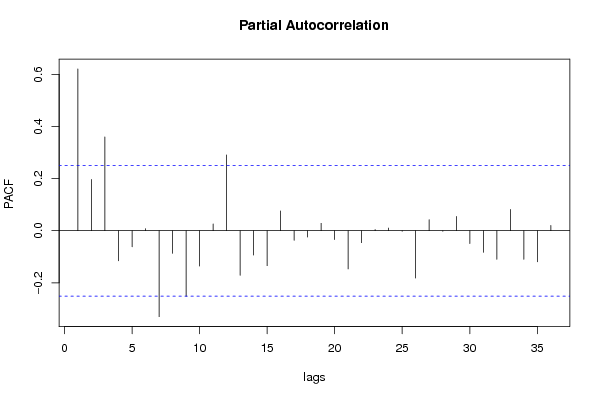
Partial Autocorrelation Function
Time lag kPACF(k)T-STATP-value
10.6207244.8484e-06
20.1967541.53670.064769
30.3595742.80840.00334
4-0.115497-0.90210.185286
5-0.061812-0.48280.315494
60.0073360.05730.477247
7-0.329946-2.5770.006201
8-0.086374-0.67460.251239
9-0.251456-1.96390.02705
10-0.135473-1.05810.147096
110.0256660.20050.420894
120.2909422.27230.013302
13-0.170803-1.3340.093579
14-0.093292-0.72860.234507
15-0.134192-1.04810.14937
160.0758770.59260.277815
17-0.036537-0.28540.388165
18-0.024422-0.19070.424682
190.0280890.21940.413543
20-0.034161-0.26680.395259
21-0.146624-1.14520.128306
22-0.045873-0.35830.360685
230.0041170.03220.487227
240.010030.07830.468909
25-0.001939-0.01510.493984
26-0.182016-1.42160.080119
270.0417090.32580.372862
28-0.002403-0.01880.492544
290.0544640.42540.336028
30-0.049455-0.38630.350324
31-0.082709-0.6460.260357
32-0.109933-0.85860.196961
330.0812760.63480.263972
34-0.109802-0.85760.19724
35-0.119375-0.93230.177417
360.0197130.1540.439073

\begin{tabular}{lllllllll}
\hline
Partial Autocorrelation Function \tabularnewline
Time lag k & PACF(k) & T-STAT & P-value \tabularnewline
1 & 0.620724 & 4.848 & 4e-06 \tabularnewline
2 & 0.196754 & 1.5367 & 0.064769 \tabularnewline
3 & 0.359574 & 2.8084 & 0.00334 \tabularnewline
4 & -0.115497 & -0.9021 & 0.185286 \tabularnewline
5 & -0.061812 & -0.4828 & 0.315494 \tabularnewline
6 & 0.007336 & 0.0573 & 0.477247 \tabularnewline
7 & -0.329946 & -2.577 & 0.006201 \tabularnewline
8 & -0.086374 & -0.6746 & 0.251239 \tabularnewline
9 & -0.251456 & -1.9639 & 0.02705 \tabularnewline
10 & -0.135473 & -1.0581 & 0.147096 \tabularnewline
11 & 0.025666 & 0.2005 & 0.420894 \tabularnewline
12 & 0.290942 & 2.2723 & 0.013302 \tabularnewline
13 & -0.170803 & -1.334 & 0.093579 \tabularnewline
14 & -0.093292 & -0.7286 & 0.234507 \tabularnewline
15 & -0.134192 & -1.0481 & 0.14937 \tabularnewline
16 & 0.075877 & 0.5926 & 0.277815 \tabularnewline
17 & -0.036537 & -0.2854 & 0.388165 \tabularnewline
18 & -0.024422 & -0.1907 & 0.424682 \tabularnewline
19 & 0.028089 & 0.2194 & 0.413543 \tabularnewline
20 & -0.034161 & -0.2668 & 0.395259 \tabularnewline
21 & -0.146624 & -1.1452 & 0.128306 \tabularnewline
22 & -0.045873 & -0.3583 & 0.360685 \tabularnewline
23 & 0.004117 & 0.0322 & 0.487227 \tabularnewline
24 & 0.01003 & 0.0783 & 0.468909 \tabularnewline
25 & -0.001939 & -0.0151 & 0.493984 \tabularnewline
26 & -0.182016 & -1.4216 & 0.080119 \tabularnewline
27 & 0.041709 & 0.3258 & 0.372862 \tabularnewline
28 & -0.002403 & -0.0188 & 0.492544 \tabularnewline
29 & 0.054464 & 0.4254 & 0.336028 \tabularnewline
30 & -0.049455 & -0.3863 & 0.350324 \tabularnewline
31 & -0.082709 & -0.646 & 0.260357 \tabularnewline
32 & -0.109933 & -0.8586 & 0.196961 \tabularnewline
33 & 0.081276 & 0.6348 & 0.263972 \tabularnewline
34 & -0.109802 & -0.8576 & 0.19724 \tabularnewline
35 & -0.119375 & -0.9323 & 0.177417 \tabularnewline
36 & 0.019713 & 0.154 & 0.439073 \tabularnewline
\hline
\end{tabular}
%Source: https://freestatistics.org/blog/index.php?pk=115306&T=2

[TABLE]
[ROW][C]Partial Autocorrelation Function[/C][/ROW]
[ROW][C]Time lag k[/C][C]PACF(k)[/C][C]T-STAT[/C][C]P-value[/C][/ROW]
[ROW][C]1[/C][C]0.620724[/C][C]4.848[/C][C]4e-06[/C][/ROW]
[ROW][C]2[/C][C]0.196754[/C][C]1.5367[/C][C]0.064769[/C][/ROW]
[ROW][C]3[/C][C]0.359574[/C][C]2.8084[/C][C]0.00334[/C][/ROW]
[ROW][C]4[/C][C]-0.115497[/C][C]-0.9021[/C][C]0.185286[/C][/ROW]
[ROW][C]5[/C][C]-0.061812[/C][C]-0.4828[/C][C]0.315494[/C][/ROW]
[ROW][C]6[/C][C]0.007336[/C][C]0.0573[/C][C]0.477247[/C][/ROW]
[ROW][C]7[/C][C]-0.329946[/C][C]-2.577[/C][C]0.006201[/C][/ROW]
[ROW][C]8[/C][C]-0.086374[/C][C]-0.6746[/C][C]0.251239[/C][/ROW]
[ROW][C]9[/C][C]-0.251456[/C][C]-1.9639[/C][C]0.02705[/C][/ROW]
[ROW][C]10[/C][C]-0.135473[/C][C]-1.0581[/C][C]0.147096[/C][/ROW]
[ROW][C]11[/C][C]0.025666[/C][C]0.2005[/C][C]0.420894[/C][/ROW]
[ROW][C]12[/C][C]0.290942[/C][C]2.2723[/C][C]0.013302[/C][/ROW]
[ROW][C]13[/C][C]-0.170803[/C][C]-1.334[/C][C]0.093579[/C][/ROW]
[ROW][C]14[/C][C]-0.093292[/C][C]-0.7286[/C][C]0.234507[/C][/ROW]
[ROW][C]15[/C][C]-0.134192[/C][C]-1.0481[/C][C]0.14937[/C][/ROW]
[ROW][C]16[/C][C]0.075877[/C][C]0.5926[/C][C]0.277815[/C][/ROW]
[ROW][C]17[/C][C]-0.036537[/C][C]-0.2854[/C][C]0.388165[/C][/ROW]
[ROW][C]18[/C][C]-0.024422[/C][C]-0.1907[/C][C]0.424682[/C][/ROW]
[ROW][C]19[/C][C]0.028089[/C][C]0.2194[/C][C]0.413543[/C][/ROW]
[ROW][C]20[/C][C]-0.034161[/C][C]-0.2668[/C][C]0.395259[/C][/ROW]
[ROW][C]21[/C][C]-0.146624[/C][C]-1.1452[/C][C]0.128306[/C][/ROW]
[ROW][C]22[/C][C]-0.045873[/C][C]-0.3583[/C][C]0.360685[/C][/ROW]
[ROW][C]23[/C][C]0.004117[/C][C]0.0322[/C][C]0.487227[/C][/ROW]
[ROW][C]24[/C][C]0.01003[/C][C]0.0783[/C][C]0.468909[/C][/ROW]
[ROW][C]25[/C][C]-0.001939[/C][C]-0.0151[/C][C]0.493984[/C][/ROW]
[ROW][C]26[/C][C]-0.182016[/C][C]-1.4216[/C][C]0.080119[/C][/ROW]
[ROW][C]27[/C][C]0.041709[/C][C]0.3258[/C][C]0.372862[/C][/ROW]
[ROW][C]28[/C][C]-0.002403[/C][C]-0.0188[/C][C]0.492544[/C][/ROW]
[ROW][C]29[/C][C]0.054464[/C][C]0.4254[/C][C]0.336028[/C][/ROW]
[ROW][C]30[/C][C]-0.049455[/C][C]-0.3863[/C][C]0.350324[/C][/ROW]
[ROW][C]31[/C][C]-0.082709[/C][C]-0.646[/C][C]0.260357[/C][/ROW]
[ROW][C]32[/C][C]-0.109933[/C][C]-0.8586[/C][C]0.196961[/C][/ROW]
[ROW][C]33[/C][C]0.081276[/C][C]0.6348[/C][C]0.263972[/C][/ROW]
[ROW][C]34[/C][C]-0.109802[/C][C]-0.8576[/C][C]0.19724[/C][/ROW]
[ROW][C]35[/C][C]-0.119375[/C][C]-0.9323[/C][C]0.177417[/C][/ROW]
[ROW][C]36[/C][C]0.019713[/C][C]0.154[/C][C]0.439073[/C][/ROW]
[/TABLE]
Source: https://freestatistics.org/blog/index.php?pk=115306&T=2

Globally Unique Identifier (entire table): ba.freestatistics.org/blog/index.php?pk=115306&T=2

As an alternative you can also use a QR Code:  

The GUIDs for individual cells are displayed in the table below:

Partial Autocorrelation Function
Time lag kPACF(k)T-STATP-value
10.6207244.8484e-06
20.1967541.53670.064769
30.3595742.80840.00334
4-0.115497-0.90210.185286
5-0.061812-0.48280.315494
60.0073360.05730.477247
7-0.329946-2.5770.006201
8-0.086374-0.67460.251239
9-0.251456-1.96390.02705
10-0.135473-1.05810.147096
110.0256660.20050.420894
120.2909422.27230.013302
13-0.170803-1.3340.093579
14-0.093292-0.72860.234507
15-0.134192-1.04810.14937
160.0758770.59260.277815
17-0.036537-0.28540.388165
18-0.024422-0.19070.424682
190.0280890.21940.413543
20-0.034161-0.26680.395259
21-0.146624-1.14520.128306
22-0.045873-0.35830.360685
230.0041170.03220.487227
240.010030.07830.468909
25-0.001939-0.01510.493984
26-0.182016-1.42160.080119
270.0417090.32580.372862
28-0.002403-0.01880.492544
290.0544640.42540.336028
30-0.049455-0.38630.350324
31-0.082709-0.6460.260357
32-0.109933-0.85860.196961
330.0812760.63480.263972
34-0.109802-0.85760.19724
35-0.119375-0.93230.177417
360.0197130.1540.439073


Parameters (Session):
par1 = 36 ; par2 = 1 ; par3 = 0 ; par4 = 0 ; par5 = 12 ; par6 = MA ; par7 = 0.95 ;
Parameters (R input):
par1 = 36 ; par2 = 1 ; par3 = 0 ; par4 = 0 ; par5 = 12 ; par6 = MA ; par7 = 0.95 ; par8 = ;
R code (references can be found in the software module):
if (par1 == 'Default') {
par1 = 10*log10(length(x))
} else {
par1 <- as.numeric(par1)
}
par2 <- as.numeric(par2)
par3 <- as.numeric(par3)
par4 <- as.numeric(par4)
par5 <- as.numeric(par5)
if (par6 == 'White Noise') par6 <- 'white' else par6 <- 'ma'
par7 <- as.numeric(par7)
if (par2 == 0) {
x <- log(x)
} else {
x <- (x ^ par2 - 1) / par2
}
if (par3 > 0) x <- diff(x,lag=1,difference=par3)
if (par4 > 0) x <- diff(x,lag=par5,difference=par4)
bitmap(file='pic1.png')
racf <- acf(x, par1, main='Autocorrelation', xlab='time lag', ylab='ACF', ci.type=par6, ci=par7, sub=paste('(lambda=',par2,', d=',par3,', D=',par4,', CI=', par7, ', CI type=',par6,')',sep=''))
dev.off()
bitmap(file='pic2.png')
rpacf <- pacf(x,par1,main='Partial Autocorrelation',xlab='lags',ylab='PACF')
dev.off()
(myacf <- c(racf$acf))
(mypacf <- c(rpacf$acf))
lengthx <- length(x)
sqrtn <- sqrt(lengthx)
load(file='createtable')
a<-table.start()
a<-table.row.start(a)
a<-table.element(a,'Autocorrelation Function',4,TRUE)
a<-table.row.end(a)
a<-table.row.start(a)
a<-table.element(a,'Time lag k',header=TRUE)
a<-table.element(a,hyperlink('basics.htm','ACF(k)','click here for more information about the Autocorrelation Function'),header=TRUE)
a<-table.element(a,'T-STAT',header=TRUE)
a<-table.element(a,'P-value',header=TRUE)
a<-table.row.end(a)
for (i in 2:(par1+1)) {
a<-table.row.start(a)
a<-table.element(a,i-1,header=TRUE)
a<-table.element(a,round(myacf[i],6))
mytstat <- myacf[i]*sqrtn
a<-table.element(a,round(mytstat,4))
a<-table.element(a,round(1-pt(abs(mytstat),lengthx),6))
a<-table.row.end(a)
}
a<-table.end(a)
table.save(a,file='mytable.tab')
a<-table.start()
a<-table.row.start(a)
a<-table.element(a,'Partial Autocorrelation Function',4,TRUE)
a<-table.row.end(a)
a<-table.row.start(a)
a<-table.element(a,'Time lag k',header=TRUE)
a<-table.element(a,hyperlink('basics.htm','PACF(k)','click here for more information about the Partial Autocorrelation Function'),header=TRUE)
a<-table.element(a,'T-STAT',header=TRUE)
a<-table.element(a,'P-value',header=TRUE)
a<-table.row.end(a)
for (i in 1:par1) {
a<-table.row.start(a)
a<-table.element(a,i,header=TRUE)
a<-table.element(a,round(mypacf[i],6))
mytstat <- mypacf[i]*sqrtn
a<-table.element(a,round(mytstat,4))
a<-table.element(a,round(1-pt(abs(mytstat),lengthx),6))
a<-table.row.end(a)
}
a<-table.end(a)
table.save(a,file='mytable1.tab')