Free Statistics

of Irreproducible Research!

Author's title

Author*The author of this computation has been verified*
R Software Modulerwasp_regression_trees.wasp
Title produced by softwareRecursive Partitioning (Regression Trees)
Date of computationFri, 24 Dec 2010 21:12:10 +0000
Cite this page as followsStatistical Computations at FreeStatistics.org, Office for Research Development and Education, URL https://freestatistics.org/blog/index.php?v=date/2010/Dec/24/t1293225062bttkkkrhivq8ubz.htm/, Retrieved Tue, 30 Apr 2024 01:09:04 +0000
Statistical Computations at FreeStatistics.org, Office for Research Development and Education, URL https://freestatistics.org/blog/index.php?pk=115287, Retrieved Tue, 30 Apr 2024 01:09:04 +0000
QR Codes:

Original text written by user:
IsPrivate?No (this computation is public)
User-defined keywords
Estimated Impact127
Family? (F = Feedback message, R = changed R code, M = changed R Module, P = changed Parameters, D = changed Data)
-     [Recursive Partitioning (Regression Trees)] [] [2010-12-24 11:01:47] [1c63f3c303537b65dfa698074d619a3e]
- RMPD    [Recursive Partitioning (Regression Trees)] [] [2010-12-24 21:12:10] [6d519594e32ce09ffe6000a98c6f6a83] [Current]
Feedback Forum

Post a new message
Dataseries X:
9.1	4.5	1.0	-1.0	1989.3
9.0	4.3	1.0	3.0	2097.8
9.0	4.3	1.3	2.0	2154.9
8.9	4.2	1.1	3.0	2152.2
8.8	4.0	0.8	5.0	2250.3
8.7	3.8	0.7	5.0	2346.9
8.5	4.1	0.7	3.0	2525.6
8.3	4.2	0.9	2.0	2409.4
8.1	4.0	1.3	1.0	2394.4
7.9	4.3	1.4	-4.0	2401.3
7.8	4.7	1.6	1.0	2354.3
7.6	5.0	2.1	1.0	2450.4
7.4	5.1	0.3	6.0	2504.7
7.2	5.4	2.1	3.0	2661.4
7.0	5.4	2.5	2.0	2880.4
7.0	5.4	2.3	2.0	3064.4
6.8	5.5	2.4	2.0	3141.1
6.8	5.8	3.0	-8.0	3327.7
6.7	5.7	1.7	0.0	3565.0
6.8	5.5	3.5	-2.0	3403.1
6.7	5.6	4.0	3.0	3149.9
6.7	5.6	3.7	5.0	3006.8
6.7	5.5	3.7	8.0	3230.7
6.5	5.5	3.0	8.0	3361.1
6.3	5.7	2.7	9.0	3484.7
6.3	5.6	2.5	11.0	3411.1
6.3	5.6	2.2	13.0	3288.2
6.5	5.4	2.9	12.0	3280.4
6.6	5.2	3.1	13.0	3174.0
6.5	5.1	3.0	15.0	3165.3
6.3	5.1	2.8	13.0	3092.7
6.3	5.0	2.5	16.0	3053.1
6.5	5.3	1.9	10.0	3182.0
7.0	5.4	1.9	14.0	2999.9
7.1	5.3	1.8	14.0	3249.6
7.3	5.1	2.0	15.0	3210.5
7.3	5.0	2.6	13.0	3030.3
7.4	5.0	2.5	8.0	2803.5
7.4	4.6	2.5	7.0	2767.6
7.3	4.8	1.6	3.0	2882.6
7.4	5.1	1.4	3.0	2863.4
7.5	5.1	0.8	4.0	2897.1
7.7	5.1	1.1	4.0	3012.6
7.7	5.4	1.3	0.0	3143.0
7.7	5.3	1.2	-4.0	3032.9
7.7	5.3	1.3	-14.0	3045.8
7.7	5.1	1.1	-18.0	3110.5
7.8	4.9	1.3	-8.0	3013.2
8.0	4.7	1.2	-1.0	2987.1
8.1	4.4	1.6	1.0	2995.6
8.1	4.6	1.7	2.0	2833.2
8.2	4.5	1.5	0.0	2849.0
8.2	4.2	0.9	1.0	2794.8
8.2	4.0	1.5	0.0	2845.3
8.1	3.9	1.4	-1.0	2915.0
8.1	4.1	1.6	-3.0	2892.6
8.2	4.1	1.7	-3.0	2604.4
8.3	3.7	1.4	-3.0	2641.7
8.3	3.8	1.8	-4.0	2659.8
8.4	4.1	1.7	-8.0	2638.5
8.5	4.1	1.4	-9.0	2720.3
8.5	4.0	1.2	-13.0	2745.9
8.4	4.3	1.0	-18.0	2735.7
8.0	4.4	1.7	-11.0	2811.7
7.9	4.2	2.4	-9.0	2799.4
8.1	4.2	2.0	-10.0	2555.3
8.5	4.0	2.1	-13.0	2305.0
8.8	4.0	2.0	-11.0	2215.0
8.8	4.3	1.8	-5.0	2065.8
8.6	4.4	2.7	-15.0	1940.5
8.3	4.4	2.3	-6.0	2042.0
8.3	4.3	1.9	-6.0	1995.4
8.3	4.1	2.0	-3.0	1946.8
8.4	4.1	2.3	-1.0	1765.9
8.4	3.9	2.8	-3.0	1635.3
8.5	3.8	2.4	-4.0	1833.4
8.6	3.7	2.3	-6.0	1910.4
8.6	3.5	2.7	0.0	1959.7
8.6	3.7	2.7	-4.0	1969.6
8.6	3.7	2.9	-2.0	2061.4
8.6	3.5	3.0	-2.0	2093.5
8.5	3.3	2.2	-6.0	2120.9
8.4	3.2	2.3	-7.0	2174.6
8.4	3.3	2.8	-6.0	2196.7
8.4	3.1	2.8	-6.0	2350.4
8.5	3.2	2.8	-3.0	2440.3
8.5	3.4	2.2	-2.0	2408.6
8.6	3.5	2.6	-5.0	2472.8
8.6	3.3	2.8	-11.0	2407.6
8.4	3.5	2.5	-11.0	2454.6
8.2	3.5	2.4	-11.0	2448.1
8.0	3.8	2.3	-10.0	2497.8
8.0	4.0	1.9	-14.0	2645.6
8.0	4.0	1.7	-8.0	2756.8
8.0	4.1	2.0	-9.0	2849.3
7.9	4.0	2.1	-5.0	2921.4
7.9	3.8	1.7	-1.0	2981.9
7.8	3.7	1.8	-2.0	3080.6
7.8	3.8	1.8	-5.0	3106.2
8.0	3.7	1.8	-4.0	3119.3
7.8	4.0	1.3	-6.0	3061.3
7.4	4.2	1.3	-2.0	3097.3
7.2	4.0	1.3	-2.0	3161.7
7.0	4.1	1.2	-2.0	3257.2
7.0	4.2	1.4	-2.0	3277.0
7.2	4.5	2.2	2.0	3295.3
7.2	4.6	2.9	1.0	3364.0
7.2	4.5	3.1	-8.0	3494.2
7.0	4.5	3.5	-1.0	3667.0
6.9	4.5	3.6	1.0	3813.1
6.8	4.4	4.4	-1.0	3918.0
6.8	4.3	4.1	2.0	3895.5
6.8	4.5	5.1	2.0	3801.1
6.9	4.1	5.8	1.0	3570.1
7.2	4.1	5.9	-1.0	3701.6
7.2	4.3	5.4	-2.0	3862.3
7.2	4.4	5.5	-2.0	3970.1
7.1	4.7	4.8	-1.0	4138.5
7.2	5.0	3.2	-8.0	4199.8
7.3	4.7	2.7	-4.0	4290.9
7.5	4.5	2.1	-6.0	4443.9
7.6	4.5	1.9	-3.0	4502.6
7.7	4.5	0.6	-3.0	4357.0
7.7	5.5	0.7	-7.0	4591.3
7.7	4.5	-0.2	-9.0	4697.0
7.8	4.4	-1.0	-11.0	4621.4
8.0	4.2	-1.7	-13.0	4562.8
8.1	3.9	-0.7	-11.0	4202.5
8.1	3.9	-1.0	-9.0	4296.5
8.0	4.2	-0.9	-17.0	4435.2
8.1	4.0	0.0	-22.0	4105.2
8.2	3.8	0.3	-25.0	4116.7
8.3	3.7	0.8	-20.0	3844.5
8.4	3.7	0.8	-24.0	3721.0
8.4	3.7	1.9	-24.0	3674.4
8.4	3.7	2.1	-22.0	3857.6
8.5	3.7	2.5	-19.0	3801.1
8.5	3.8	2.7	-18.0	3504.4
8.6	3.7	2.4	-17.0	3032.6
8.6	3.5	2.4	-11.0	3047.0
8.5	3.5	2.9	-11.0	2962.3
8.5	3.1	3.1	-12.0	2197.8


Summary of computational transaction
Raw Inputview raw input (R code)
Raw Outputview raw output of R engine
Computing time5 seconds
R Server'Gwilym Jenkins' @ 72.249.127.135

\begin{tabular}{lllllllll}
\hline
Summary of computational transaction \tabularnewline
Raw Input & view raw input (R code)  \tabularnewline
Raw Output & view raw output of R engine  \tabularnewline
Computing time & 5 seconds \tabularnewline
R Server & 'Gwilym Jenkins' @ 72.249.127.135 \tabularnewline
\hline
\end{tabular}
%Source: https://freestatistics.org/blog/index.php?pk=115287&T=0

[TABLE]
[ROW][C]Summary of computational transaction[/C][/ROW]
[ROW][C]Raw Input[/C][C]view raw input (R code) [/C][/ROW]
[ROW][C]Raw Output[/C][C]view raw output of R engine [/C][/ROW]
[ROW][C]Computing time[/C][C]5 seconds[/C][/ROW]
[ROW][C]R Server[/C][C]'Gwilym Jenkins' @ 72.249.127.135[/C][/ROW]
[/TABLE]
Source: https://freestatistics.org/blog/index.php?pk=115287&T=0

Globally Unique Identifier (entire table): ba.freestatistics.org/blog/index.php?pk=115287&T=0

As an alternative you can also use a QR Code:  

The GUIDs for individual cells are displayed in the table below:

Summary of computational transaction
Raw Inputview raw input (R code)
Raw Outputview raw output of R engine
Computing time5 seconds
R Server'Gwilym Jenkins' @ 72.249.127.135


Model Performance
#Complexitysplitrelative errorCV errorCV S.D.
10.463011.010.089
20.11610.5370.5810.083
30.10920.420.5720.088
40.09330.3110.5050.083
50.02940.2180.3140.055
60.02250.1890.2910.048
70.01160.1670.2430.045
80.0170.1560.2430.045

\begin{tabular}{lllllllll}
\hline
Model Performance \tabularnewline
# & Complexity & split & relative error & CV error & CV S.D. \tabularnewline
1 & 0.463 & 0 & 1 & 1.01 & 0.089 \tabularnewline
2 & 0.116 & 1 & 0.537 & 0.581 & 0.083 \tabularnewline
3 & 0.109 & 2 & 0.42 & 0.572 & 0.088 \tabularnewline
4 & 0.093 & 3 & 0.311 & 0.505 & 0.083 \tabularnewline
5 & 0.029 & 4 & 0.218 & 0.314 & 0.055 \tabularnewline
6 & 0.022 & 5 & 0.189 & 0.291 & 0.048 \tabularnewline
7 & 0.011 & 6 & 0.167 & 0.243 & 0.045 \tabularnewline
8 & 0.01 & 7 & 0.156 & 0.243 & 0.045 \tabularnewline
\hline
\end{tabular}
%Source: https://freestatistics.org/blog/index.php?pk=115287&T=1

[TABLE]
[ROW][C]Model Performance[/C][/ROW]
[ROW][C]#[/C][C]Complexity[/C][C]split[/C][C]relative error[/C][C]CV error[/C][C]CV S.D.[/C][/ROW]
[ROW][C]1[/C][C]0.463[/C][C]0[/C][C]1[/C][C]1.01[/C][C]0.089[/C][/ROW]
[ROW][C]2[/C][C]0.116[/C][C]1[/C][C]0.537[/C][C]0.581[/C][C]0.083[/C][/ROW]
[ROW][C]3[/C][C]0.109[/C][C]2[/C][C]0.42[/C][C]0.572[/C][C]0.088[/C][/ROW]
[ROW][C]4[/C][C]0.093[/C][C]3[/C][C]0.311[/C][C]0.505[/C][C]0.083[/C][/ROW]
[ROW][C]5[/C][C]0.029[/C][C]4[/C][C]0.218[/C][C]0.314[/C][C]0.055[/C][/ROW]
[ROW][C]6[/C][C]0.022[/C][C]5[/C][C]0.189[/C][C]0.291[/C][C]0.048[/C][/ROW]
[ROW][C]7[/C][C]0.011[/C][C]6[/C][C]0.167[/C][C]0.243[/C][C]0.045[/C][/ROW]
[ROW][C]8[/C][C]0.01[/C][C]7[/C][C]0.156[/C][C]0.243[/C][C]0.045[/C][/ROW]
[/TABLE]
Source: https://freestatistics.org/blog/index.php?pk=115287&T=1

Globally Unique Identifier (entire table): ba.freestatistics.org/blog/index.php?pk=115287&T=1

As an alternative you can also use a QR Code:  

The GUIDs for individual cells are displayed in the table below:

Model Performance
#Complexitysplitrelative errorCV errorCV S.D.
10.463011.010.089
20.11610.5370.5810.083
30.10920.420.5720.088
40.09330.3110.5050.083
50.02940.2180.3140.055
60.02250.1890.2910.048
70.01160.1670.2430.045
80.0170.1560.2430.045


Parameters (Session):
par1 = 1 ; par2 = No ;
Parameters (R input):
par1 = 1 ; par2 = No ;
R code (references can be found in the software module):
library(rpart)
library(partykit)
par1 <- as.numeric(par1)
autoprune <- function ( tree, method='Minimum CV'){
xerr <- tree$cptable[,'xerror']
cpmin.id <- which.min(xerr)
if (method == 'Minimum CV Error plus 1 SD'){
xstd <- tree$cptable[,'xstd']
errt <- xerr[cpmin.id] + xstd[cpmin.id]
cpSE1.min <- which.min( errt < xerr )
mycp <- (tree$cptable[,'CP'])[cpSE1.min]
}
if (method == 'Minimum CV') {
mycp <- (tree$cptable[,'CP'])[cpmin.id]
}
return (mycp)
}
conf.multi.mat <- function(true, new)
{
if ( all( is.na(match( levels(true),levels(new) ) )) )
stop ( 'conflict of vector levels')
multi.t <- list()
for (mylev in levels(true) ) {
true.tmp <- true
new.tmp <- new
left.lev <- levels (true.tmp)[- match(mylev,levels(true) ) ]
levels(true.tmp) <- list ( mylev = mylev, all = left.lev )
levels(new.tmp) <- list ( mylev = mylev, all = left.lev )
curr.t <- conf.mat ( true.tmp , new.tmp )
multi.t[[mylev]] <- curr.t
multi.t[[mylev]]$precision <-
round( curr.t$conf[1,1] / sum( curr.t$conf[1,] ), 2 )
}
return (multi.t)
}
x <- t(y)
k <- length(x[1,])
n <- length(x[,1])
x1 <- cbind(x[,par1], x[,1:k!=par1])
mycolnames <- c(colnames(x)[par1], colnames(x)[1:k!=par1])
colnames(x1) <- mycolnames #colnames(x)[par1]
m <- rpart(as.data.frame(x1))
par2
if (par2 != 'No') {
mincp <- autoprune(m,method=par2)
print(mincp)
m <- prune(m,cp=mincp)
}
m$cptable
bitmap(file='test1.png')
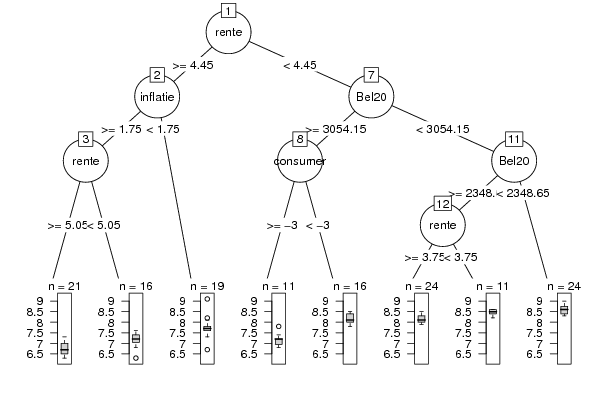
plot(as.party(m),tp_args=list(id=FALSE))
dev.off()
bitmap(file='test2.png')
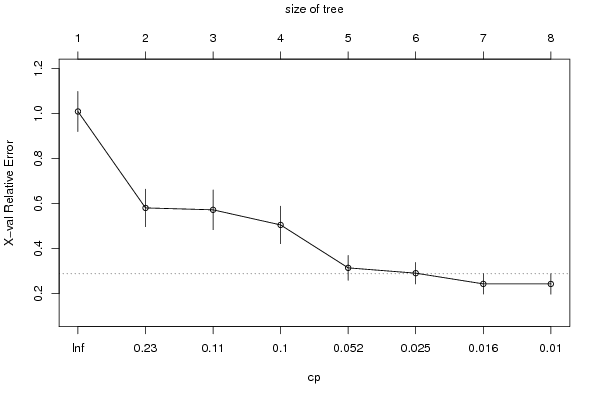
plotcp(m)
dev.off()
cbind(y=m$y,pred=predict(m),res=residuals(m))
myr <- residuals(m)
myp <- predict(m)
bitmap(file='test4.png')
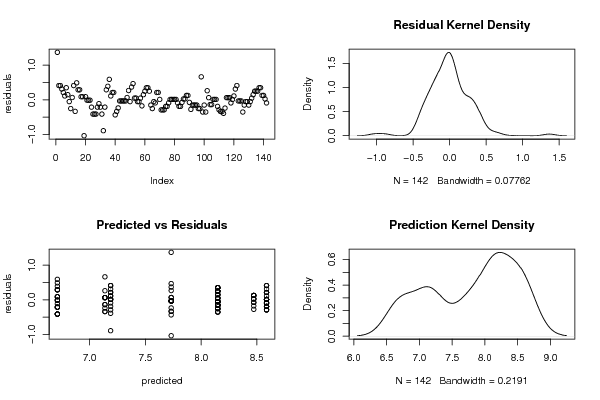
op <- par(mfrow=c(2,2))
plot(myr,ylab='residuals')
plot(density(myr),main='Residual Kernel Density')
plot(myp,myr,xlab='predicted',ylab='residuals',main='Predicted vs Residuals')
plot(density(myp),main='Prediction Kernel Density')
par(op)
dev.off()
load(file='createtable')
a<-table.start()
a<-table.row.start(a)
a<-table.element(a,'Model Performance',6,TRUE)
a<-table.row.end(a)
a<-table.row.start(a)
a<-table.element(a,'#',header=TRUE)
a<-table.element(a,'Complexity',header=TRUE)
a<-table.element(a,'split',header=TRUE)
a<-table.element(a,'relative error',header=TRUE)
a<-table.element(a,'CV error',header=TRUE)
a<-table.element(a,'CV S.D.',header=TRUE)
a<-table.row.end(a)
for (i in 1:length(m$cptable[,1])) {
a<-table.row.start(a)
a<-table.element(a,i,header=TRUE)
a<-table.element(a,round(m$cptable[i,'CP'],3))
a<-table.element(a,m$cptable[i,'nsplit'])
a<-table.element(a,round(m$cptable[i,'rel error'],3))
a<-table.element(a,round(m$cptable[i,'xerror'],3))
a<-table.element(a,round(m$cptable[i,'xstd'],3))
a<-table.row.end(a)
}
a<-table.end(a)
table.save(a,file='mytable.tab')