Free Statistics

of Irreproducible Research!

Author's title

Author*The author of this computation has been verified*
R Software Modulerwasp_regression_trees1.wasp
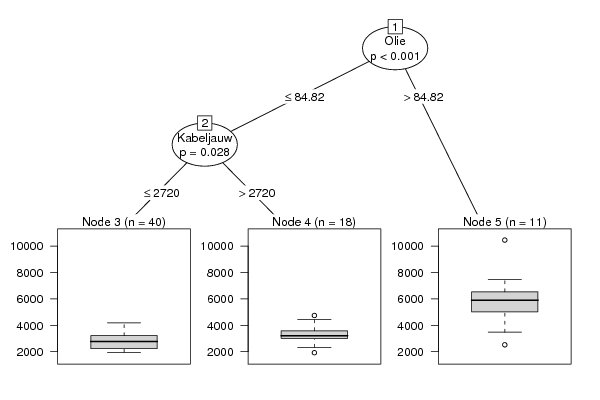
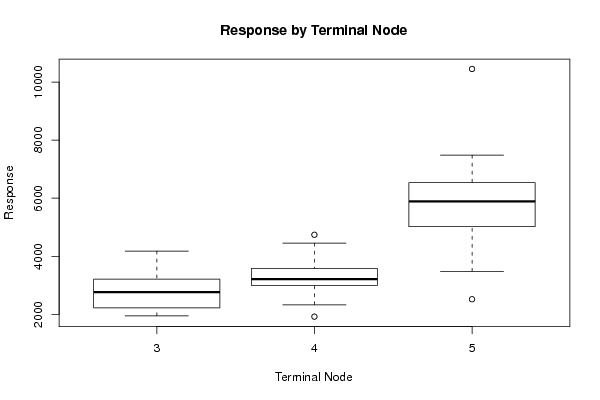
Title produced by softwareRecursive Partitioning (Regression Trees)
Date of computationFri, 24 Dec 2010 17:48:36 +0000
Cite this page as followsStatistical Computations at FreeStatistics.org, Office for Research Development and Education, URL https://freestatistics.org/blog/index.php?v=date/2010/Dec/24/t1293212785efm3zzk8ni2t4q4.htm/, Retrieved Tue, 30 Apr 2024 05:24:26 +0000
Statistical Computations at FreeStatistics.org, Office for Research Development and Education, URL https://freestatistics.org/blog/index.php?pk=115248, Retrieved Tue, 30 Apr 2024 05:24:26 +0000
QR Codes:

Original text written by user:
IsPrivate?No (this computation is public)
User-defined keywords
Estimated Impact93
Family? (F = Feedback message, R = changed R code, M = changed R Module, P = changed Parameters, D = changed Data)
-     [Recursive Partitioning (Regression Trees)] [] [2010-12-05 18:59:57] [b98453cac15ba1066b407e146608df68]
-   PD    [Recursive Partitioning (Regression Trees)] [] [2010-12-24 17:48:36] [7b390cc0228d34e5578246b07143e3df] [Current]
Feedback Forum

Post a new message
Dataseries X:
3010	2590	11290	4700	44,51
2910	2080	11620	4960	45,48
3840	2640	10790	4880	53,1
3580	3000	8380	4090	51,88
3140	2350	9370	3450	48,65
3550	2220	10090	3020	54,35
3250	2540	11130	3070	57,52
2820	2700	10530	3720	63,98
2260	2580	10490	3750	62,91
2060	2420	10570	3910	58,54
2120	2090	11170	4120	55,24
2210	2000	11610	4780	56,86
2190	1860	10920	3070	62,99
2180	1980	11570	4100	60,21
2350	2690	12960	3900	62,06
2440	3040	11190	3020	70,26
2370	2450	11920	3220	69,78
2440	2650	14930	4030	68,56
2610	2710	14520	4210	73,67
3040	3230	12970	4510	73,23
3190	3160	13870	4320	61,96
3120	3040	13250	3890	57,81
3170	2630	12760	7280	58,76
3600	2730	14050	9640	62,47
3420	2830	14660	5680	53,68
3650	2320	15010	6320	57,56
4180	2410	15020	5820	62,05
2960	3080	13090	4890	67,49
2710	2260	13190	3320	67,21
2950	2300	11390	2930	71,05
3030	3600	10110	3530	76,93
3770	3380	8240	3690	70,76
4740	3670	7920	3750	77,17
4450	3040	7700	3330	82,34
5550	2840	7920	4790	92,41
5580	2810	8130	5990	90,93
5890	2980	10510	5290	92,18
7480	2440	10230	5310	94,99
10450	2620	10940	4790	103,64
6360	2270	9230	3630	109,07
6710	2540	10320	2820	122,8
6200	3060	9590	2770	132,32
4490	3730	9980	2820	132,72
3480	3450	9630	3750	113,24
2520	3220	9520	3100	97,23
1920	2980	9150	4350	71,58
2010	2470	9490	4050	52,45
1950	2240	10090	6000	39,95
2240	1970	9570	10630	43,44
2370	1860	8870	3750	43,32
2840	2200	8270	3840	46,54
2700	2000	7530	4200	50,18
2980	1590	10240	2610	57,3
3290	2280	10590	2610	68,61
3300	2830	9440	2530	64,44
3000	3060	10620	3090	72,51
2330	3320	11470	4310	67,65
2190	2680	10680	4190	72,77
1970	2470	11130	3790	76,66
2170	2500	12390	3910	74,46
2830	2170	10920	4890	76,17
3190	2070	10320	4970	73,75
3550	2380	10810	5550	78,83
3240	2480	10280	4730	84,82
3450	2350	11790	4580	75,95
3570	2610	13290	2500	74,76
3230	3410	11740	2630	75,58
3260	3380	11320	4300	77,04
2700	2720	11930	3750	77,84


Summary of computational transaction
Raw Inputview raw input (R code)
Raw Outputview raw output of R engine
Computing time7 seconds
R Server'George Udny Yule' @ 72.249.76.132

\begin{tabular}{lllllllll}
\hline
Summary of computational transaction \tabularnewline
Raw Input & view raw input (R code)  \tabularnewline
Raw Output & view raw output of R engine  \tabularnewline
Computing time & 7 seconds \tabularnewline
R Server & 'George Udny Yule' @ 72.249.76.132 \tabularnewline
\hline
\end{tabular}
%Source: https://freestatistics.org/blog/index.php?pk=115248&T=0

[TABLE]
[ROW][C]Summary of computational transaction[/C][/ROW]
[ROW][C]Raw Input[/C][C]view raw input (R code) [/C][/ROW]
[ROW][C]Raw Output[/C][C]view raw output of R engine [/C][/ROW]
[ROW][C]Computing time[/C][C]7 seconds[/C][/ROW]
[ROW][C]R Server[/C][C]'George Udny Yule' @ 72.249.76.132[/C][/ROW]
[/TABLE]
Source: https://freestatistics.org/blog/index.php?pk=115248&T=0

Globally Unique Identifier (entire table): ba.freestatistics.org/blog/index.php?pk=115248&T=0

As an alternative you can also use a QR Code:  

The GUIDs for individual cells are displayed in the table below:

Summary of computational transaction
Raw Inputview raw input (R code)
Raw Outputview raw output of R engine
Computing time7 seconds
R Server'George Udny Yule' @ 72.249.76.132


Goodness of Fit
Correlation0.751
R-squared0.5639
RMSE967.963

\begin{tabular}{lllllllll}
\hline
Goodness of Fit \tabularnewline
Correlation & 0.751 \tabularnewline
R-squared & 0.5639 \tabularnewline
RMSE & 967.963 \tabularnewline
\hline
\end{tabular}
%Source: https://freestatistics.org/blog/index.php?pk=115248&T=1

[TABLE]
[ROW][C]Goodness of Fit[/C][/ROW]
[ROW][C]Correlation[/C][C]0.751[/C][/ROW]
[ROW][C]R-squared[/C][C]0.5639[/C][/ROW]
[ROW][C]RMSE[/C][C]967.963[/C][/ROW]
[/TABLE]
Source: https://freestatistics.org/blog/index.php?pk=115248&T=1

Globally Unique Identifier (entire table): ba.freestatistics.org/blog/index.php?pk=115248&T=1

As an alternative you can also use a QR Code:  

The GUIDs for individual cells are displayed in the table below:

Goodness of Fit
Correlation0.751
R-squared0.5639
RMSE967.963


Actuals, Predictions, and Residuals
#ActualsForecastsResiduals
130102780.25229.75
229102780.25129.75
338402780.251059.75
435803243.33333333333336.666666666667
531402780.25359.75
635502780.25769.75
732502780.25469.75
828202780.2539.75
922602780.25-520.25
1020602780.25-720.25
1121202780.25-660.25
1222102780.25-570.25
1321902780.25-590.25
1421802780.25-600.25
1523502780.25-430.25
1624403243.33333333333-803.333333333333
1723702780.25-410.25
1824402780.25-340.25
1926102780.25-170.25
2030403243.33333333333-203.333333333333
2131903243.33333333333-53.3333333333335
2231203243.33333333333-123.333333333333
2331702780.25389.75
2436003243.33333333333356.666666666667
2534203243.33333333333176.666666666667
2636502780.25869.75
2741802780.251399.75
2829603243.33333333333-283.333333333333
2927102780.25-70.25
3029502780.25169.75
3130303243.33333333333-213.333333333333
3237703243.33333333333526.666666666667
3347403243.333333333331496.66666666667
3444503243.333333333331206.66666666667
3555505882.72727272727-332.727272727273
3655805882.72727272727-302.727272727273
3758905882.727272727277.27272727272702
3874805882.727272727271597.27272727273
39104505882.727272727274567.27272727273
4063605882.72727272727477.272727272727
4167105882.72727272727827.272727272727
4262005882.72727272727317.272727272727
4344905882.72727272727-1392.72727272727
4434805882.72727272727-2402.72727272727
4525205882.72727272727-3362.72727272727
4619203243.33333333333-1323.33333333333
4720102780.25-770.25
4819502780.25-830.25
4922402780.25-540.25
5023702780.25-410.25
5128402780.2559.75
5227002780.25-80.25
5329802780.25199.75
5432902780.25509.75
5533003243.3333333333356.6666666666665
5630003243.33333333333-243.333333333333
5723303243.33333333333-913.333333333333
5821902780.25-590.25
5919702780.25-810.25
6021702780.25-610.25
6128302780.2549.75
6231902780.25409.75
6335502780.25769.75
6432402780.25459.75
6534502780.25669.75
6635702780.25789.75
6732303243.33333333333-13.3333333333335
6832603243.3333333333316.6666666666665
6927002780.25-80.25

\begin{tabular}{lllllllll}
\hline
Actuals, Predictions, and Residuals \tabularnewline
# & Actuals & Forecasts & Residuals \tabularnewline
1 & 3010 & 2780.25 & 229.75 \tabularnewline
2 & 2910 & 2780.25 & 129.75 \tabularnewline
3 & 3840 & 2780.25 & 1059.75 \tabularnewline
4 & 3580 & 3243.33333333333 & 336.666666666667 \tabularnewline
5 & 3140 & 2780.25 & 359.75 \tabularnewline
6 & 3550 & 2780.25 & 769.75 \tabularnewline
7 & 3250 & 2780.25 & 469.75 \tabularnewline
8 & 2820 & 2780.25 & 39.75 \tabularnewline
9 & 2260 & 2780.25 & -520.25 \tabularnewline
10 & 2060 & 2780.25 & -720.25 \tabularnewline
11 & 2120 & 2780.25 & -660.25 \tabularnewline
12 & 2210 & 2780.25 & -570.25 \tabularnewline
13 & 2190 & 2780.25 & -590.25 \tabularnewline
14 & 2180 & 2780.25 & -600.25 \tabularnewline
15 & 2350 & 2780.25 & -430.25 \tabularnewline
16 & 2440 & 3243.33333333333 & -803.333333333333 \tabularnewline
17 & 2370 & 2780.25 & -410.25 \tabularnewline
18 & 2440 & 2780.25 & -340.25 \tabularnewline
19 & 2610 & 2780.25 & -170.25 \tabularnewline
20 & 3040 & 3243.33333333333 & -203.333333333333 \tabularnewline
21 & 3190 & 3243.33333333333 & -53.3333333333335 \tabularnewline
22 & 3120 & 3243.33333333333 & -123.333333333333 \tabularnewline
23 & 3170 & 2780.25 & 389.75 \tabularnewline
24 & 3600 & 3243.33333333333 & 356.666666666667 \tabularnewline
25 & 3420 & 3243.33333333333 & 176.666666666667 \tabularnewline
26 & 3650 & 2780.25 & 869.75 \tabularnewline
27 & 4180 & 2780.25 & 1399.75 \tabularnewline
28 & 2960 & 3243.33333333333 & -283.333333333333 \tabularnewline
29 & 2710 & 2780.25 & -70.25 \tabularnewline
30 & 2950 & 2780.25 & 169.75 \tabularnewline
31 & 3030 & 3243.33333333333 & -213.333333333333 \tabularnewline
32 & 3770 & 3243.33333333333 & 526.666666666667 \tabularnewline
33 & 4740 & 3243.33333333333 & 1496.66666666667 \tabularnewline
34 & 4450 & 3243.33333333333 & 1206.66666666667 \tabularnewline
35 & 5550 & 5882.72727272727 & -332.727272727273 \tabularnewline
36 & 5580 & 5882.72727272727 & -302.727272727273 \tabularnewline
37 & 5890 & 5882.72727272727 & 7.27272727272702 \tabularnewline
38 & 7480 & 5882.72727272727 & 1597.27272727273 \tabularnewline
39 & 10450 & 5882.72727272727 & 4567.27272727273 \tabularnewline
40 & 6360 & 5882.72727272727 & 477.272727272727 \tabularnewline
41 & 6710 & 5882.72727272727 & 827.272727272727 \tabularnewline
42 & 6200 & 5882.72727272727 & 317.272727272727 \tabularnewline
43 & 4490 & 5882.72727272727 & -1392.72727272727 \tabularnewline
44 & 3480 & 5882.72727272727 & -2402.72727272727 \tabularnewline
45 & 2520 & 5882.72727272727 & -3362.72727272727 \tabularnewline
46 & 1920 & 3243.33333333333 & -1323.33333333333 \tabularnewline
47 & 2010 & 2780.25 & -770.25 \tabularnewline
48 & 1950 & 2780.25 & -830.25 \tabularnewline
49 & 2240 & 2780.25 & -540.25 \tabularnewline
50 & 2370 & 2780.25 & -410.25 \tabularnewline
51 & 2840 & 2780.25 & 59.75 \tabularnewline
52 & 2700 & 2780.25 & -80.25 \tabularnewline
53 & 2980 & 2780.25 & 199.75 \tabularnewline
54 & 3290 & 2780.25 & 509.75 \tabularnewline
55 & 3300 & 3243.33333333333 & 56.6666666666665 \tabularnewline
56 & 3000 & 3243.33333333333 & -243.333333333333 \tabularnewline
57 & 2330 & 3243.33333333333 & -913.333333333333 \tabularnewline
58 & 2190 & 2780.25 & -590.25 \tabularnewline
59 & 1970 & 2780.25 & -810.25 \tabularnewline
60 & 2170 & 2780.25 & -610.25 \tabularnewline
61 & 2830 & 2780.25 & 49.75 \tabularnewline
62 & 3190 & 2780.25 & 409.75 \tabularnewline
63 & 3550 & 2780.25 & 769.75 \tabularnewline
64 & 3240 & 2780.25 & 459.75 \tabularnewline
65 & 3450 & 2780.25 & 669.75 \tabularnewline
66 & 3570 & 2780.25 & 789.75 \tabularnewline
67 & 3230 & 3243.33333333333 & -13.3333333333335 \tabularnewline
68 & 3260 & 3243.33333333333 & 16.6666666666665 \tabularnewline
69 & 2700 & 2780.25 & -80.25 \tabularnewline
\hline
\end{tabular}
%Source: https://freestatistics.org/blog/index.php?pk=115248&T=2

[TABLE]
[ROW][C]Actuals, Predictions, and Residuals[/C][/ROW]
[ROW][C]#[/C][C]Actuals[/C][C]Forecasts[/C][C]Residuals[/C][/ROW]
[ROW][C]1[/C][C]3010[/C][C]2780.25[/C][C]229.75[/C][/ROW]
[ROW][C]2[/C][C]2910[/C][C]2780.25[/C][C]129.75[/C][/ROW]
[ROW][C]3[/C][C]3840[/C][C]2780.25[/C][C]1059.75[/C][/ROW]
[ROW][C]4[/C][C]3580[/C][C]3243.33333333333[/C][C]336.666666666667[/C][/ROW]
[ROW][C]5[/C][C]3140[/C][C]2780.25[/C][C]359.75[/C][/ROW]
[ROW][C]6[/C][C]3550[/C][C]2780.25[/C][C]769.75[/C][/ROW]
[ROW][C]7[/C][C]3250[/C][C]2780.25[/C][C]469.75[/C][/ROW]
[ROW][C]8[/C][C]2820[/C][C]2780.25[/C][C]39.75[/C][/ROW]
[ROW][C]9[/C][C]2260[/C][C]2780.25[/C][C]-520.25[/C][/ROW]
[ROW][C]10[/C][C]2060[/C][C]2780.25[/C][C]-720.25[/C][/ROW]
[ROW][C]11[/C][C]2120[/C][C]2780.25[/C][C]-660.25[/C][/ROW]
[ROW][C]12[/C][C]2210[/C][C]2780.25[/C][C]-570.25[/C][/ROW]
[ROW][C]13[/C][C]2190[/C][C]2780.25[/C][C]-590.25[/C][/ROW]
[ROW][C]14[/C][C]2180[/C][C]2780.25[/C][C]-600.25[/C][/ROW]
[ROW][C]15[/C][C]2350[/C][C]2780.25[/C][C]-430.25[/C][/ROW]
[ROW][C]16[/C][C]2440[/C][C]3243.33333333333[/C][C]-803.333333333333[/C][/ROW]
[ROW][C]17[/C][C]2370[/C][C]2780.25[/C][C]-410.25[/C][/ROW]
[ROW][C]18[/C][C]2440[/C][C]2780.25[/C][C]-340.25[/C][/ROW]
[ROW][C]19[/C][C]2610[/C][C]2780.25[/C][C]-170.25[/C][/ROW]
[ROW][C]20[/C][C]3040[/C][C]3243.33333333333[/C][C]-203.333333333333[/C][/ROW]
[ROW][C]21[/C][C]3190[/C][C]3243.33333333333[/C][C]-53.3333333333335[/C][/ROW]
[ROW][C]22[/C][C]3120[/C][C]3243.33333333333[/C][C]-123.333333333333[/C][/ROW]
[ROW][C]23[/C][C]3170[/C][C]2780.25[/C][C]389.75[/C][/ROW]
[ROW][C]24[/C][C]3600[/C][C]3243.33333333333[/C][C]356.666666666667[/C][/ROW]
[ROW][C]25[/C][C]3420[/C][C]3243.33333333333[/C][C]176.666666666667[/C][/ROW]
[ROW][C]26[/C][C]3650[/C][C]2780.25[/C][C]869.75[/C][/ROW]
[ROW][C]27[/C][C]4180[/C][C]2780.25[/C][C]1399.75[/C][/ROW]
[ROW][C]28[/C][C]2960[/C][C]3243.33333333333[/C][C]-283.333333333333[/C][/ROW]
[ROW][C]29[/C][C]2710[/C][C]2780.25[/C][C]-70.25[/C][/ROW]
[ROW][C]30[/C][C]2950[/C][C]2780.25[/C][C]169.75[/C][/ROW]
[ROW][C]31[/C][C]3030[/C][C]3243.33333333333[/C][C]-213.333333333333[/C][/ROW]
[ROW][C]32[/C][C]3770[/C][C]3243.33333333333[/C][C]526.666666666667[/C][/ROW]
[ROW][C]33[/C][C]4740[/C][C]3243.33333333333[/C][C]1496.66666666667[/C][/ROW]
[ROW][C]34[/C][C]4450[/C][C]3243.33333333333[/C][C]1206.66666666667[/C][/ROW]
[ROW][C]35[/C][C]5550[/C][C]5882.72727272727[/C][C]-332.727272727273[/C][/ROW]
[ROW][C]36[/C][C]5580[/C][C]5882.72727272727[/C][C]-302.727272727273[/C][/ROW]
[ROW][C]37[/C][C]5890[/C][C]5882.72727272727[/C][C]7.27272727272702[/C][/ROW]
[ROW][C]38[/C][C]7480[/C][C]5882.72727272727[/C][C]1597.27272727273[/C][/ROW]
[ROW][C]39[/C][C]10450[/C][C]5882.72727272727[/C][C]4567.27272727273[/C][/ROW]
[ROW][C]40[/C][C]6360[/C][C]5882.72727272727[/C][C]477.272727272727[/C][/ROW]
[ROW][C]41[/C][C]6710[/C][C]5882.72727272727[/C][C]827.272727272727[/C][/ROW]
[ROW][C]42[/C][C]6200[/C][C]5882.72727272727[/C][C]317.272727272727[/C][/ROW]
[ROW][C]43[/C][C]4490[/C][C]5882.72727272727[/C][C]-1392.72727272727[/C][/ROW]
[ROW][C]44[/C][C]3480[/C][C]5882.72727272727[/C][C]-2402.72727272727[/C][/ROW]
[ROW][C]45[/C][C]2520[/C][C]5882.72727272727[/C][C]-3362.72727272727[/C][/ROW]
[ROW][C]46[/C][C]1920[/C][C]3243.33333333333[/C][C]-1323.33333333333[/C][/ROW]
[ROW][C]47[/C][C]2010[/C][C]2780.25[/C][C]-770.25[/C][/ROW]
[ROW][C]48[/C][C]1950[/C][C]2780.25[/C][C]-830.25[/C][/ROW]
[ROW][C]49[/C][C]2240[/C][C]2780.25[/C][C]-540.25[/C][/ROW]
[ROW][C]50[/C][C]2370[/C][C]2780.25[/C][C]-410.25[/C][/ROW]
[ROW][C]51[/C][C]2840[/C][C]2780.25[/C][C]59.75[/C][/ROW]
[ROW][C]52[/C][C]2700[/C][C]2780.25[/C][C]-80.25[/C][/ROW]
[ROW][C]53[/C][C]2980[/C][C]2780.25[/C][C]199.75[/C][/ROW]
[ROW][C]54[/C][C]3290[/C][C]2780.25[/C][C]509.75[/C][/ROW]
[ROW][C]55[/C][C]3300[/C][C]3243.33333333333[/C][C]56.6666666666665[/C][/ROW]
[ROW][C]56[/C][C]3000[/C][C]3243.33333333333[/C][C]-243.333333333333[/C][/ROW]
[ROW][C]57[/C][C]2330[/C][C]3243.33333333333[/C][C]-913.333333333333[/C][/ROW]
[ROW][C]58[/C][C]2190[/C][C]2780.25[/C][C]-590.25[/C][/ROW]
[ROW][C]59[/C][C]1970[/C][C]2780.25[/C][C]-810.25[/C][/ROW]
[ROW][C]60[/C][C]2170[/C][C]2780.25[/C][C]-610.25[/C][/ROW]
[ROW][C]61[/C][C]2830[/C][C]2780.25[/C][C]49.75[/C][/ROW]
[ROW][C]62[/C][C]3190[/C][C]2780.25[/C][C]409.75[/C][/ROW]
[ROW][C]63[/C][C]3550[/C][C]2780.25[/C][C]769.75[/C][/ROW]
[ROW][C]64[/C][C]3240[/C][C]2780.25[/C][C]459.75[/C][/ROW]
[ROW][C]65[/C][C]3450[/C][C]2780.25[/C][C]669.75[/C][/ROW]
[ROW][C]66[/C][C]3570[/C][C]2780.25[/C][C]789.75[/C][/ROW]
[ROW][C]67[/C][C]3230[/C][C]3243.33333333333[/C][C]-13.3333333333335[/C][/ROW]
[ROW][C]68[/C][C]3260[/C][C]3243.33333333333[/C][C]16.6666666666665[/C][/ROW]
[ROW][C]69[/C][C]2700[/C][C]2780.25[/C][C]-80.25[/C][/ROW]
[/TABLE]
Source: https://freestatistics.org/blog/index.php?pk=115248&T=2

Globally Unique Identifier (entire table): ba.freestatistics.org/blog/index.php?pk=115248&T=2

As an alternative you can also use a QR Code:  

The GUIDs for individual cells are displayed in the table below:

Actuals, Predictions, and Residuals
#ActualsForecastsResiduals
130102780.25229.75
229102780.25129.75
338402780.251059.75
435803243.33333333333336.666666666667
531402780.25359.75
635502780.25769.75
732502780.25469.75
828202780.2539.75
922602780.25-520.25
1020602780.25-720.25
1121202780.25-660.25
1222102780.25-570.25
1321902780.25-590.25
1421802780.25-600.25
1523502780.25-430.25
1624403243.33333333333-803.333333333333
1723702780.25-410.25
1824402780.25-340.25
1926102780.25-170.25
2030403243.33333333333-203.333333333333
2131903243.33333333333-53.3333333333335
2231203243.33333333333-123.333333333333
2331702780.25389.75
2436003243.33333333333356.666666666667
2534203243.33333333333176.666666666667
2636502780.25869.75
2741802780.251399.75
2829603243.33333333333-283.333333333333
2927102780.25-70.25
3029502780.25169.75
3130303243.33333333333-213.333333333333
3237703243.33333333333526.666666666667
3347403243.333333333331496.66666666667
3444503243.333333333331206.66666666667
3555505882.72727272727-332.727272727273
3655805882.72727272727-302.727272727273
3758905882.727272727277.27272727272702
3874805882.727272727271597.27272727273
39104505882.727272727274567.27272727273
4063605882.72727272727477.272727272727
4167105882.72727272727827.272727272727
4262005882.72727272727317.272727272727
4344905882.72727272727-1392.72727272727
4434805882.72727272727-2402.72727272727
4525205882.72727272727-3362.72727272727
4619203243.33333333333-1323.33333333333
4720102780.25-770.25
4819502780.25-830.25
4922402780.25-540.25
5023702780.25-410.25
5128402780.2559.75
5227002780.25-80.25
5329802780.25199.75
5432902780.25509.75
5533003243.3333333333356.6666666666665
5630003243.33333333333-243.333333333333
5723303243.33333333333-913.333333333333
5821902780.25-590.25
5919702780.25-810.25
6021702780.25-610.25
6128302780.2549.75
6231902780.25409.75
6335502780.25769.75
6432402780.25459.75
6534502780.25669.75
6635702780.25789.75
6732303243.33333333333-13.3333333333335
6832603243.3333333333316.6666666666665
6927002780.25-80.25


Parameters (Session):
par1 = 12 ; par2 = -1.0 ; par3 = 1 ; par4 = 0 ; par5 = 12 ; par6 = 3 ; par7 = 1 ; par8 = 1 ; par9 = 0 ; par10 = FALSE ;
Parameters (R input):
par1 = 1 ; par2 = none ; par3 = 3 ; par4 = no ;
R code (references can be found in the software module):
library(party)
library(Hmisc)
par1 <- as.numeric(par1)
par3 <- as.numeric(par3)
x <- data.frame(t(y))
is.data.frame(x)
x <- x[!is.na(x[,par1]),]
k <- length(x[1,])
n <- length(x[,1])
colnames(x)[par1]
x[,par1]
if (par2 == 'kmeans') {
cl <- kmeans(x[,par1], par3)
print(cl)
clm <- matrix(cbind(cl$centers,1:par3),ncol=2)
clm <- clm[sort.list(clm[,1]),]
for (i in 1:par3) {
cl$cluster[cl$cluster==clm[i,2]] <- paste('C',i,sep='')
}
cl$cluster <- as.factor(cl$cluster)
print(cl$cluster)
x[,par1] <- cl$cluster
}
if (par2 == 'quantiles') {
x[,par1] <- cut2(x[,par1],g=par3)
}
if (par2 == 'hclust') {
hc <- hclust(dist(x[,par1])^2, 'cen')
print(hc)
memb <- cutree(hc, k = par3)
dum <- c(mean(x[memb==1,par1]))
for (i in 2:par3) {
dum <- c(dum, mean(x[memb==i,par1]))
}
hcm <- matrix(cbind(dum,1:par3),ncol=2)
hcm <- hcm[sort.list(hcm[,1]),]
for (i in 1:par3) {
memb[memb==hcm[i,2]] <- paste('C',i,sep='')
}
memb <- as.factor(memb)
print(memb)
x[,par1] <- memb
}
if (par2=='equal') {
ed <- cut(as.numeric(x[,par1]),par3,labels=paste('C',1:par3,sep=''))
x[,par1] <- as.factor(ed)
}
table(x[,par1])
colnames(x)
colnames(x)[par1]
x[,par1]
if (par2 == 'none') {
m <- ctree(as.formula(paste(colnames(x)[par1],' ~ .',sep='')),data = x)
}
load(file='createtable')
if (par2 != 'none') {
m <- ctree(as.formula(paste('as.factor(',colnames(x)[par1],') ~ .',sep='')),data = x)
if (par4=='yes') {
a<-table.start()
a<-table.row.start(a)
a<-table.element(a,'10-Fold Cross Validation',3+2*par3,TRUE)
a<-table.row.end(a)
a<-table.row.start(a)
a<-table.element(a,'',1,TRUE)
a<-table.element(a,'Prediction (training)',par3+1,TRUE)
a<-table.element(a,'Prediction (testing)',par3+1,TRUE)
a<-table.row.end(a)
a<-table.row.start(a)
a<-table.element(a,'Actual',1,TRUE)
for (jjj in 1:par3) a<-table.element(a,paste('C',jjj,sep=''),1,TRUE)
a<-table.element(a,'CV',1,TRUE)
for (jjj in 1:par3) a<-table.element(a,paste('C',jjj,sep=''),1,TRUE)
a<-table.element(a,'CV',1,TRUE)
a<-table.row.end(a)
for (i in 1:10) {
ind <- sample(2, nrow(x), replace=T, prob=c(0.9,0.1))
m.ct <- ctree(as.formula(paste('as.factor(',colnames(x)[par1],') ~ .',sep='')),data =x[ind==1,])
if (i==1) {
m.ct.i.pred <- predict(m.ct, newdata=x[ind==1,])
m.ct.i.actu <- x[ind==1,par1]
m.ct.x.pred <- predict(m.ct, newdata=x[ind==2,])
m.ct.x.actu <- x[ind==2,par1]
} else {
m.ct.i.pred <- c(m.ct.i.pred,predict(m.ct, newdata=x[ind==1,]))
m.ct.i.actu <- c(m.ct.i.actu,x[ind==1,par1])
m.ct.x.pred <- c(m.ct.x.pred,predict(m.ct, newdata=x[ind==2,]))
m.ct.x.actu <- c(m.ct.x.actu,x[ind==2,par1])
}
}
print(m.ct.i.tab <- table(m.ct.i.actu,m.ct.i.pred))
numer <- 0
for (i in 1:par3) {
print(m.ct.i.tab[i,i] / sum(m.ct.i.tab[i,]))
numer <- numer + m.ct.i.tab[i,i]
}
print(m.ct.i.cp <- numer / sum(m.ct.i.tab))
print(m.ct.x.tab <- table(m.ct.x.actu,m.ct.x.pred))
numer <- 0
for (i in 1:par3) {
print(m.ct.x.tab[i,i] / sum(m.ct.x.tab[i,]))
numer <- numer + m.ct.x.tab[i,i]
}
print(m.ct.x.cp <- numer / sum(m.ct.x.tab))
for (i in 1:par3) {
a<-table.row.start(a)
a<-table.element(a,paste('C',i,sep=''),1,TRUE)
for (jjj in 1:par3) a<-table.element(a,m.ct.i.tab[i,jjj])
a<-table.element(a,round(m.ct.i.tab[i,i]/sum(m.ct.i.tab[i,]),4))
for (jjj in 1:par3) a<-table.element(a,m.ct.x.tab[i,jjj])
a<-table.element(a,round(m.ct.x.tab[i,i]/sum(m.ct.x.tab[i,]),4))
a<-table.row.end(a)
}
a<-table.row.start(a)
a<-table.element(a,'Overall',1,TRUE)
for (jjj in 1:par3) a<-table.element(a,'-')
a<-table.element(a,round(m.ct.i.cp,4))
for (jjj in 1:par3) a<-table.element(a,'-')
a<-table.element(a,round(m.ct.x.cp,4))
a<-table.row.end(a)
a<-table.end(a)
table.save(a,file='mytable3.tab')
}
}
m
bitmap(file='test1.png')
plot(m)
dev.off()
bitmap(file='test1a.png')
plot(x[,par1] ~ as.factor(where(m)),main='Response by Terminal Node',xlab='Terminal Node',ylab='Response')
dev.off()
if (par2 == 'none') {
forec <- predict(m)
result <- as.data.frame(cbind(x[,par1],forec,x[,par1]-forec))
colnames(result) <- c('Actuals','Forecasts','Residuals')
print(result)
}
if (par2 != 'none') {
print(cbind(as.factor(x[,par1]),predict(m)))
myt <- table(as.factor(x[,par1]),predict(m))
print(myt)
}
bitmap(file='test2.png')
if(par2=='none') {
op <- par(mfrow=c(2,2))
plot(density(result$Actuals),main='Kernel Density Plot of Actuals')
plot(density(result$Residuals),main='Kernel Density Plot of Residuals')
plot(result$Forecasts,result$Actuals,main='Actuals versus Predictions',xlab='Predictions',ylab='Actuals')
plot(density(result$Forecasts),main='Kernel Density Plot of Predictions')
par(op)
}
if(par2!='none') {
plot(myt,main='Confusion Matrix',xlab='Actual',ylab='Predicted')
}
dev.off()
if (par2 == 'none') {
detcoef <- cor(result$Forecasts,result$Actuals)
a<-table.start()
a<-table.row.start(a)
a<-table.element(a,'Goodness of Fit',2,TRUE)
a<-table.row.end(a)
a<-table.row.start(a)
a<-table.element(a,'Correlation',1,TRUE)
a<-table.element(a,round(detcoef,4))
a<-table.row.end(a)
a<-table.row.start(a)
a<-table.element(a,'R-squared',1,TRUE)
a<-table.element(a,round(detcoef*detcoef,4))
a<-table.row.end(a)
a<-table.row.start(a)
a<-table.element(a,'RMSE',1,TRUE)
a<-table.element(a,round(sqrt(mean((result$Residuals)^2)),4))
a<-table.row.end(a)
a<-table.end(a)
table.save(a,file='mytable1.tab')
a<-table.start()
a<-table.row.start(a)
a<-table.element(a,'Actuals, Predictions, and Residuals',4,TRUE)
a<-table.row.end(a)
a<-table.row.start(a)
a<-table.element(a,'#',header=TRUE)
a<-table.element(a,'Actuals',header=TRUE)
a<-table.element(a,'Forecasts',header=TRUE)
a<-table.element(a,'Residuals',header=TRUE)
a<-table.row.end(a)
for (i in 1:length(result$Actuals)) {
a<-table.row.start(a)
a<-table.element(a,i,header=TRUE)
a<-table.element(a,result$Actuals[i])
a<-table.element(a,result$Forecasts[i])
a<-table.element(a,result$Residuals[i])
a<-table.row.end(a)
}
a<-table.end(a)
table.save(a,file='mytable.tab')
}
if (par2 != 'none') {
a<-table.start()
a<-table.row.start(a)
a<-table.element(a,'Confusion Matrix (predicted in columns / actuals in rows)',par3+1,TRUE)
a<-table.row.end(a)
a<-table.row.start(a)
a<-table.element(a,'',1,TRUE)
for (i in 1:par3) {
a<-table.element(a,paste('C',i,sep=''),1,TRUE)
}
a<-table.row.end(a)
for (i in 1:par3) {
a<-table.row.start(a)
a<-table.element(a,paste('C',i,sep=''),1,TRUE)
for (j in 1:par3) {
a<-table.element(a,myt[i,j])
}
a<-table.row.end(a)
}
a<-table.end(a)
table.save(a,file='mytable2.tab')
}