Free Statistics

of Irreproducible Research!

Author's title

Author*The author of this computation has been verified*
R Software Modulerwasp_pairs.wasp
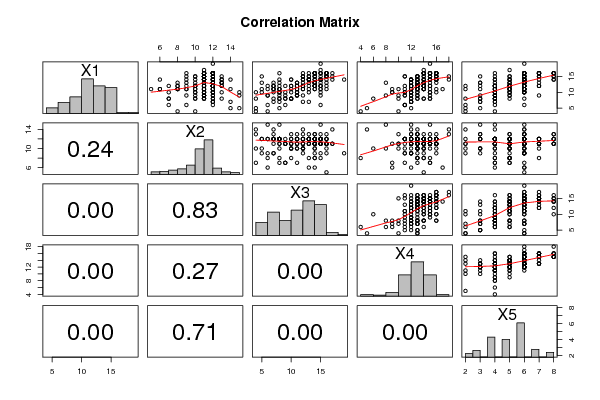
Title produced by softwareKendall tau Correlation Matrix
Date of computationFri, 24 Dec 2010 17:12:52 +0000
Cite this page as followsStatistical Computations at FreeStatistics.org, Office for Research Development and Education, URL https://freestatistics.org/blog/index.php?v=date/2010/Dec/24/t1293210661k239kvvwd02s00g.htm/, Retrieved Tue, 30 Apr 2024 05:53:12 +0000
Statistical Computations at FreeStatistics.org, Office for Research Development and Education, URL https://freestatistics.org/blog/index.php?pk=115219, Retrieved Tue, 30 Apr 2024 05:53:12 +0000
QR Codes:

Original text written by user:
IsPrivate?No (this computation is public)
User-defined keywords
Estimated Impact186
Family? (F = Feedback message, R = changed R code, M = changed R Module, P = changed Parameters, D = changed Data)
-     [Kendall tau Correlation Matrix] [] [2010-12-05 17:44:33] [b98453cac15ba1066b407e146608df68]
- RMPD  [Kendall tau Correlation Matrix] [Pearson Correlati...] [2010-12-21 19:02:22] [253127ae8da904b75450fbd69fe4eb21]
-         [Kendall tau Correlation Matrix] [De pearson correl...] [2010-12-24 10:33:01] [ca50229b6b451ac8f5a30a9e3154d674]
-    D      [Kendall tau Correlation Matrix] [correlation Pearson] [2010-12-24 16:47:37] [8e42c8cdf50f15ce85eb45a67cf771d0]
F    D          [Kendall tau Correlation Matrix] [Pearson corr.] [2010-12-24 17:12:52] [5876f3b3a8c6f0cebdbe74121f58174b] [Current]
-                 [Kendall tau Correlation Matrix] [] [2010-12-25 09:28:49] [64a7ae6044525e7ca71ecb546c042c9e]
- R               [Kendall tau Correlation Matrix] [] [2010-12-29 18:59:33] [46e2473aa7b3b1358cef648d2cdd04a9]
Feedback Forum
2010-12-30 07:23:45 [17057d7538d25ae6e90d657dd6ae3201] [reply
Het is misschien iets gemakkelijker om de tabellen te interpreteren als je voor 'Names of X columns' de benamingen: Popularity, Finding Friends... gebruikt ipv X1,X2...
2010-12-30 07:43:19 [17057d7538d25ae6e90d657dd6ae3201] [reply
We kunnen hier volgens mij zien dat X1-X3, X1-X4, X1-X5, X3-X4, X4-X5 het sterkst gecorreleerd zijn en deze zijn allemaal ongeveer even sterk gecorreleerd (correlatie is ongeveer 0.6). Bij een perfecte correlatie is de coëfficiënt gelijk aan 1. Hoe dicht bij de 1, hoe sterker twee variabelen zijn gecorreleerd.

Er is dus een correlatie is tussen Popularity en Knowing People, Liked en Celebrity. Daarnaast is Knowing People en Liked ook gecorreleerd en Liked en Celebrity.
2010-12-30 08:21:15 [17057d7538d25ae6e90d657dd6ae3201] [reply
Bij het gebruik van de Pearson Correlation matrix moet echter rekening gehouden worden met verdelingsassumpties voordat er definitieve besluiten worden genomen. In de scatterplots en de histogrammen is te zien dat de variabelen niet normaal verdeeld zijn. Er mag dus geen correlatie getoetst worden.

Vergeet dus maar mijn bovenstaande opmerking.

Post a new message
Dataseries X:
13	13	14	13	3
12	12	8	13	5
15	10	12	16	6
12	9	7	12	6
10	10	10	11	5
12	12	7	12	3
15	13	16	18	8
9	12	11	11	4
12	12	14	14	4
11	6	6	9	4
11	5	16	14	6
11	12	11	12	6
15	11	16	11	5
7	14	12	12	4
11	14	7	13	6
11	12	13	11	4
10	12	11	12	6
14	11	15	16	6
10	11	7	9	4
6	7	9	11	4
11	9	7	13	2
15	11	14	15	7
11	11	15	10	5
12	12	7	11	4
14	12	15	13	6
15	11	17	16	6
9	11	15	15	7
13	8	14	14	5
13	9	14	14	6
16	12	8	14	4
13	10	8	8	4
12	10	14	13	7
14	12	14	15	7
11	8	8	13	4
9	12	11	11	4
16	11	16	15	6
12	12	10	15	6
10	7	8	9	5
13	11	14	13	6
16	11	16	16	7
14	12	13	13	6
15	9	5	11	3
5	15	8	12	3
8	11	10	12	4
11	11	8	12	6
16	11	13	14	7
17	11	15	14	5
9	15	6	8	4
9	11	12	13	5
13	12	16	16	6
10	12	5	13	6
6	9	15	11	6
12	12	12	14	5
8	12	8	13	4
14	13	13	13	5
12	11	14	13	5
11	9	12	12	4
16	9	16	16	6
8	11	10	15	2
15	11	15	15	8
7	12	8	12	3
16	12	16	14	6
14	9	19	12	6
16	11	14	15	6
9	9	6	12	5
14	12	13	13	5
11	12	15	12	6
13	12	7	12	5
15	12	13	13	6
5	14	4	5	2
15	11	14	13	5
13	12	13	13	5
11	11	11	14	5
11	6	14	17	6
12	10	12	13	6
12	12	15	13	6
12	13	14	12	5
12	8	13	13	5
14	12	8	14	4
6	12	6	11	2
7	12	7	12	4
14	6	13	12	6
14	11	13	16	6
10	10	11	12	5
13	12	5	12	3
12	13	12	12	6
9	11	8	10	4
12	7	11	15	5
16	11	14	15	8
10	11	9	12	4
14	11	10	16	6
10	11	13	15	6
16	12	16	16	7
15	10	16	13	6
12	11	11	12	5
10	12	8	11	4
8	7	4	13	6
8	13	7	10	3
11	8	14	15	5
13	12	11	13	6
16	11	17	16	7
16	12	15	15	7
14	14	17	18	6
11	10	5	13	3
4	10	4	10	2
14	13	10	16	8
9	10	11	13	3
14	11	15	15	8
8	10	10	14	3
8	7	9	15	4
11	10	12	14	5
12	8	15	13	7
11	12	7	13	6
14	12	13	15	6
15	12	12	16	7
16	11	14	14	6
16	12	14	14	6
11	12	8	16	6
14	12	15	14	6
14	11	12	12	4
12	12	12	13	4
14	11	16	12	5
8	11	9	12	4
13	13	15	14	6
16	12	15	14	6
12	12	6	14	5
16	12	14	16	8
12	12	15	13	6
11	8	10	14	5
4	8	6	4	4
16	12	14	16	8
15	11	12	13	6
10	12	8	16	4
13	13	11	15	6
15	12	13	14	6
12	12	9	13	4
14	11	15	14	6
7	12	13	12	3
19	12	15	15	6
12	10	14	14	5
12	11	16	13	4
13	12	14	14	6
15	12	14	16	4
8	10	10	6	4
12	12	10	13	4
10	13	4	13	6
8	12	8	14	5
10	15	15	15	6
15	11	16	14	6
16	12	12	15	8
13	11	12	13	7
16	12	15	16	7
9	11	9	12	4
14	10	12	15	6
14	11	14	12	6
12	11	11	14	2


Summary of computational transaction
Raw Inputview raw input (R code)
Raw Outputview raw output of R engine
Computing time2 seconds
R Server'RServer@AstonUniversity' @ vre.aston.ac.uk
R Framework error message
The field 'Names of X columns' contains a hard return which cannot be interpreted.
Please, resubmit your request without hard returns in the 'Names of X columns'.

\begin{tabular}{lllllllll}
\hline
Summary of computational transaction \tabularnewline
Raw Input & view raw input (R code)  \tabularnewline
Raw Output & view raw output of R engine  \tabularnewline
Computing time & 2 seconds \tabularnewline
R Server & 'RServer@AstonUniversity' @ vre.aston.ac.uk \tabularnewline
R Framework error message & 
The field 'Names of X columns' contains a hard return which cannot be interpreted.
Please, resubmit your request without hard returns in the 'Names of X columns'.
\tabularnewline \hline \end{tabular} %Source: https://freestatistics.org/blog/index.php?pk=115219&T=0

[TABLE]
[ROW][C]Summary of computational transaction[/C][/ROW]
[ROW][C]Raw Input[/C][C]view raw input (R code) [/C][/ROW]
[ROW][C]Raw Output[/C][C]view raw output of R engine [/C][/ROW]
[ROW][C]Computing time[/C][C]2 seconds[/C][/ROW]
[ROW][C]R Server[/C][C]'RServer@AstonUniversity' @ vre.aston.ac.uk[/C][/ROW]
[ROW][C]R Framework error message[/C][C]
The field 'Names of X columns' contains a hard return which cannot be interpreted.
Please, resubmit your request without hard returns in the 'Names of X columns'.
[/C][/ROW] [/TABLE] Source: https://freestatistics.org/blog/index.php?pk=115219&T=0

Globally Unique Identifier (entire table): ba.freestatistics.org/blog/index.php?pk=115219&T=0

As an alternative you can also use a QR Code:  

The GUIDs for individual cells are displayed in the table below:

Summary of computational transaction
Raw Inputview raw input (R code)
Raw Outputview raw output of R engine
Computing time2 seconds
R Server'RServer@AstonUniversity' @ vre.aston.ac.uk
R Framework error message
The field 'Names of X columns' contains a hard return which cannot be interpreted.
Please, resubmit your request without hard returns in the 'Names of X columns'.


Correlations for all pairs of data series (method=pearson)
X1X2X3X4X5
X110.0940.5840.5670.6
X20.09410.0170.0890.031
X30.5840.01710.4970.558
X40.5670.0890.49710.538
X5 0.60.0310.5580.5381

\begin{tabular}{lllllllll}
\hline
Correlations for all pairs of data series (method=pearson) \tabularnewline
  & X1 & X2 & X3 & X4 & X5
 \tabularnewline
X1 & 1 & 0.094 & 0.584 & 0.567 & 0.6 \tabularnewline
X2 & 0.094 & 1 & 0.017 & 0.089 & 0.031 \tabularnewline
X3 & 0.584 & 0.017 & 1 & 0.497 & 0.558 \tabularnewline
X4 & 0.567 & 0.089 & 0.497 & 1 & 0.538 \tabularnewline
X5
 & 0.6 & 0.031 & 0.558 & 0.538 & 1 \tabularnewline
\hline
\end{tabular}
%Source: https://freestatistics.org/blog/index.php?pk=115219&T=1

[TABLE]
[ROW][C]Correlations for all pairs of data series (method=pearson)[/C][/ROW]
[ROW][C] [/C][C]X1[/C][C]X2[/C][C]X3[/C][C]X4[/C][C]X5
[/C][/ROW]
[ROW][C]X1[/C][C]1[/C][C]0.094[/C][C]0.584[/C][C]0.567[/C][C]0.6[/C][/ROW]
[ROW][C]X2[/C][C]0.094[/C][C]1[/C][C]0.017[/C][C]0.089[/C][C]0.031[/C][/ROW]
[ROW][C]X3[/C][C]0.584[/C][C]0.017[/C][C]1[/C][C]0.497[/C][C]0.558[/C][/ROW]
[ROW][C]X4[/C][C]0.567[/C][C]0.089[/C][C]0.497[/C][C]1[/C][C]0.538[/C][/ROW]
[ROW][C]X5
[/C][C]0.6[/C][C]0.031[/C][C]0.558[/C][C]0.538[/C][C]1[/C][/ROW]
[/TABLE]
Source: https://freestatistics.org/blog/index.php?pk=115219&T=1

Globally Unique Identifier (entire table): ba.freestatistics.org/blog/index.php?pk=115219&T=1

As an alternative you can also use a QR Code:  

The GUIDs for individual cells are displayed in the table below:

Correlations for all pairs of data series (method=pearson)
X1X2X3X4X5
X110.0940.5840.5670.6
X20.09410.0170.0890.031
X30.5840.01710.4970.558
X40.5670.0890.49710.538
X5 0.60.0310.5580.5381


Correlations for all pairs of data series with p-values
pairPearson rSpearman rhoKendall tau
X1;X20.0940.08910.0671
p-value(0.2432)(0.2688)(0.2772)
X1;X30.58370.59160.4504
p-value(0)(0)(0)
X1;X40.56720.55120.433
p-value(0)(0)(0)
X1;X5 0.60010.5880.4814
p-value(0)(0)(0)
X2;X30.0172-0.0171-0.015
p-value(0.8308)(0.8318)(0.8069)
X2;X40.08860.07750.0612
p-value(0.2714)(0.3361)(0.3316)
X2;X5 0.03050.0480.0382
p-value(0.7052)(0.5522)(0.5541)
X3;X40.49730.47530.3704
p-value(0)(0)(0)
X3;X5 0.55770.56920.4502
p-value(0)(0)(0)
X4;X5 0.53760.56990.4651
p-value(0)(0)(0)

\begin{tabular}{lllllllll}
\hline
Correlations for all pairs of data series with p-values \tabularnewline
pair & Pearson r & Spearman rho & Kendall tau \tabularnewline
X1;X2 & 0.094 & 0.0891 & 0.0671 \tabularnewline
p-value & (0.2432) & (0.2688) & (0.2772) \tabularnewline
X1;X3 & 0.5837 & 0.5916 & 0.4504 \tabularnewline
p-value & (0) & (0) & (0) \tabularnewline
X1;X4 & 0.5672 & 0.5512 & 0.433 \tabularnewline
p-value & (0) & (0) & (0) \tabularnewline
X1;X5
 & 0.6001 & 0.588 & 0.4814 \tabularnewline
p-value & (0) & (0) & (0) \tabularnewline
X2;X3 & 0.0172 & -0.0171 & -0.015 \tabularnewline
p-value & (0.8308) & (0.8318) & (0.8069) \tabularnewline
X2;X4 & 0.0886 & 0.0775 & 0.0612 \tabularnewline
p-value & (0.2714) & (0.3361) & (0.3316) \tabularnewline
X2;X5
 & 0.0305 & 0.048 & 0.0382 \tabularnewline
p-value & (0.7052) & (0.5522) & (0.5541) \tabularnewline
X3;X4 & 0.4973 & 0.4753 & 0.3704 \tabularnewline
p-value & (0) & (0) & (0) \tabularnewline
X3;X5
 & 0.5577 & 0.5692 & 0.4502 \tabularnewline
p-value & (0) & (0) & (0) \tabularnewline
X4;X5
 & 0.5376 & 0.5699 & 0.4651 \tabularnewline
p-value & (0) & (0) & (0) \tabularnewline
\hline
\end{tabular}
%Source: https://freestatistics.org/blog/index.php?pk=115219&T=2

[TABLE]
[ROW][C]Correlations for all pairs of data series with p-values[/C][/ROW]
[ROW][C]pair[/C][C]Pearson r[/C][C]Spearman rho[/C][C]Kendall tau[/C][/ROW]
[ROW][C]X1;X2[/C][C]0.094[/C][C]0.0891[/C][C]0.0671[/C][/ROW]
[ROW][C]p-value[/C][C](0.2432)[/C][C](0.2688)[/C][C](0.2772)[/C][/ROW]
[ROW][C]X1;X3[/C][C]0.5837[/C][C]0.5916[/C][C]0.4504[/C][/ROW]
[ROW][C]p-value[/C][C](0)[/C][C](0)[/C][C](0)[/C][/ROW]
[ROW][C]X1;X4[/C][C]0.5672[/C][C]0.5512[/C][C]0.433[/C][/ROW]
[ROW][C]p-value[/C][C](0)[/C][C](0)[/C][C](0)[/C][/ROW]
[ROW][C]X1;X5
[/C][C]0.6001[/C][C]0.588[/C][C]0.4814[/C][/ROW]
[ROW][C]p-value[/C][C](0)[/C][C](0)[/C][C](0)[/C][/ROW]
[ROW][C]X2;X3[/C][C]0.0172[/C][C]-0.0171[/C][C]-0.015[/C][/ROW]
[ROW][C]p-value[/C][C](0.8308)[/C][C](0.8318)[/C][C](0.8069)[/C][/ROW]
[ROW][C]X2;X4[/C][C]0.0886[/C][C]0.0775[/C][C]0.0612[/C][/ROW]
[ROW][C]p-value[/C][C](0.2714)[/C][C](0.3361)[/C][C](0.3316)[/C][/ROW]
[ROW][C]X2;X5
[/C][C]0.0305[/C][C]0.048[/C][C]0.0382[/C][/ROW]
[ROW][C]p-value[/C][C](0.7052)[/C][C](0.5522)[/C][C](0.5541)[/C][/ROW]
[ROW][C]X3;X4[/C][C]0.4973[/C][C]0.4753[/C][C]0.3704[/C][/ROW]
[ROW][C]p-value[/C][C](0)[/C][C](0)[/C][C](0)[/C][/ROW]
[ROW][C]X3;X5
[/C][C]0.5577[/C][C]0.5692[/C][C]0.4502[/C][/ROW]
[ROW][C]p-value[/C][C](0)[/C][C](0)[/C][C](0)[/C][/ROW]
[ROW][C]X4;X5
[/C][C]0.5376[/C][C]0.5699[/C][C]0.4651[/C][/ROW]
[ROW][C]p-value[/C][C](0)[/C][C](0)[/C][C](0)[/C][/ROW]
[/TABLE]
Source: https://freestatistics.org/blog/index.php?pk=115219&T=2

Globally Unique Identifier (entire table): ba.freestatistics.org/blog/index.php?pk=115219&T=2

As an alternative you can also use a QR Code:  

The GUIDs for individual cells are displayed in the table below:

Correlations for all pairs of data series with p-values
pairPearson rSpearman rhoKendall tau
X1;X20.0940.08910.0671
p-value(0.2432)(0.2688)(0.2772)
X1;X30.58370.59160.4504
p-value(0)(0)(0)
X1;X40.56720.55120.433
p-value(0)(0)(0)
X1;X5 0.60010.5880.4814
p-value(0)(0)(0)
X2;X30.0172-0.0171-0.015
p-value(0.8308)(0.8318)(0.8069)
X2;X40.08860.07750.0612
p-value(0.2714)(0.3361)(0.3316)
X2;X5 0.03050.0480.0382
p-value(0.7052)(0.5522)(0.5541)
X3;X40.49730.47530.3704
p-value(0)(0)(0)
X3;X5 0.55770.56920.4502
p-value(0)(0)(0)
X4;X5 0.53760.56990.4651
p-value(0)(0)(0)


Parameters (Session):
par1 = pearson ;
Parameters (R input):
par1 = pearson ;
R code (references can be found in the software module):
panel.tau <- function(x, y, digits=2, prefix='', cex.cor)
{
usr <- par('usr'); on.exit(par(usr))
par(usr = c(0, 1, 0, 1))
rr <- cor.test(x, y, method=par1)
r <- round(rr$p.value,2)
txt <- format(c(r, 0.123456789), digits=digits)[1]
txt <- paste(prefix, txt, sep='')
if(missing(cex.cor)) cex <- 0.5/strwidth(txt)
text(0.5, 0.5, txt, cex = cex)
}
panel.hist <- function(x, ...)
{
usr <- par('usr'); on.exit(par(usr))
par(usr = c(usr[1:2], 0, 1.5) )
h <- hist(x, plot = FALSE)
breaks <- h$breaks; nB <- length(breaks)
y <- h$counts; y <- y/max(y)
rect(breaks[-nB], 0, breaks[-1], y, col='grey', ...)
}
bitmap(file='test1.png')
pairs(t(y),diag.panel=panel.hist, upper.panel=panel.smooth, lower.panel=panel.tau, main=main)
dev.off()
load(file='createtable')
n <- length(y[,1])
n
a<-table.start()
a<-table.row.start(a)
a<-table.element(a,paste('Correlations for all pairs of data series (method=',par1,')',sep=''),n+1,TRUE)
a<-table.row.end(a)
a<-table.row.start(a)
a<-table.element(a,' ',header=TRUE)
for (i in 1:n) {
a<-table.element(a,dimnames(t(x))[[2]][i],header=TRUE)
}
a<-table.row.end(a)
for (i in 1:n) {
a<-table.row.start(a)
a<-table.element(a,dimnames(t(x))[[2]][i],header=TRUE)
for (j in 1:n) {
r <- cor.test(y[i,],y[j,],method=par1)
a<-table.element(a,round(r$estimate,3))
}
a<-table.row.end(a)
}
a<-table.end(a)
table.save(a,file='mytable.tab')
a<-table.start()
a<-table.row.start(a)
a<-table.element(a,'Correlations for all pairs of data series with p-values',4,TRUE)
a<-table.row.end(a)
a<-table.row.start(a)
a<-table.element(a,'pair',1,TRUE)
a<-table.element(a,'Pearson r',1,TRUE)
a<-table.element(a,'Spearman rho',1,TRUE)
a<-table.element(a,'Kendall tau',1,TRUE)
a<-table.row.end(a)
cor.test(y[1,],y[2,],method=par1)
for (i in 1:(n-1))
{
for (j in (i+1):n)
{
a<-table.row.start(a)
dum <- paste(dimnames(t(x))[[2]][i],';',dimnames(t(x))[[2]][j],sep='')
a<-table.element(a,dum,header=TRUE)
rp <- cor.test(y[i,],y[j,],method='pearson')
a<-table.element(a,round(rp$estimate,4))
rs <- cor.test(y[i,],y[j,],method='spearman')
a<-table.element(a,round(rs$estimate,4))
rk <- cor.test(y[i,],y[j,],method='kendall')
a<-table.element(a,round(rk$estimate,4))
a<-table.row.end(a)
a<-table.row.start(a)
a<-table.element(a,'p-value',header=T)
a<-table.element(a,paste('(',round(rp$p.value,4),')',sep=''))
a<-table.element(a,paste('(',round(rs$p.value,4),')',sep=''))
a<-table.element(a,paste('(',round(rk$p.value,4),')',sep=''))
a<-table.row.end(a)
}
}
a<-table.end(a)
table.save(a,file='mytable1.tab')