Free Statistics

of Irreproducible Research!

Author's title

Author*The author of this computation has been verified*
R Software ModulePatrick.Wessarwasp_pairs.wasp
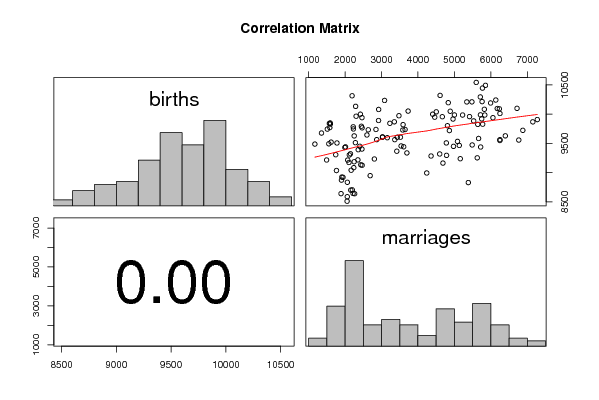
Title produced by softwareKendall tau Correlation Matrix
Date of computationFri, 24 Dec 2010 17:07:08 +0000
Cite this page as followsStatistical Computations at FreeStatistics.org, Office for Research Development and Education, URL https://freestatistics.org/blog/index.php?v=date/2010/Dec/24/t12932103615spzx46qt661zd8.htm/, Retrieved Tue, 30 Apr 2024 04:09:23 +0000
Statistical Computations at FreeStatistics.org, Office for Research Development and Education, URL https://freestatistics.org/blog/index.php?pk=115214, Retrieved Tue, 30 Apr 2024 04:09:23 +0000
QR Codes:

Original text written by user:
IsPrivate?No (this computation is public)
User-defined keywords
Estimated Impact160
Family? (F = Feedback message, R = changed R code, M = changed R Module, P = changed Parameters, D = changed Data)
-     [Kendall tau Correlation Matrix] [] [2010-12-05 17:44:33] [b98453cac15ba1066b407e146608df68]
- R PD  [Kendall tau Correlation Matrix] [] [2010-12-24 09:42:34] [b10d6b9682dfaaa479f495240bcd67cf]
-    D      [Kendall tau Correlation Matrix] [] [2010-12-24 17:07:08] [a5ae4a79649e10f10ac7ff219d0ba7a7] [Current]
-   P         [Kendall tau Correlation Matrix] [] [2010-12-24 17:17:34] [fa409bd323d47d7cf4d4bfe80571749f]
Feedback Forum

Post a new message
Dataseries X:
9506	1775
8704	2197
10079	2920
8993	4240
9957	5415
10240	6136
10098	6719
10090	6234
9867	7152
9736	3646
9040	2165
9232	2803
9520	1615
9217	2350
9868	3350
9455	3536
9984	5834
9556	6767
10190	5993
9906	7276
9824	5641
9972	3477
9185	2247
9765	2466
9838	1567
9084	2237
9643	2598
10051	3729
9987	5715
9827	5776
10491	5852
9722	6878
9472	5488
9728	3583
8510	2054
9511	2282
9492	1552
8638	2261
9792	2446
9605	3519
9237	5161
9533	5085
10293	5711
9938	6057
9984	5224
9563	3363
8871	1899
9301	2115
9215	1491
8834	2061
9998	2419
9604	3430
9507	4778
9718	4862
10095	6176
9583	5664
9883	5529
9365	3418
8919	1941
9449	2402
9769	1579
9321	2146
9939	2462
9336	3695
10195	4831
9464	5134
10010	6250
10213	5760
9563	6249
9890	2917
9305	1741
9391	2359
9743	1511
8587	2059
9731	2635
9563	2867
9998	4403
9437	5720
10038	4502
9918	5749
9252	5627
9737	2846
9035	1762
9133	2429
9487	1169
8700	2154
9627	2249
8947	2687
9283	4359
8829	5382
9947	4459
9628	6398
9318	4596
9605	3024
8640	1887
9214	2070
9676	1351
8642	2218
9402	2461
9610	3028
9294	4784
9448	4975
10319	4607
9548	6249
9801	4809
9596	3157
8923	1910
9746	2228
9829	1594
9125	2467
9782	2222
9441	3607
9162	4685
9915	4962
10444	5770
10209	5480
9985	5000
9842	3228
9429	1993
10132	2288
9849	1588
9172	2105
10313	2191
9819	3591
9955	4668
10048	4885
10082	5822
10541	5599
10208	5340
10233	3082
9439	2010
9963	2301


Summary of computational transaction
Raw Inputview raw input (R code)
Raw Outputview raw output of R engine
Computing time2 seconds
R Server'Gwilym Jenkins' @ 72.249.127.135

\begin{tabular}{lllllllll}
\hline
Summary of computational transaction \tabularnewline
Raw Input & view raw input (R code)  \tabularnewline
Raw Output & view raw output of R engine  \tabularnewline
Computing time & 2 seconds \tabularnewline
R Server & 'Gwilym Jenkins' @ 72.249.127.135 \tabularnewline
\hline
\end{tabular}
%Source: https://freestatistics.org/blog/index.php?pk=115214&T=0

[TABLE]
[ROW][C]Summary of computational transaction[/C][/ROW]
[ROW][C]Raw Input[/C][C]view raw input (R code) [/C][/ROW]
[ROW][C]Raw Output[/C][C]view raw output of R engine [/C][/ROW]
[ROW][C]Computing time[/C][C]2 seconds[/C][/ROW]
[ROW][C]R Server[/C][C]'Gwilym Jenkins' @ 72.249.127.135[/C][/ROW]
[/TABLE]
Source: https://freestatistics.org/blog/index.php?pk=115214&T=0

Globally Unique Identifier (entire table): ba.freestatistics.org/blog/index.php?pk=115214&T=0

As an alternative you can also use a QR Code:  

The GUIDs for individual cells are displayed in the table below:

Summary of computational transaction
Raw Inputview raw input (R code)
Raw Outputview raw output of R engine
Computing time2 seconds
R Server'Gwilym Jenkins' @ 72.249.127.135


Correlations for all pairs of data series (method=pearson)
birthsmarriages
births10.472
marriages0.4721

\begin{tabular}{lllllllll}
\hline
Correlations for all pairs of data series (method=pearson) \tabularnewline
  & births & marriages \tabularnewline
births & 1 & 0.472 \tabularnewline
marriages & 0.472 & 1 \tabularnewline
\hline
\end{tabular}
%Source: https://freestatistics.org/blog/index.php?pk=115214&T=1

[TABLE]
[ROW][C]Correlations for all pairs of data series (method=pearson)[/C][/ROW]
[ROW][C] [/C][C]births[/C][C]marriages[/C][/ROW]
[ROW][C]births[/C][C]1[/C][C]0.472[/C][/ROW]
[ROW][C]marriages[/C][C]0.472[/C][C]1[/C][/ROW]
[/TABLE]
Source: https://freestatistics.org/blog/index.php?pk=115214&T=1

Globally Unique Identifier (entire table): ba.freestatistics.org/blog/index.php?pk=115214&T=1

As an alternative you can also use a QR Code:  

The GUIDs for individual cells are displayed in the table below:

Correlations for all pairs of data series (method=pearson)
birthsmarriages
births10.472
marriages0.4721


Correlations for all pairs of data series with p-values
pairPearson rSpearman rhoKendall tau
births;marriages0.47170.49070.3313
p-value(0)(0)(0)

\begin{tabular}{lllllllll}
\hline
Correlations for all pairs of data series with p-values \tabularnewline
pair & Pearson r & Spearman rho & Kendall tau \tabularnewline
births;marriages & 0.4717 & 0.4907 & 0.3313 \tabularnewline
p-value & (0) & (0) & (0) \tabularnewline
\hline
\end{tabular}
%Source: https://freestatistics.org/blog/index.php?pk=115214&T=2

[TABLE]
[ROW][C]Correlations for all pairs of data series with p-values[/C][/ROW]
[ROW][C]pair[/C][C]Pearson r[/C][C]Spearman rho[/C][C]Kendall tau[/C][/ROW]
[ROW][C]births;marriages[/C][C]0.4717[/C][C]0.4907[/C][C]0.3313[/C][/ROW]
[ROW][C]p-value[/C][C](0)[/C][C](0)[/C][C](0)[/C][/ROW]
[/TABLE]
Source: https://freestatistics.org/blog/index.php?pk=115214&T=2

Globally Unique Identifier (entire table): ba.freestatistics.org/blog/index.php?pk=115214&T=2

As an alternative you can also use a QR Code:  

The GUIDs for individual cells are displayed in the table below:

Correlations for all pairs of data series with p-values
pairPearson rSpearman rhoKendall tau
births;marriages0.47170.49070.3313
p-value(0)(0)(0)


Parameters (Session):
par1 = pearson ;
Parameters (R input):
par1 = pearson ;
R code (references can be found in the software module):
panel.tau <- function(x, y, digits=2, prefix='', cex.cor)
{
usr <- par('usr'); on.exit(par(usr))
par(usr = c(0, 1, 0, 1))
rr <- cor.test(x, y, method=par1)
r <- round(rr$p.value,2)
txt <- format(c(r, 0.123456789), digits=digits)[1]
txt <- paste(prefix, txt, sep='')
if(missing(cex.cor)) cex <- 0.5/strwidth(txt)
text(0.5, 0.5, txt, cex = cex)
}
panel.hist <- function(x, ...)
{
usr <- par('usr'); on.exit(par(usr))
par(usr = c(usr[1:2], 0, 1.5) )
h <- hist(x, plot = FALSE)
breaks <- h$breaks; nB <- length(breaks)
y <- h$counts; y <- y/max(y)
rect(breaks[-nB], 0, breaks[-1], y, col='grey', ...)
}
bitmap(file='test1.png')
pairs(t(y),diag.panel=panel.hist, upper.panel=panel.smooth, lower.panel=panel.tau, main=main)
dev.off()
load(file='createtable')
n <- length(y[,1])
n
a<-table.start()
a<-table.row.start(a)
a<-table.element(a,paste('Correlations for all pairs of data series (method=',par1,')',sep=''),n+1,TRUE)
a<-table.row.end(a)
a<-table.row.start(a)
a<-table.element(a,' ',header=TRUE)
for (i in 1:n) {
a<-table.element(a,dimnames(t(x))[[2]][i],header=TRUE)
}
a<-table.row.end(a)
for (i in 1:n) {
a<-table.row.start(a)
a<-table.element(a,dimnames(t(x))[[2]][i],header=TRUE)
for (j in 1:n) {
r <- cor.test(y[i,],y[j,],method=par1)
a<-table.element(a,round(r$estimate,3))
}
a<-table.row.end(a)
}
a<-table.end(a)
table.save(a,file='mytable.tab')
a<-table.start()
a<-table.row.start(a)
a<-table.element(a,'Correlations for all pairs of data series with p-values',4,TRUE)
a<-table.row.end(a)
a<-table.row.start(a)
a<-table.element(a,'pair',1,TRUE)
a<-table.element(a,'Pearson r',1,TRUE)
a<-table.element(a,'Spearman rho',1,TRUE)
a<-table.element(a,'Kendall tau',1,TRUE)
a<-table.row.end(a)
cor.test(y[1,],y[2,],method=par1)
for (i in 1:(n-1))
{
for (j in (i+1):n)
{
a<-table.row.start(a)
dum <- paste(dimnames(t(x))[[2]][i],';',dimnames(t(x))[[2]][j],sep='')
a<-table.element(a,dum,header=TRUE)
rp <- cor.test(y[i,],y[j,],method='pearson')
a<-table.element(a,round(rp$estimate,4))
rs <- cor.test(y[i,],y[j,],method='spearman')
a<-table.element(a,round(rs$estimate,4))
rk <- cor.test(y[i,],y[j,],method='kendall')
a<-table.element(a,round(rk$estimate,4))
a<-table.row.end(a)
a<-table.row.start(a)
a<-table.element(a,'p-value',header=T)
a<-table.element(a,paste('(',round(rp$p.value,4),')',sep=''))
a<-table.element(a,paste('(',round(rs$p.value,4),')',sep=''))
a<-table.element(a,paste('(',round(rk$p.value,4),')',sep=''))
a<-table.row.end(a)
}
}
a<-table.end(a)
table.save(a,file='mytable1.tab')