| Multiple Linear Regression - Estimated Regression Equation |
| werkloosheid[t] = + 545.544217687075 + 10.6394557823129X[t] -4.19727891156464M1[t] + 2.00000000000000M2[t] + 6.00000000000001M3[t] + 1.20000000000001M4[t] -9M5[t] -14.0000000000000M6[t] -27M7[t] -23.6M8[t] + 28.4M9[t] + 35.4M10[t] + 19.6M11[t] + e[t] |
| Multiple Linear Regression - Ordinary Least Squares | |||||
| Variable | Parameter | S.D. | T-STAT H0: parameter = 0 | 2-tail p-value | 1-tail p-value |
| (Intercept) | 545.544217687075 | 16.15886 | 33.7613 | 0 | 0 |
| X | 10.6394557823129 | 9.177616 | 1.1593 | 0.252075 | 0.126038 |
| M1 | -4.19727891156464 | 21.326852 | -0.1968 | 0.844809 | 0.422405 |
| M2 | 2.00000000000000 | 22.254536 | 0.0899 | 0.928765 | 0.464383 |
| M3 | 6.00000000000001 | 22.254536 | 0.2696 | 0.788618 | 0.394309 |
| M4 | 1.20000000000001 | 22.254536 | 0.0539 | 0.957221 | 0.478611 |
| M5 | -9 | 22.254536 | -0.4044 | 0.687706 | 0.343853 |
| M6 | -14.0000000000000 | 22.254536 | -0.6291 | 0.532276 | 0.266138 |
| M7 | -27 | 22.254536 | -1.2132 | 0.230976 | 0.115488 |
| M8 | -23.6 | 22.254536 | -1.0605 | 0.294243 | 0.147122 |
| M9 | 28.4 | 22.254536 | 1.2761 | 0.208045 | 0.104022 |
| M10 | 35.4 | 22.254536 | 1.5907 | 0.118245 | 0.059123 |
| M11 | 19.6 | 22.254536 | 0.8807 | 0.382858 | 0.191429 |
| Multiple Linear Regression - Regression Statistics | |
| Multiple R | 0.518642621269286 |
| R-squared | 0.268990168597076 |
| Adjusted R-squared | 0.0862377107463449 |
| F-TEST (value) | 1.47188263162393 |
| F-TEST (DF numerator) | 12 |
| F-TEST (DF denominator) | 48 |
| p-value | 0.168108290720798 |
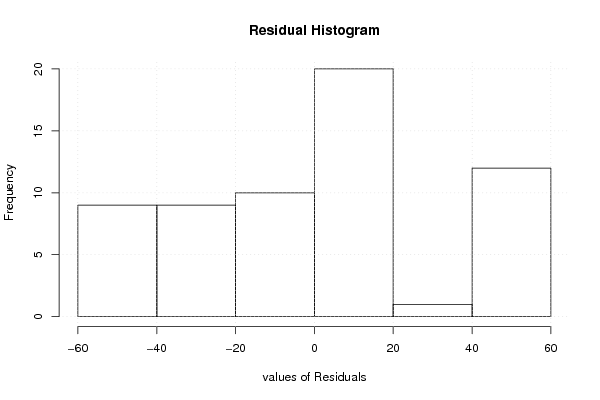
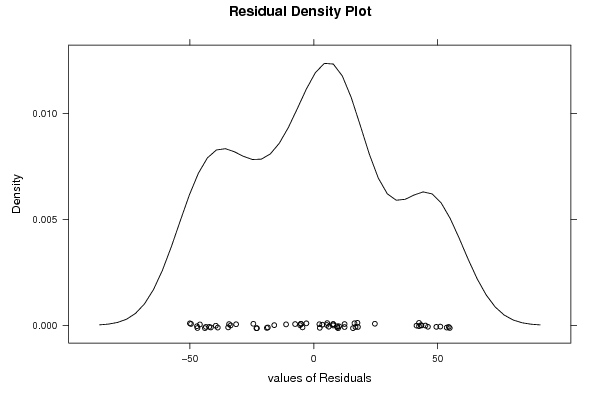
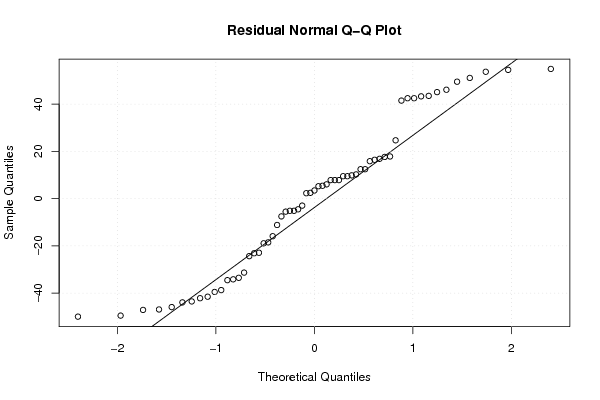
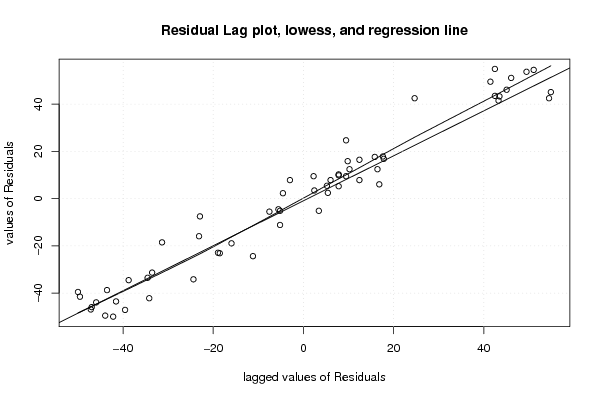
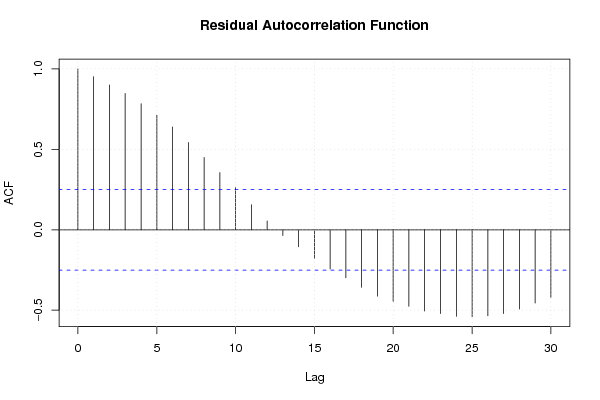
| Multiple Linear Regression - Residual Statistics | |
| Residual Standard Deviation | 35.1875103460552 |
| Sum Squared Residuals | 59431.7224489796 |
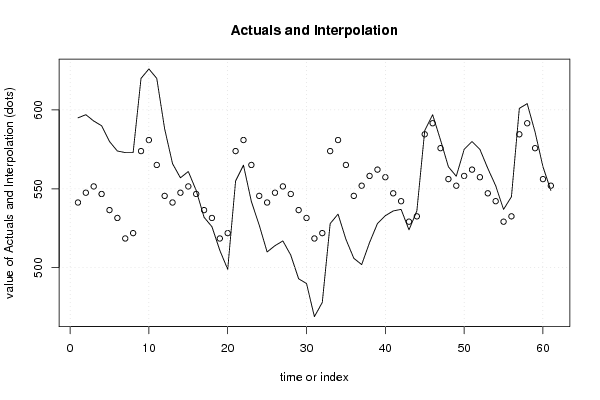
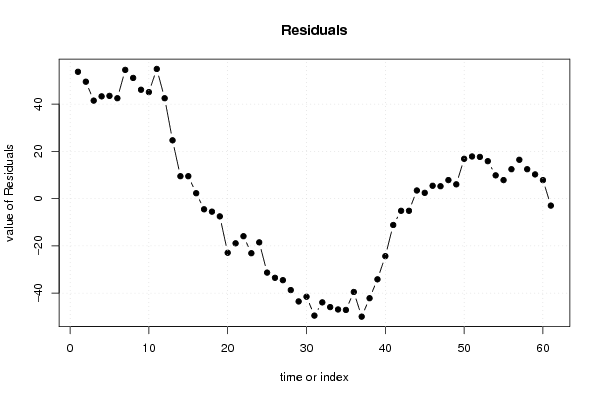
| Multiple Linear Regression - Actuals, Interpolation, and Residuals | |||
| Time or Index | Actuals | Interpolation Forecast | Residuals Prediction Error |
| 1 | 595 | 541.34693877551 | 53.6530612244897 |
| 2 | 597 | 547.544217687075 | 49.4557823129252 |
| 3 | 593 | 551.544217687075 | 41.4557823129252 |
| 4 | 590 | 546.744217687075 | 43.2557823129251 |
| 5 | 580 | 536.544217687075 | 43.4557823129252 |
| 6 | 574 | 531.544217687075 | 42.4557823129252 |
| 7 | 573 | 518.544217687075 | 54.4557823129252 |
| 8 | 573 | 521.944217687075 | 51.0557823129252 |
| 9 | 620 | 573.944217687075 | 46.0557823129252 |
| 10 | 626 | 580.944217687075 | 45.0557823129252 |
| 11 | 620 | 565.144217687075 | 54.8557823129252 |
| 12 | 588 | 545.544217687075 | 42.4557823129252 |
| 13 | 566 | 541.34693877551 | 24.6530612244898 |
| 14 | 557 | 547.544217687075 | 9.45578231292518 |
| 15 | 561 | 551.544217687075 | 9.45578231292517 |
| 16 | 549 | 546.744217687075 | 2.25578231292517 |
| 17 | 532 | 536.544217687075 | -4.54421768707483 |
| 18 | 526 | 531.544217687075 | -5.54421768707483 |
| 19 | 511 | 518.544217687075 | -7.54421768707483 |
| 20 | 499 | 521.944217687075 | -22.9442176870748 |
| 21 | 555 | 573.944217687075 | -18.9442176870748 |
| 22 | 565 | 580.944217687075 | -15.9442176870748 |
| 23 | 542 | 565.144217687075 | -23.1442176870748 |
| 24 | 527 | 545.544217687075 | -18.5442176870748 |
| 25 | 510 | 541.34693877551 | -31.3469387755102 |
| 26 | 514 | 547.544217687075 | -33.5442176870748 |
| 27 | 517 | 551.544217687075 | -34.5442176870748 |
| 28 | 508 | 546.744217687075 | -38.7442176870748 |
| 29 | 493 | 536.544217687075 | -43.5442176870748 |
| 30 | 490 | 531.544217687075 | -41.5442176870748 |
| 31 | 469 | 518.544217687075 | -49.5442176870748 |
| 32 | 478 | 521.944217687075 | -43.9442176870748 |
| 33 | 528 | 573.944217687075 | -45.9442176870748 |
| 34 | 534 | 580.944217687075 | -46.9442176870748 |
| 35 | 518 | 565.144217687075 | -47.1442176870748 |
| 36 | 506 | 545.544217687075 | -39.5442176870748 |
| 37 | 502 | 551.986394557823 | -49.9863945578231 |
| 38 | 516 | 558.183673469388 | -42.1836734693878 |
| 39 | 528 | 562.183673469388 | -34.1836734693878 |
| 40 | 533 | 557.383673469388 | -24.3836734693878 |
| 41 | 536 | 547.183673469388 | -11.1836734693878 |
| 42 | 537 | 542.183673469388 | -5.18367346938776 |
| 43 | 524 | 529.183673469388 | -5.18367346938776 |
| 44 | 536 | 532.583673469388 | 3.41632653061225 |
| 45 | 587 | 584.583673469388 | 2.41632653061224 |
| 46 | 597 | 591.583673469388 | 5.41632653061224 |
| 47 | 581 | 575.783673469388 | 5.21632653061224 |
| 48 | 564 | 556.183673469388 | 7.81632653061225 |
| 49 | 558 | 551.986394557823 | 6.01360544217689 |
| 50 | 575 | 558.183673469388 | 16.8163265306123 |
| 51 | 580 | 562.183673469388 | 17.8163265306122 |
| 52 | 575 | 557.383673469388 | 17.6163265306122 |
| 53 | 563 | 547.183673469388 | 15.8163265306122 |
| 54 | 552 | 542.183673469388 | 9.81632653061224 |
| 55 | 537 | 529.183673469388 | 7.81632653061225 |
| 56 | 545 | 532.583673469388 | 12.4163265306123 |
| 57 | 601 | 584.583673469388 | 16.4163265306122 |
| 58 | 604 | 591.583673469388 | 12.4163265306122 |
| 59 | 586 | 575.783673469388 | 10.2163265306122 |
| 60 | 564 | 556.183673469388 | 7.81632653061225 |
| 61 | 549 | 551.986394557823 | -2.98639455782311 |
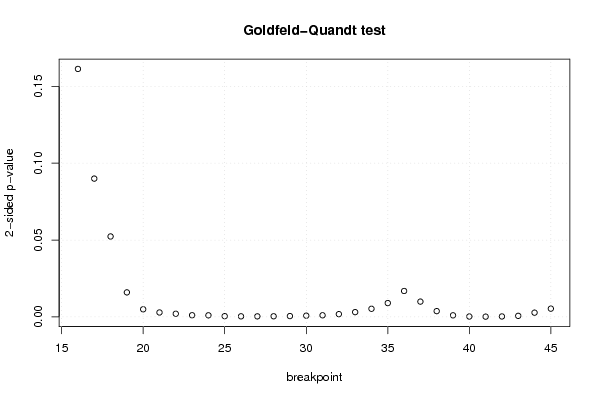
| Goldfeld-Quandt test for Heteroskedasticity | |||
| p-values | Alternative Hypothesis | ||
| breakpoint index | greater | 2-sided | less |
| 16 | 0.91932600235154 | 0.161347995296919 | 0.0806739976484595 |
| 17 | 0.955016470342562 | 0.0899670593148768 | 0.0449835296574384 |
| 18 | 0.97385126406117 | 0.0522974718776606 | 0.0261487359388303 |
| 19 | 0.992048797750323 | 0.0159024044993550 | 0.00795120224967752 |
| 20 | 0.997543289550355 | 0.00491342089928924 | 0.00245671044964462 |
| 21 | 0.99858388804382 | 0.00283222391236140 | 0.00141611195618070 |
| 22 | 0.999011321177394 | 0.00197735764521135 | 0.000988678822605676 |
| 23 | 0.999490634881303 | 0.00101873023739493 | 0.000509365118697467 |
| 24 | 0.999516219732954 | 0.000967560534091575 | 0.000483780267045787 |
| 25 | 0.99978576588727 | 0.000428468225460692 | 0.000214234112730346 |
| 26 | 0.999843905634964 | 0.000312188730072555 | 0.000156094365036278 |
| 27 | 0.999852406867019 | 0.000295186265962421 | 0.000147593132981210 |
| 28 | 0.999825696632566 | 0.000348606734868025 | 0.000174303367434013 |
| 29 | 0.99975621248701 | 0.000487575025978339 | 0.000243787512989170 |
| 30 | 0.999631703010466 | 0.000736593979068522 | 0.000368296989534261 |
| 31 | 0.999503625753755 | 0.000992748492490506 | 0.000496374246245253 |
| 32 | 0.999129089265477 | 0.00174182146904657 | 0.000870910734523286 |
| 33 | 0.99848047875307 | 0.00303904249386024 | 0.00151952124693012 |
| 34 | 0.99738339436255 | 0.00523321127489999 | 0.00261660563744999 |
| 35 | 0.995532457085976 | 0.00893508582804765 | 0.00446754291402383 |
| 36 | 0.991595603413326 | 0.0168087931733480 | 0.00840439658667401 |
| 37 | 0.995052444201836 | 0.00989511159632737 | 0.00494755579816368 |
| 38 | 0.998151989571896 | 0.00369602085620879 | 0.00184801042810440 |
| 39 | 0.999513416914768 | 0.000973166170464677 | 0.000486583085232338 |
| 40 | 0.999902013960632 | 0.000195972078735122 | 9.7986039367561e-05 |
| 41 | 0.999948766975025 | 0.000102466049949759 | 5.12330249748796e-05 |
| 42 | 0.999886751080518 | 0.000226497838963610 | 0.000113248919481805 |
| 43 | 0.999689305051771 | 0.000621389896457517 | 0.000310694948228759 |
| 44 | 0.998651317250684 | 0.00269736549863168 | 0.00134868274931584 |
| 45 | 0.997341099457962 | 0.00531780108407565 | 0.00265890054203782 |
| Meta Analysis of Goldfeld-Quandt test for Heteroskedasticity | |||
| Description | # significant tests | % significant tests | OK/NOK |
| 1% type I error level | 25 | 0.833333333333333 | NOK |
| 5% type I error level | 27 | 0.9 | NOK |
| 10% type I error level | 29 | 0.966666666666667 | NOK |