Free Statistics

of Irreproducible Research!

Author's title

Author*The author of this computation has been verified*
R Software Modulerwasp_arimabackwardselection.wasp
Title produced by softwareARIMA Backward Selection
Date of computationFri, 24 Dec 2010 15:54:46 +0000
Cite this page as followsStatistical Computations at FreeStatistics.org, Office for Research Development and Education, URL https://freestatistics.org/blog/index.php?v=date/2010/Dec/24/t129320597244cqzmvb551nzt9.htm/, Retrieved Tue, 30 Apr 2024 01:55:15 +0000
Statistical Computations at FreeStatistics.org, Office for Research Development and Education, URL https://freestatistics.org/blog/index.php?pk=115157, Retrieved Tue, 30 Apr 2024 01:55:15 +0000
QR Codes:

Original text written by user:
IsPrivate?No (this computation is public)
User-defined keywords
Estimated Impact134
Family? (F = Feedback message, R = changed R code, M = changed R Module, P = changed Parameters, D = changed Data)
-     [ARIMA Backward Selection] [] [2009-12-18 10:19:10] [ebd107afac1bd6180acb277edd05815b]
-    D    [ARIMA Backward Selection] [] [2010-12-24 15:54:46] [817f44ab92560f82acbc5e6c80d9a294] [Current]
Feedback Forum

Post a new message
Dataseries X:
19685.6
19601.7
16006.9
17681.2
19790.4
17014.2
17424.5
18908.9
15692.1
15160
15794.3
16032.1
16065
16236.8
12521
14762.1
15446.9
13635
14212.6
15021.7
14134.3
13721.4
14384.5
15638.6
19711.6
20359.8
16141.4
20056.9
20605.5
19325.8
20547.7
19211.2
19009.5
18746.8
16471.5
18957.2
20515.2
18374.4
16192.9
18147.5
19301.4
18344.7
17183.6
19630
17167.2
17428.5
16016.5
18466.5
18406.6
18174.1
14851.9
16260.7
18329.6
18003.8
15903.8
19554.2
16554.2
16198.9
16571.8
17535.2
16198.1


Summary of computational transaction
Raw Inputview raw input (R code)
Raw Outputview raw output of R engine
Computing time11 seconds
R Server'Sir Ronald Aylmer Fisher' @ 193.190.124.24

\begin{tabular}{lllllllll}
\hline
Summary of computational transaction \tabularnewline
Raw Input & view raw input (R code)  \tabularnewline
Raw Output & view raw output of R engine  \tabularnewline
Computing time & 11 seconds \tabularnewline
R Server & 'Sir Ronald Aylmer Fisher' @ 193.190.124.24 \tabularnewline
\hline
\end{tabular}
%Source: https://freestatistics.org/blog/index.php?pk=115157&T=0

[TABLE]
[ROW][C]Summary of computational transaction[/C][/ROW]
[ROW][C]Raw Input[/C][C]view raw input (R code) [/C][/ROW]
[ROW][C]Raw Output[/C][C]view raw output of R engine [/C][/ROW]
[ROW][C]Computing time[/C][C]11 seconds[/C][/ROW]
[ROW][C]R Server[/C][C]'Sir Ronald Aylmer Fisher' @ 193.190.124.24[/C][/ROW]
[/TABLE]
Source: https://freestatistics.org/blog/index.php?pk=115157&T=0

Globally Unique Identifier (entire table): ba.freestatistics.org/blog/index.php?pk=115157&T=0

As an alternative you can also use a QR Code:  

The GUIDs for individual cells are displayed in the table below:

Summary of computational transaction
Raw Inputview raw input (R code)
Raw Outputview raw output of R engine
Computing time11 seconds
R Server'Sir Ronald Aylmer Fisher' @ 193.190.124.24


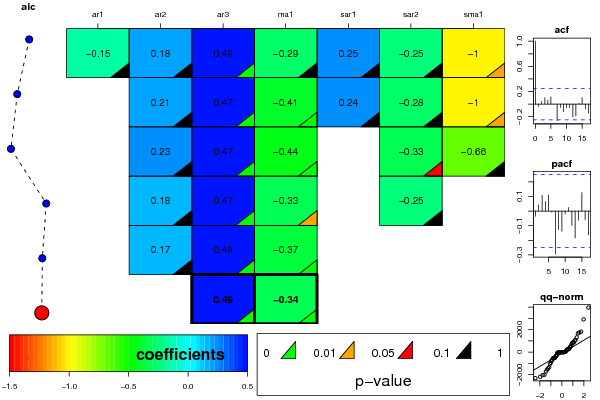
ARIMA Parameter Estimation and Backward Selection
Iterationar1ar2ar3ma1sar1sar2sma1
Estimates ( 1 )-0.15230.18040.4912-0.28960.2472-0.2523-0.9997
(p-val)(0.4766 )(0.2292 )(4e-04 )(0.2238 )(0.2623 )(0.2696 )(0.031 )
Estimates ( 2 )00.21220.469-0.40670.2395-0.2764-1.0002
(p-val)(NA )(0.1201 )(8e-04 )(0.0035 )(0.2658 )(0.2123 )(0.0315 )
Estimates ( 3 )00.22560.4673-0.43540-0.3344-0.6612
(p-val)(NA )(0.1323 )(0.0012 )(0.0025 )(NA )(0.0979 )(0.1453 )
Estimates ( 4 )00.17670.4749-0.32670-0.25410
(p-val)(NA )(0.1621 )(3e-04 )(0.0172 )(NA )(0.1989 )(NA )
Estimates ( 5 )00.17050.4877-0.3651000
(p-val)(NA )(0.1631 )(1e-04 )(0.0045 )(NA )(NA )(NA )
Estimates ( 6 )000.4909-0.3379000
(p-val)(NA )(NA )(2e-04 )(0.0044 )(NA )(NA )(NA )
Estimates ( 7 )NANANANANANANA
(p-val)(NA )(NA )(NA )(NA )(NA )(NA )(NA )
Estimates ( 8 )NANANANANANANA
(p-val)(NA )(NA )(NA )(NA )(NA )(NA )(NA )
Estimates ( 9 )NANANANANANANA
(p-val)(NA )(NA )(NA )(NA )(NA )(NA )(NA )
Estimates ( 10 )NANANANANANANA
(p-val)(NA )(NA )(NA )(NA )(NA )(NA )(NA )
Estimates ( 11 )NANANANANANANA
(p-val)(NA )(NA )(NA )(NA )(NA )(NA )(NA )
Estimates ( 12 )NANANANANANANA
(p-val)(NA )(NA )(NA )(NA )(NA )(NA )(NA )
Estimates ( 13 )NANANANANANANA
(p-val)(NA )(NA )(NA )(NA )(NA )(NA )(NA )

\begin{tabular}{lllllllll}
\hline
ARIMA Parameter Estimation and Backward Selection \tabularnewline
Iteration & ar1 & ar2 & ar3 & ma1 & sar1 & sar2 & sma1 \tabularnewline
Estimates ( 1 ) & -0.1523 & 0.1804 & 0.4912 & -0.2896 & 0.2472 & -0.2523 & -0.9997 \tabularnewline
(p-val) & (0.4766 ) & (0.2292 ) & (4e-04 ) & (0.2238 ) & (0.2623 ) & (0.2696 ) & (0.031 ) \tabularnewline
Estimates ( 2 ) & 0 & 0.2122 & 0.469 & -0.4067 & 0.2395 & -0.2764 & -1.0002 \tabularnewline
(p-val) & (NA ) & (0.1201 ) & (8e-04 ) & (0.0035 ) & (0.2658 ) & (0.2123 ) & (0.0315 ) \tabularnewline
Estimates ( 3 ) & 0 & 0.2256 & 0.4673 & -0.4354 & 0 & -0.3344 & -0.6612 \tabularnewline
(p-val) & (NA ) & (0.1323 ) & (0.0012 ) & (0.0025 ) & (NA ) & (0.0979 ) & (0.1453 ) \tabularnewline
Estimates ( 4 ) & 0 & 0.1767 & 0.4749 & -0.3267 & 0 & -0.2541 & 0 \tabularnewline
(p-val) & (NA ) & (0.1621 ) & (3e-04 ) & (0.0172 ) & (NA ) & (0.1989 ) & (NA ) \tabularnewline
Estimates ( 5 ) & 0 & 0.1705 & 0.4877 & -0.3651 & 0 & 0 & 0 \tabularnewline
(p-val) & (NA ) & (0.1631 ) & (1e-04 ) & (0.0045 ) & (NA ) & (NA ) & (NA ) \tabularnewline
Estimates ( 6 ) & 0 & 0 & 0.4909 & -0.3379 & 0 & 0 & 0 \tabularnewline
(p-val) & (NA ) & (NA ) & (2e-04 ) & (0.0044 ) & (NA ) & (NA ) & (NA ) \tabularnewline
Estimates ( 7 ) & NA & NA & NA & NA & NA & NA & NA \tabularnewline
(p-val) & (NA ) & (NA ) & (NA ) & (NA ) & (NA ) & (NA ) & (NA ) \tabularnewline
Estimates ( 8 ) & NA & NA & NA & NA & NA & NA & NA \tabularnewline
(p-val) & (NA ) & (NA ) & (NA ) & (NA ) & (NA ) & (NA ) & (NA ) \tabularnewline
Estimates ( 9 ) & NA & NA & NA & NA & NA & NA & NA \tabularnewline
(p-val) & (NA ) & (NA ) & (NA ) & (NA ) & (NA ) & (NA ) & (NA ) \tabularnewline
Estimates ( 10 ) & NA & NA & NA & NA & NA & NA & NA \tabularnewline
(p-val) & (NA ) & (NA ) & (NA ) & (NA ) & (NA ) & (NA ) & (NA ) \tabularnewline
Estimates ( 11 ) & NA & NA & NA & NA & NA & NA & NA \tabularnewline
(p-val) & (NA ) & (NA ) & (NA ) & (NA ) & (NA ) & (NA ) & (NA ) \tabularnewline
Estimates ( 12 ) & NA & NA & NA & NA & NA & NA & NA \tabularnewline
(p-val) & (NA ) & (NA ) & (NA ) & (NA ) & (NA ) & (NA ) & (NA ) \tabularnewline
Estimates ( 13 ) & NA & NA & NA & NA & NA & NA & NA \tabularnewline
(p-val) & (NA ) & (NA ) & (NA ) & (NA ) & (NA ) & (NA ) & (NA ) \tabularnewline
\hline
\end{tabular}
%Source: https://freestatistics.org/blog/index.php?pk=115157&T=1

[TABLE]
[ROW][C]ARIMA Parameter Estimation and Backward Selection[/C][/ROW]
[ROW][C]Iteration[/C][C]ar1[/C][C]ar2[/C][C]ar3[/C][C]ma1[/C][C]sar1[/C][C]sar2[/C][C]sma1[/C][/ROW]
[ROW][C]Estimates ( 1 )[/C][C]-0.1523[/C][C]0.1804[/C][C]0.4912[/C][C]-0.2896[/C][C]0.2472[/C][C]-0.2523[/C][C]-0.9997[/C][/ROW]
[ROW][C](p-val)[/C][C](0.4766 )[/C][C](0.2292 )[/C][C](4e-04 )[/C][C](0.2238 )[/C][C](0.2623 )[/C][C](0.2696 )[/C][C](0.031 )[/C][/ROW]
[ROW][C]Estimates ( 2 )[/C][C]0[/C][C]0.2122[/C][C]0.469[/C][C]-0.4067[/C][C]0.2395[/C][C]-0.2764[/C][C]-1.0002[/C][/ROW]
[ROW][C](p-val)[/C][C](NA )[/C][C](0.1201 )[/C][C](8e-04 )[/C][C](0.0035 )[/C][C](0.2658 )[/C][C](0.2123 )[/C][C](0.0315 )[/C][/ROW]
[ROW][C]Estimates ( 3 )[/C][C]0[/C][C]0.2256[/C][C]0.4673[/C][C]-0.4354[/C][C]0[/C][C]-0.3344[/C][C]-0.6612[/C][/ROW]
[ROW][C](p-val)[/C][C](NA )[/C][C](0.1323 )[/C][C](0.0012 )[/C][C](0.0025 )[/C][C](NA )[/C][C](0.0979 )[/C][C](0.1453 )[/C][/ROW]
[ROW][C]Estimates ( 4 )[/C][C]0[/C][C]0.1767[/C][C]0.4749[/C][C]-0.3267[/C][C]0[/C][C]-0.2541[/C][C]0[/C][/ROW]
[ROW][C](p-val)[/C][C](NA )[/C][C](0.1621 )[/C][C](3e-04 )[/C][C](0.0172 )[/C][C](NA )[/C][C](0.1989 )[/C][C](NA )[/C][/ROW]
[ROW][C]Estimates ( 5 )[/C][C]0[/C][C]0.1705[/C][C]0.4877[/C][C]-0.3651[/C][C]0[/C][C]0[/C][C]0[/C][/ROW]
[ROW][C](p-val)[/C][C](NA )[/C][C](0.1631 )[/C][C](1e-04 )[/C][C](0.0045 )[/C][C](NA )[/C][C](NA )[/C][C](NA )[/C][/ROW]
[ROW][C]Estimates ( 6 )[/C][C]0[/C][C]0[/C][C]0.4909[/C][C]-0.3379[/C][C]0[/C][C]0[/C][C]0[/C][/ROW]
[ROW][C](p-val)[/C][C](NA )[/C][C](NA )[/C][C](2e-04 )[/C][C](0.0044 )[/C][C](NA )[/C][C](NA )[/C][C](NA )[/C][/ROW]
[ROW][C]Estimates ( 7 )[/C][C]NA[/C][C]NA[/C][C]NA[/C][C]NA[/C][C]NA[/C][C]NA[/C][C]NA[/C][/ROW]
[ROW][C](p-val)[/C][C](NA )[/C][C](NA )[/C][C](NA )[/C][C](NA )[/C][C](NA )[/C][C](NA )[/C][C](NA )[/C][/ROW]
[ROW][C]Estimates ( 8 )[/C][C]NA[/C][C]NA[/C][C]NA[/C][C]NA[/C][C]NA[/C][C]NA[/C][C]NA[/C][/ROW]
[ROW][C](p-val)[/C][C](NA )[/C][C](NA )[/C][C](NA )[/C][C](NA )[/C][C](NA )[/C][C](NA )[/C][C](NA )[/C][/ROW]
[ROW][C]Estimates ( 9 )[/C][C]NA[/C][C]NA[/C][C]NA[/C][C]NA[/C][C]NA[/C][C]NA[/C][C]NA[/C][/ROW]
[ROW][C](p-val)[/C][C](NA )[/C][C](NA )[/C][C](NA )[/C][C](NA )[/C][C](NA )[/C][C](NA )[/C][C](NA )[/C][/ROW]
[ROW][C]Estimates ( 10 )[/C][C]NA[/C][C]NA[/C][C]NA[/C][C]NA[/C][C]NA[/C][C]NA[/C][C]NA[/C][/ROW]
[ROW][C](p-val)[/C][C](NA )[/C][C](NA )[/C][C](NA )[/C][C](NA )[/C][C](NA )[/C][C](NA )[/C][C](NA )[/C][/ROW]
[ROW][C]Estimates ( 11 )[/C][C]NA[/C][C]NA[/C][C]NA[/C][C]NA[/C][C]NA[/C][C]NA[/C][C]NA[/C][/ROW]
[ROW][C](p-val)[/C][C](NA )[/C][C](NA )[/C][C](NA )[/C][C](NA )[/C][C](NA )[/C][C](NA )[/C][C](NA )[/C][/ROW]
[ROW][C]Estimates ( 12 )[/C][C]NA[/C][C]NA[/C][C]NA[/C][C]NA[/C][C]NA[/C][C]NA[/C][C]NA[/C][/ROW]
[ROW][C](p-val)[/C][C](NA )[/C][C](NA )[/C][C](NA )[/C][C](NA )[/C][C](NA )[/C][C](NA )[/C][C](NA )[/C][/ROW]
[ROW][C]Estimates ( 13 )[/C][C]NA[/C][C]NA[/C][C]NA[/C][C]NA[/C][C]NA[/C][C]NA[/C][C]NA[/C][/ROW]
[ROW][C](p-val)[/C][C](NA )[/C][C](NA )[/C][C](NA )[/C][C](NA )[/C][C](NA )[/C][C](NA )[/C][C](NA )[/C][/ROW]
[/TABLE]
Source: https://freestatistics.org/blog/index.php?pk=115157&T=1

Globally Unique Identifier (entire table): ba.freestatistics.org/blog/index.php?pk=115157&T=1

As an alternative you can also use a QR Code:  

The GUIDs for individual cells are displayed in the table below:

ARIMA Parameter Estimation and Backward Selection
Iterationar1ar2ar3ma1sar1sar2sma1
Estimates ( 1 )-0.15230.18040.4912-0.28960.2472-0.2523-0.9997
(p-val)(0.4766 )(0.2292 )(4e-04 )(0.2238 )(0.2623 )(0.2696 )(0.031 )
Estimates ( 2 )00.21220.469-0.40670.2395-0.2764-1.0002
(p-val)(NA )(0.1201 )(8e-04 )(0.0035 )(0.2658 )(0.2123 )(0.0315 )
Estimates ( 3 )00.22560.4673-0.43540-0.3344-0.6612
(p-val)(NA )(0.1323 )(0.0012 )(0.0025 )(NA )(0.0979 )(0.1453 )
Estimates ( 4 )00.17670.4749-0.32670-0.25410
(p-val)(NA )(0.1621 )(3e-04 )(0.0172 )(NA )(0.1989 )(NA )
Estimates ( 5 )00.17050.4877-0.3651000
(p-val)(NA )(0.1631 )(1e-04 )(0.0045 )(NA )(NA )(NA )
Estimates ( 6 )000.4909-0.3379000
(p-val)(NA )(NA )(2e-04 )(0.0044 )(NA )(NA )(NA )
Estimates ( 7 )NANANANANANANA
(p-val)(NA )(NA )(NA )(NA )(NA )(NA )(NA )
Estimates ( 8 )NANANANANANANA
(p-val)(NA )(NA )(NA )(NA )(NA )(NA )(NA )
Estimates ( 9 )NANANANANANANA
(p-val)(NA )(NA )(NA )(NA )(NA )(NA )(NA )
Estimates ( 10 )NANANANANANANA
(p-val)(NA )(NA )(NA )(NA )(NA )(NA )(NA )
Estimates ( 11 )NANANANANANANA
(p-val)(NA )(NA )(NA )(NA )(NA )(NA )(NA )
Estimates ( 12 )NANANANANANANA
(p-val)(NA )(NA )(NA )(NA )(NA )(NA )(NA )
Estimates ( 13 )NANANANANANANA
(p-val)(NA )(NA )(NA )(NA )(NA )(NA )(NA )


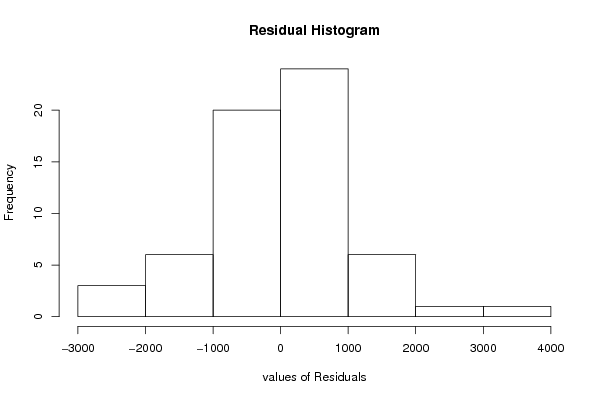
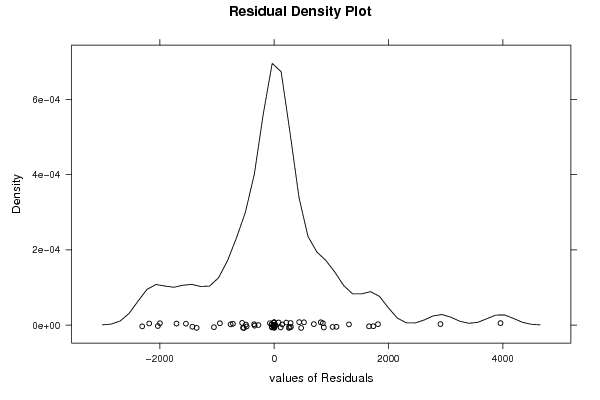
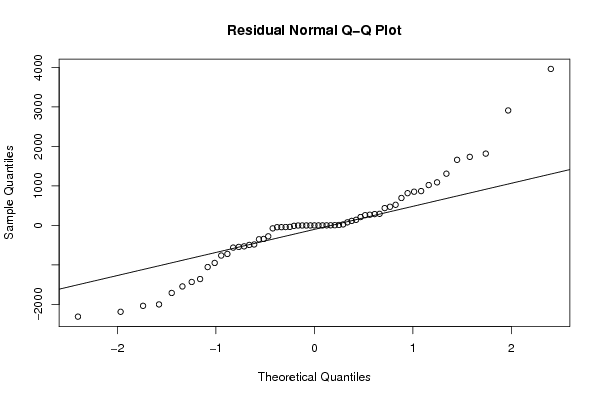
Estimated ARIMA Residuals
Value
-74.6915795638773
212.254697730591
-41.5511936661506
471.993871206887
-1356.78478851341
438.316374572804
293.380991648800
-37.9117683928118
1816.68987489069
816.11038731021
258.925702479984
-45.6248826681828
3960.39036987729
1735.14809352634
-1053.68791259641
-762.10853490894
-561.127620753853
286.904192766769
-44.3844668623980
-2186.13468440731
-482.002210181472
25.8471194482117
-1999.40184934386
141.474729104310
-2035.50278754068
-2309.10340024142
1021.93936558592
114.540206908403
1660.0702554509
270.085163129050
-1431.19472368068
2909.99760759191
-949.692196653628
694.398240429993
-342.623341162817
852.663100685635
-1709.35398897022
869.163287612745
-530.011730453785
-275.645283448380
78.1235588541858
1308.86905563902
-350.805682413949
522.033502131831
-494.184012644346
-544.431527076918
1090.47629136852
-721.25486445932
-1544.20677426309

\begin{tabular}{lllllllll}
\hline
Estimated ARIMA Residuals \tabularnewline
Value \tabularnewline
-74.6915795638773 \tabularnewline
212.254697730591 \tabularnewline
-41.5511936661506 \tabularnewline
471.993871206887 \tabularnewline
-1356.78478851341 \tabularnewline
438.316374572804 \tabularnewline
293.380991648800 \tabularnewline
-37.9117683928118 \tabularnewline
1816.68987489069 \tabularnewline
816.11038731021 \tabularnewline
258.925702479984 \tabularnewline
-45.6248826681828 \tabularnewline
3960.39036987729 \tabularnewline
1735.14809352634 \tabularnewline
-1053.68791259641 \tabularnewline
-762.10853490894 \tabularnewline
-561.127620753853 \tabularnewline
286.904192766769 \tabularnewline
-44.3844668623980 \tabularnewline
-2186.13468440731 \tabularnewline
-482.002210181472 \tabularnewline
25.8471194482117 \tabularnewline
-1999.40184934386 \tabularnewline
141.474729104310 \tabularnewline
-2035.50278754068 \tabularnewline
-2309.10340024142 \tabularnewline
1021.93936558592 \tabularnewline
114.540206908403 \tabularnewline
1660.0702554509 \tabularnewline
270.085163129050 \tabularnewline
-1431.19472368068 \tabularnewline
2909.99760759191 \tabularnewline
-949.692196653628 \tabularnewline
694.398240429993 \tabularnewline
-342.623341162817 \tabularnewline
852.663100685635 \tabularnewline
-1709.35398897022 \tabularnewline
869.163287612745 \tabularnewline
-530.011730453785 \tabularnewline
-275.645283448380 \tabularnewline
78.1235588541858 \tabularnewline
1308.86905563902 \tabularnewline
-350.805682413949 \tabularnewline
522.033502131831 \tabularnewline
-494.184012644346 \tabularnewline
-544.431527076918 \tabularnewline
1090.47629136852 \tabularnewline
-721.25486445932 \tabularnewline
-1544.20677426309 \tabularnewline
\hline
\end{tabular}
%Source: https://freestatistics.org/blog/index.php?pk=115157&T=2

[TABLE]
[ROW][C]Estimated ARIMA Residuals[/C][/ROW]
[ROW][C]Value[/C][/ROW]
[ROW][C]-74.6915795638773[/C][/ROW]
[ROW][C]212.254697730591[/C][/ROW]
[ROW][C]-41.5511936661506[/C][/ROW]
[ROW][C]471.993871206887[/C][/ROW]
[ROW][C]-1356.78478851341[/C][/ROW]
[ROW][C]438.316374572804[/C][/ROW]
[ROW][C]293.380991648800[/C][/ROW]
[ROW][C]-37.9117683928118[/C][/ROW]
[ROW][C]1816.68987489069[/C][/ROW]
[ROW][C]816.11038731021[/C][/ROW]
[ROW][C]258.925702479984[/C][/ROW]
[ROW][C]-45.6248826681828[/C][/ROW]
[ROW][C]3960.39036987729[/C][/ROW]
[ROW][C]1735.14809352634[/C][/ROW]
[ROW][C]-1053.68791259641[/C][/ROW]
[ROW][C]-762.10853490894[/C][/ROW]
[ROW][C]-561.127620753853[/C][/ROW]
[ROW][C]286.904192766769[/C][/ROW]
[ROW][C]-44.3844668623980[/C][/ROW]
[ROW][C]-2186.13468440731[/C][/ROW]
[ROW][C]-482.002210181472[/C][/ROW]
[ROW][C]25.8471194482117[/C][/ROW]
[ROW][C]-1999.40184934386[/C][/ROW]
[ROW][C]141.474729104310[/C][/ROW]
[ROW][C]-2035.50278754068[/C][/ROW]
[ROW][C]-2309.10340024142[/C][/ROW]
[ROW][C]1021.93936558592[/C][/ROW]
[ROW][C]114.540206908403[/C][/ROW]
[ROW][C]1660.0702554509[/C][/ROW]
[ROW][C]270.085163129050[/C][/ROW]
[ROW][C]-1431.19472368068[/C][/ROW]
[ROW][C]2909.99760759191[/C][/ROW]
[ROW][C]-949.692196653628[/C][/ROW]
[ROW][C]694.398240429993[/C][/ROW]
[ROW][C]-342.623341162817[/C][/ROW]
[ROW][C]852.663100685635[/C][/ROW]
[ROW][C]-1709.35398897022[/C][/ROW]
[ROW][C]869.163287612745[/C][/ROW]
[ROW][C]-530.011730453785[/C][/ROW]
[ROW][C]-275.645283448380[/C][/ROW]
[ROW][C]78.1235588541858[/C][/ROW]
[ROW][C]1308.86905563902[/C][/ROW]
[ROW][C]-350.805682413949[/C][/ROW]
[ROW][C]522.033502131831[/C][/ROW]
[ROW][C]-494.184012644346[/C][/ROW]
[ROW][C]-544.431527076918[/C][/ROW]
[ROW][C]1090.47629136852[/C][/ROW]
[ROW][C]-721.25486445932[/C][/ROW]
[ROW][C]-1544.20677426309[/C][/ROW]
[/TABLE]
Source: https://freestatistics.org/blog/index.php?pk=115157&T=2

Globally Unique Identifier (entire table): ba.freestatistics.org/blog/index.php?pk=115157&T=2

As an alternative you can also use a QR Code:  

The GUIDs for individual cells are displayed in the table below:

Estimated ARIMA Residuals
Value
-74.6915795638773
212.254697730591
-41.5511936661506
471.993871206887
-1356.78478851341
438.316374572804
293.380991648800
-37.9117683928118
1816.68987489069
816.11038731021
258.925702479984
-45.6248826681828
3960.39036987729
1735.14809352634
-1053.68791259641
-762.10853490894
-561.127620753853
286.904192766769
-44.3844668623980
-2186.13468440731
-482.002210181472
25.8471194482117
-1999.40184934386
141.474729104310
-2035.50278754068
-2309.10340024142
1021.93936558592
114.540206908403
1660.0702554509
270.085163129050
-1431.19472368068
2909.99760759191
-949.692196653628
694.398240429993
-342.623341162817
852.663100685635
-1709.35398897022
869.163287612745
-530.011730453785
-275.645283448380
78.1235588541858
1308.86905563902
-350.805682413949
522.033502131831
-494.184012644346
-544.431527076918
1090.47629136852
-721.25486445932
-1544.20677426309


Parameters (Session):
par1 = FALSE ; par2 = 1 ; par3 = 1 ; par4 = 1 ; par5 = 12 ; par6 = 3 ; par7 = 1 ; par8 = 2 ; par9 = 1 ;
Parameters (R input):
par1 = FALSE ; par2 = 1 ; par3 = 1 ; par4 = 1 ; par5 = 12 ; par6 = 3 ; par7 = 1 ; par8 = 2 ; par9 = 1 ;
R code (references can be found in the software module):
library(lattice)
if (par1 == 'TRUE') par1 <- TRUE
if (par1 == 'FALSE') par1 <- FALSE
par2 <- as.numeric(par2) #Box-Cox lambda transformation parameter
par3 <- as.numeric(par3) #degree of non-seasonal differencing
par4 <- as.numeric(par4) #degree of seasonal differencing
par5 <- as.numeric(par5) #seasonal period
par6 <- as.numeric(par6) #degree (p) of the non-seasonal AR(p) polynomial
par7 <- as.numeric(par7) #degree (q) of the non-seasonal MA(q) polynomial
par8 <- as.numeric(par8) #degree (P) of the seasonal AR(P) polynomial
par9 <- as.numeric(par9) #degree (Q) of the seasonal MA(Q) polynomial
armaGR <- function(arima.out, names, n){
try1 <- arima.out$coef
try2 <- sqrt(diag(arima.out$var.coef))
try.data.frame <- data.frame(matrix(NA,ncol=4,nrow=length(names)))
dimnames(try.data.frame) <- list(names,c('coef','std','tstat','pv'))
try.data.frame[,1] <- try1
for(i in 1:length(try2)) try.data.frame[which(rownames(try.data.frame)==names(try2)[i]),2] <- try2[i]
try.data.frame[,3] <- try.data.frame[,1] / try.data.frame[,2]
try.data.frame[,4] <- round((1-pt(abs(try.data.frame[,3]),df=n-(length(try2)+1)))*2,5)
vector <- rep(NA,length(names))
vector[is.na(try.data.frame[,4])] <- 0
maxi <- which.max(try.data.frame[,4])
continue <- max(try.data.frame[,4],na.rm=TRUE) > .05
vector[maxi] <- 0
list(summary=try.data.frame,next.vector=vector,continue=continue)
}
arimaSelect <- function(series, order=c(13,0,0), seasonal=list(order=c(2,0,0),period=12), include.mean=F){
nrc <- order[1]+order[3]+seasonal$order[1]+seasonal$order[3]
coeff <- matrix(NA, nrow=nrc*2, ncol=nrc)
pval <- matrix(NA, nrow=nrc*2, ncol=nrc)
mylist <- rep(list(NULL), nrc)
names <- NULL
if(order[1] > 0) names <- paste('ar',1:order[1],sep='')
if(order[3] > 0) names <- c( names , paste('ma',1:order[3],sep='') )
if(seasonal$order[1] > 0) names <- c(names, paste('sar',1:seasonal$order[1],sep=''))
if(seasonal$order[3] > 0) names <- c(names, paste('sma',1:seasonal$order[3],sep=''))
arima.out <- arima(series, order=order, seasonal=seasonal, include.mean=include.mean, method='ML')
mylist[[1]] <- arima.out
last.arma <- armaGR(arima.out, names, length(series))
mystop <- FALSE
i <- 1
coeff[i,] <- last.arma[[1]][,1]
pval [i,] <- last.arma[[1]][,4]
i <- 2
aic <- arima.out$aic
while(!mystop){
mylist[[i]] <- arima.out
arima.out <- arima(series, order=order, seasonal=seasonal, include.mean=include.mean, method='ML', fixed=last.arma$next.vector)
aic <- c(aic, arima.out$aic)
last.arma <- armaGR(arima.out, names, length(series))
mystop <- !last.arma$continue
coeff[i,] <- last.arma[[1]][,1]
pval [i,] <- last.arma[[1]][,4]
i <- i+1
}
list(coeff, pval, mylist, aic=aic)
}
arimaSelectplot <- function(arimaSelect.out,noms,choix){
noms <- names(arimaSelect.out[[3]][[1]]$coef)
coeff <- arimaSelect.out[[1]]
k <- min(which(is.na(coeff[,1])))-1
coeff <- coeff[1:k,]
pval <- arimaSelect.out[[2]][1:k,]
aic <- arimaSelect.out$aic[1:k]
coeff[coeff==0] <- NA
n <- ncol(coeff)
if(missing(choix)) choix <- k
layout(matrix(c(1,1,1,2,
3,3,3,2,
3,3,3,4,
5,6,7,7),nr=4),
widths=c(10,35,45,15),
heights=c(30,30,15,15))
couleurs <- rainbow(75)[1:50]#(50)
ticks <- pretty(coeff)
par(mar=c(1,1,3,1))
plot(aic,k:1-.5,type='o',pch=21,bg='blue',cex=2,axes=F,lty=2,xpd=NA)
points(aic[choix],k-choix+.5,pch=21,cex=4,bg=2,xpd=NA)
title('aic',line=2)
par(mar=c(3,0,0,0))
plot(0,axes=F,xlab='',ylab='',xlim=range(ticks),ylim=c(.1,1))
rect(xleft = min(ticks) + (0:49)/50*(max(ticks)-min(ticks)),
xright = min(ticks) + (1:50)/50*(max(ticks)-min(ticks)),
ytop = rep(1,50),
ybottom= rep(0,50),col=couleurs,border=NA)
axis(1,ticks)
rect(xleft=min(ticks),xright=max(ticks),ytop=1,ybottom=0)
text(mean(coeff,na.rm=T),.5,'coefficients',cex=2,font=2)
par(mar=c(1,1,3,1))
image(1:n,1:k,t(coeff[k:1,]),axes=F,col=couleurs,zlim=range(ticks))
for(i in 1:n) for(j in 1:k) if(!is.na(coeff[j,i])) {
if(pval[j,i]<.01) symb = 'green'
else if( (pval[j,i]<.05) & (pval[j,i]>=.01)) symb = 'orange'
else if( (pval[j,i]<.1) & (pval[j,i]>=.05)) symb = 'red'
else symb = 'black'
polygon(c(i+.5 ,i+.2 ,i+.5 ,i+.5),
c(k-j+0.5,k-j+0.5,k-j+0.8,k-j+0.5),
col=symb)
if(j==choix) {
rect(xleft=i-.5,
xright=i+.5,
ybottom=k-j+1.5,
ytop=k-j+.5,
lwd=4)
text(i,
k-j+1,
round(coeff[j,i],2),
cex=1.2,
font=2)
}
else{
rect(xleft=i-.5,xright=i+.5,ybottom=k-j+1.5,ytop=k-j+.5)
text(i,k-j+1,round(coeff[j,i],2),cex=1.2,font=1)
}
}
axis(3,1:n,noms)
par(mar=c(0.5,0,0,0.5))
plot(0,axes=F,xlab='',ylab='',type='n',xlim=c(0,8),ylim=c(-.2,.8))
cols <- c('green','orange','red','black')
niv <- c('0','0.01','0.05','0.1')
for(i in 0:3){
polygon(c(1+2*i ,1+2*i ,1+2*i-.5 ,1+2*i),
c(.4 ,.7 , .4 , .4),
col=cols[i+1])
text(2*i,0.5,niv[i+1],cex=1.5)
}
text(8,.5,1,cex=1.5)
text(4,0,'p-value',cex=2)
box()
residus <- arimaSelect.out[[3]][[choix]]$res
par(mar=c(1,2,4,1))
acf(residus,main='')
title('acf',line=.5)
par(mar=c(1,2,4,1))
pacf(residus,main='')
title('pacf',line=.5)
par(mar=c(2,2,4,1))
qqnorm(residus,main='')
title('qq-norm',line=.5)
qqline(residus)
residus
}
if (par2 == 0) x <- log(x)
if (par2 != 0) x <- x^par2
(selection <- arimaSelect(x, order=c(par6,par3,par7), seasonal=list(order=c(par8,par4,par9), period=par5)))
bitmap(file='test1.png')
resid <- arimaSelectplot(selection)
dev.off()
resid
bitmap(file='test2.png')
acf(resid,length(resid)/2, main='Residual Autocorrelation Function')
dev.off()
bitmap(file='test3.png')
pacf(resid,length(resid)/2, main='Residual Partial Autocorrelation Function')
dev.off()
bitmap(file='test4.png')
cpgram(resid, main='Residual Cumulative Periodogram')
dev.off()
bitmap(file='test5.png')
hist(resid, main='Residual Histogram', xlab='values of Residuals')
dev.off()
bitmap(file='test6.png')
densityplot(~resid,col='black',main='Residual Density Plot', xlab='values of Residuals')
dev.off()
bitmap(file='test7.png')
qqnorm(resid, main='Residual Normal Q-Q Plot')
qqline(resid)
dev.off()
ncols <- length(selection[[1]][1,])
nrows <- length(selection[[2]][,1])-1
load(file='createtable')
a<-table.start()
a<-table.row.start(a)
a<-table.element(a,'ARIMA Parameter Estimation and Backward Selection', ncols+1,TRUE)
a<-table.row.end(a)
a<-table.row.start(a)
a<-table.element(a,'Iteration', header=TRUE)
for (i in 1:ncols) {
a<-table.element(a,names(selection[[3]][[1]]$coef)[i],header=TRUE)
}
a<-table.row.end(a)
for (j in 1:nrows) {
a<-table.row.start(a)
mydum <- 'Estimates ('
mydum <- paste(mydum,j)
mydum <- paste(mydum,')')
a<-table.element(a,mydum, header=TRUE)
for (i in 1:ncols) {
a<-table.element(a,round(selection[[1]][j,i],4))
}
a<-table.row.end(a)
a<-table.row.start(a)
a<-table.element(a,'(p-val)', header=TRUE)
for (i in 1:ncols) {
mydum <- '('
mydum <- paste(mydum,round(selection[[2]][j,i],4),sep='')
mydum <- paste(mydum,')')
a<-table.element(a,mydum)
}
a<-table.row.end(a)
}
a<-table.end(a)
table.save(a,file='mytable.tab')
a<-table.start()
a<-table.row.start(a)
a<-table.element(a,'Estimated ARIMA Residuals', 1,TRUE)
a<-table.row.end(a)
a<-table.row.start(a)
a<-table.element(a,'Value', 1,TRUE)
a<-table.row.end(a)
for (i in (par4*par5+par3):length(resid)) {
a<-table.row.start(a)
a<-table.element(a,resid[i])
a<-table.row.end(a)
}
a<-table.end(a)
table.save(a,file='mytable1.tab')