Free Statistics
of Irreproducible Research!
Description of Statistical Computation | |||||||||||||||||||||||||||||||||||||||||
|---|---|---|---|---|---|---|---|---|---|---|---|---|---|---|---|---|---|---|---|---|---|---|---|---|---|---|---|---|---|---|---|---|---|---|---|---|---|---|---|---|---|
| Author's title | |||||||||||||||||||||||||||||||||||||||||
| Author | *The author of this computation has been verified* | ||||||||||||||||||||||||||||||||||||||||
| R Software Module | rwasp_univariatedataseries.wasp | ||||||||||||||||||||||||||||||||||||||||
| Title produced by software | Univariate Data Series | ||||||||||||||||||||||||||||||||||||||||
| Date of computation | Fri, 24 Dec 2010 15:51:03 +0000 | ||||||||||||||||||||||||||||||||||||||||
| Cite this page as follows | Statistical Computations at FreeStatistics.org, Office for Research Development and Education, URL https://freestatistics.org/blog/index.php?v=date/2010/Dec/24/t12932057208m5vhhzawx4itod.htm/, Retrieved Tue, 30 Apr 2024 01:21:36 +0000 | ||||||||||||||||||||||||||||||||||||||||
| Statistical Computations at FreeStatistics.org, Office for Research Development and Education, URL https://freestatistics.org/blog/index.php?pk=115152, Retrieved Tue, 30 Apr 2024 01:21:36 +0000 | |||||||||||||||||||||||||||||||||||||||||
| QR Codes: | |||||||||||||||||||||||||||||||||||||||||
|
| |||||||||||||||||||||||||||||||||||||||||
| Original text written by user: | |||||||||||||||||||||||||||||||||||||||||
| IsPrivate? | No (this computation is public) | ||||||||||||||||||||||||||||||||||||||||
| User-defined keywords | |||||||||||||||||||||||||||||||||||||||||
| Estimated Impact | 135 | ||||||||||||||||||||||||||||||||||||||||
Tree of Dependent Computations | |||||||||||||||||||||||||||||||||||||||||
| Family? (F = Feedback message, R = changed R code, M = changed R Module, P = changed Parameters, D = changed Data) | |||||||||||||||||||||||||||||||||||||||||
| - [Univariate Data Series] [] [2009-10-12 09:03:04] [ebd107afac1bd6180acb277edd05815b] - MPD [Univariate Data Series] [Paper uitvoer bel...] [2010-11-30 11:19:39] [247f085ab5b7724f755ad01dc754a3e8] - R PD [Univariate Data Series] [paperUNI_uit] [2010-12-24 12:41:23] [7e261c986c934df955dd3ac53e9d45c6] - P [Univariate Data Series] [Kristof Nagels] [2010-12-24 15:51:03] [fff0a1ca5ad3b1801f382406d5a383a7] [Current] | |||||||||||||||||||||||||||||||||||||||||
| Feedback Forum | |||||||||||||||||||||||||||||||||||||||||
Post a new message | |||||||||||||||||||||||||||||||||||||||||
Dataset | |||||||||||||||||||||||||||||||||||||||||
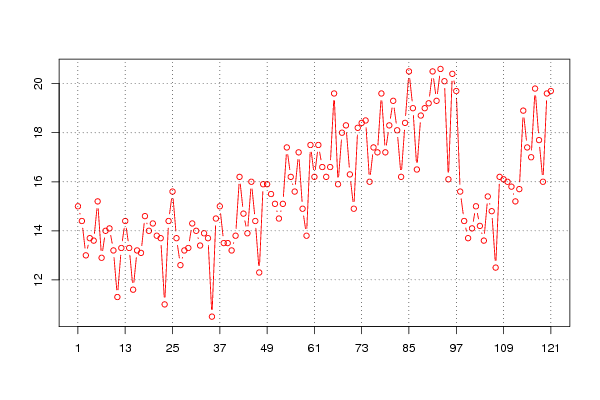
| Dataseries X: | |||||||||||||||||||||||||||||||||||||||||
15 14,4 13 13,7 13,6 15,2 12,9 14 14,1 13,2 11,3 13,3 14,4 13,3 11,6 13,2 13,1 14,6 14 14,3 13,8 13,7 11 14,4 15,6 13,7 12,6 13,2 13,3 14,3 14 13,4 13,9 13,7 10,5 14,5 15 13,5 13,5 13,2 13,8 16,2 14,7 13,9 16 14,4 12,3 15,9 15,9 15,5 15,1 14,5 15,1 17,4 16,2 15,6 17,2 14,9 13,8 17,5 16,2 17,5 16,6 16,2 16,6 19,6 15,9 18 18,3 16,3 14,9 18,2 18,4 18,5 16 17,4 17,2 19,6 17,2 18,3 19,3 18,1 16,2 18,4 20,5 19 16,5 18,7 19 19,2 20,5 19,3 20,6 20,1 16,1 20,4 19,7 15,6 14,4 13,7 14,1 15 14,2 13,6 15,4 14,8 12,5 16,2 16,1 16 15,8 15,2 15,7 18,9 17,4 17 19,8 17,7 16 19,6 19,7 | |||||||||||||||||||||||||||||||||||||||||
Tables (Output of Computation) | |||||||||||||||||||||||||||||||||||||||||
| |||||||||||||||||||||||||||||||||||||||||
Figures (Output of Computation) | |||||||||||||||||||||||||||||||||||||||||
Input Parameters & R Code | |||||||||||||||||||||||||||||||||||||||||
| Parameters (Session): | |||||||||||||||||||||||||||||||||||||||||
| par1 = 60 ; par2 = 1 ; par3 = 1 ; par4 = 0 ; par5 = 12 ; par6 = White Noise ; par7 = 0.95 ; | |||||||||||||||||||||||||||||||||||||||||
| Parameters (R input): | |||||||||||||||||||||||||||||||||||||||||
| par1 = uitvoer België ; par2 = ; par3 = ; par4 = 12 ; par5 = ; par6 = ; par7 = ; par8 = ; par9 = ; par10 = ; par11 = ; par12 = ; par13 = ; par14 = ; par15 = ; par16 = ; par17 = ; par18 = ; par19 = ; par20 = ; | |||||||||||||||||||||||||||||||||||||||||
| R code (references can be found in the software module): | |||||||||||||||||||||||||||||||||||||||||
if (par4 != 'No season') { | |||||||||||||||||||||||||||||||||||||||||