Free Statistics

of Irreproducible Research!

Author's title

Author*The author of this computation has been verified*
R Software Modulerwasp_arimaforecasting.wasp
Title produced by softwareARIMA Forecasting
Date of computationFri, 24 Dec 2010 15:07:00 +0000
Cite this page as followsStatistical Computations at FreeStatistics.org, Office for Research Development and Education, URL https://freestatistics.org/blog/index.php?v=date/2010/Dec/24/t12932031096f2rwdynalh9ul3.htm/, Retrieved Tue, 30 Apr 2024 03:55:44 +0000
Statistical Computations at FreeStatistics.org, Office for Research Development and Education, URL https://freestatistics.org/blog/index.php?pk=115064, Retrieved Tue, 30 Apr 2024 03:55:44 +0000
QR Codes:

Original text written by user:
IsPrivate?No (this computation is public)
User-defined keywords
Estimated Impact107
Family? (F = Feedback message, R = changed R code, M = changed R Module, P = changed Parameters, D = changed Data)
-       [ARIMA Forecasting] [] [2010-12-24 15:07:00] [5e4b6b538311b7e958647ef5010fb0e5] [Current]
Feedback Forum

Post a new message
Dataseries X:
740
691
683
594
729
731
386
331
706
715
657
653
642
643
718
654
632
731
392
344
792
852
649
629
685
617
715
715
629
916
531
357
917
828
708
858
775
785
1006
789
734
906
532
387
991
841
892
782


Summary of computational transaction
Raw Inputview raw input (R code)
Raw Outputview raw output of R engine
Computing time13 seconds
R Server'George Udny Yule' @ 72.249.76.132

\begin{tabular}{lllllllll}
\hline
Summary of computational transaction \tabularnewline
Raw Input & view raw input (R code)  \tabularnewline
Raw Output & view raw output of R engine  \tabularnewline
Computing time & 13 seconds \tabularnewline
R Server & 'George Udny Yule' @ 72.249.76.132 \tabularnewline
\hline
\end{tabular}
%Source: https://freestatistics.org/blog/index.php?pk=115064&T=0

[TABLE]
[ROW][C]Summary of computational transaction[/C][/ROW]
[ROW][C]Raw Input[/C][C]view raw input (R code) [/C][/ROW]
[ROW][C]Raw Output[/C][C]view raw output of R engine [/C][/ROW]
[ROW][C]Computing time[/C][C]13 seconds[/C][/ROW]
[ROW][C]R Server[/C][C]'George Udny Yule' @ 72.249.76.132[/C][/ROW]
[/TABLE]
Source: https://freestatistics.org/blog/index.php?pk=115064&T=0

Globally Unique Identifier (entire table): ba.freestatistics.org/blog/index.php?pk=115064&T=0

As an alternative you can also use a QR Code:  

The GUIDs for individual cells are displayed in the table below:

Summary of computational transaction
Raw Inputview raw input (R code)
Raw Outputview raw output of R engine
Computing time13 seconds
R Server'George Udny Yule' @ 72.249.76.132


Univariate ARIMA Extrapolation Forecast
timeY[t]F[t]95% LB95% UBp-value(H0: Y[t] = F[t])P(F[t]>Y[t-1])P(F[t]>Y[t-s])P(F[t]>Y[36])
24629-------
25685-------
26617-------
27715-------
28715-------
29629-------
30916-------
31531-------
32357-------
33917-------
34828-------
35708-------
36858-------
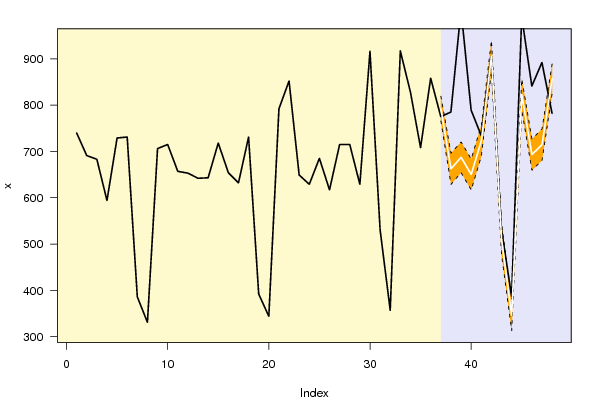
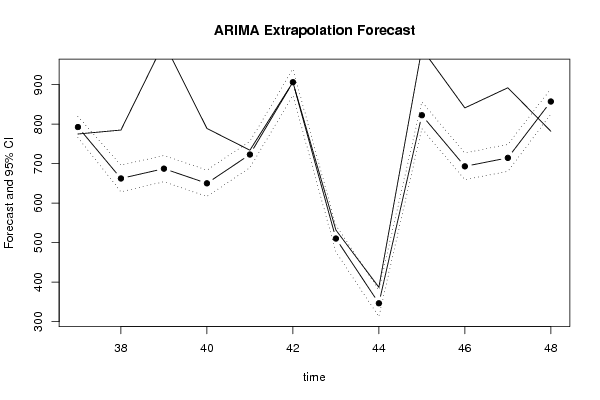
37775792.572765.7959819.3480.0992010
38785662.457628.7023696.2117000.99580
391006687.2676654.1687720.3666000.05030
40789650.166616.7897683.5423001e-040
41734723.0601689.6369756.48320.26061e-0410
42906906.0763872.5162939.63640.498210.28110.9975
43532510.3801476.6377544.12260.104600.11550
44387346.4943312.6914380.29710.009400.27120
45991822.4618788.6994856.22420100.0196
46841693.1114659.3792726.84350000
47892714.5729680.5733748.5724000.64760
48782857.1962824.9617889.430800.01720.48050.4805

\begin{tabular}{lllllllll}
\hline
Univariate ARIMA Extrapolation Forecast \tabularnewline
time & Y[t] & F[t] & 95% LB & 95% UB & p-value(H0: Y[t] = F[t]) & P(F[t]>Y[t-1]) & P(F[t]>Y[t-s]) & P(F[t]>Y[36]) \tabularnewline
24 & 629 & - & - & - & - & - & - & - \tabularnewline
25 & 685 & - & - & - & - & - & - & - \tabularnewline
26 & 617 & - & - & - & - & - & - & - \tabularnewline
27 & 715 & - & - & - & - & - & - & - \tabularnewline
28 & 715 & - & - & - & - & - & - & - \tabularnewline
29 & 629 & - & - & - & - & - & - & - \tabularnewline
30 & 916 & - & - & - & - & - & - & - \tabularnewline
31 & 531 & - & - & - & - & - & - & - \tabularnewline
32 & 357 & - & - & - & - & - & - & - \tabularnewline
33 & 917 & - & - & - & - & - & - & - \tabularnewline
34 & 828 & - & - & - & - & - & - & - \tabularnewline
35 & 708 & - & - & - & - & - & - & - \tabularnewline
36 & 858 & - & - & - & - & - & - & - \tabularnewline
37 & 775 & 792.572 & 765.7959 & 819.348 & 0.0992 & 0 & 1 & 0 \tabularnewline
38 & 785 & 662.457 & 628.7023 & 696.2117 & 0 & 0 & 0.9958 & 0 \tabularnewline
39 & 1006 & 687.2676 & 654.1687 & 720.3666 & 0 & 0 & 0.0503 & 0 \tabularnewline
40 & 789 & 650.166 & 616.7897 & 683.5423 & 0 & 0 & 1e-04 & 0 \tabularnewline
41 & 734 & 723.0601 & 689.6369 & 756.4832 & 0.2606 & 1e-04 & 1 & 0 \tabularnewline
42 & 906 & 906.0763 & 872.5162 & 939.6364 & 0.4982 & 1 & 0.2811 & 0.9975 \tabularnewline
43 & 532 & 510.3801 & 476.6377 & 544.1226 & 0.1046 & 0 & 0.1155 & 0 \tabularnewline
44 & 387 & 346.4943 & 312.6914 & 380.2971 & 0.0094 & 0 & 0.2712 & 0 \tabularnewline
45 & 991 & 822.4618 & 788.6994 & 856.2242 & 0 & 1 & 0 & 0.0196 \tabularnewline
46 & 841 & 693.1114 & 659.3792 & 726.8435 & 0 & 0 & 0 & 0 \tabularnewline
47 & 892 & 714.5729 & 680.5733 & 748.5724 & 0 & 0 & 0.6476 & 0 \tabularnewline
48 & 782 & 857.1962 & 824.9617 & 889.4308 & 0 & 0.0172 & 0.4805 & 0.4805 \tabularnewline
\hline
\end{tabular}
%Source: https://freestatistics.org/blog/index.php?pk=115064&T=1

[TABLE]
[ROW][C]Univariate ARIMA Extrapolation Forecast[/C][/ROW]
[ROW][C]time[/C][C]Y[t][/C][C]F[t][/C][C]95% LB[/C][C]95% UB[/C][C]p-value(H0: Y[t] = F[t])[/C][C]P(F[t]>Y[t-1])[/C][C]P(F[t]>Y[t-s])[/C][C]P(F[t]>Y[36])[/C][/ROW]
[ROW][C]24[/C][C]629[/C][C]-[/C][C]-[/C][C]-[/C][C]-[/C][C]-[/C][C]-[/C][C]-[/C][/ROW]
[ROW][C]25[/C][C]685[/C][C]-[/C][C]-[/C][C]-[/C][C]-[/C][C]-[/C][C]-[/C][C]-[/C][/ROW]
[ROW][C]26[/C][C]617[/C][C]-[/C][C]-[/C][C]-[/C][C]-[/C][C]-[/C][C]-[/C][C]-[/C][/ROW]
[ROW][C]27[/C][C]715[/C][C]-[/C][C]-[/C][C]-[/C][C]-[/C][C]-[/C][C]-[/C][C]-[/C][/ROW]
[ROW][C]28[/C][C]715[/C][C]-[/C][C]-[/C][C]-[/C][C]-[/C][C]-[/C][C]-[/C][C]-[/C][/ROW]
[ROW][C]29[/C][C]629[/C][C]-[/C][C]-[/C][C]-[/C][C]-[/C][C]-[/C][C]-[/C][C]-[/C][/ROW]
[ROW][C]30[/C][C]916[/C][C]-[/C][C]-[/C][C]-[/C][C]-[/C][C]-[/C][C]-[/C][C]-[/C][/ROW]
[ROW][C]31[/C][C]531[/C][C]-[/C][C]-[/C][C]-[/C][C]-[/C][C]-[/C][C]-[/C][C]-[/C][/ROW]
[ROW][C]32[/C][C]357[/C][C]-[/C][C]-[/C][C]-[/C][C]-[/C][C]-[/C][C]-[/C][C]-[/C][/ROW]
[ROW][C]33[/C][C]917[/C][C]-[/C][C]-[/C][C]-[/C][C]-[/C][C]-[/C][C]-[/C][C]-[/C][/ROW]
[ROW][C]34[/C][C]828[/C][C]-[/C][C]-[/C][C]-[/C][C]-[/C][C]-[/C][C]-[/C][C]-[/C][/ROW]
[ROW][C]35[/C][C]708[/C][C]-[/C][C]-[/C][C]-[/C][C]-[/C][C]-[/C][C]-[/C][C]-[/C][/ROW]
[ROW][C]36[/C][C]858[/C][C]-[/C][C]-[/C][C]-[/C][C]-[/C][C]-[/C][C]-[/C][C]-[/C][/ROW]
[ROW][C]37[/C][C]775[/C][C]792.572[/C][C]765.7959[/C][C]819.348[/C][C]0.0992[/C][C]0[/C][C]1[/C][C]0[/C][/ROW]
[ROW][C]38[/C][C]785[/C][C]662.457[/C][C]628.7023[/C][C]696.2117[/C][C]0[/C][C]0[/C][C]0.9958[/C][C]0[/C][/ROW]
[ROW][C]39[/C][C]1006[/C][C]687.2676[/C][C]654.1687[/C][C]720.3666[/C][C]0[/C][C]0[/C][C]0.0503[/C][C]0[/C][/ROW]
[ROW][C]40[/C][C]789[/C][C]650.166[/C][C]616.7897[/C][C]683.5423[/C][C]0[/C][C]0[/C][C]1e-04[/C][C]0[/C][/ROW]
[ROW][C]41[/C][C]734[/C][C]723.0601[/C][C]689.6369[/C][C]756.4832[/C][C]0.2606[/C][C]1e-04[/C][C]1[/C][C]0[/C][/ROW]
[ROW][C]42[/C][C]906[/C][C]906.0763[/C][C]872.5162[/C][C]939.6364[/C][C]0.4982[/C][C]1[/C][C]0.2811[/C][C]0.9975[/C][/ROW]
[ROW][C]43[/C][C]532[/C][C]510.3801[/C][C]476.6377[/C][C]544.1226[/C][C]0.1046[/C][C]0[/C][C]0.1155[/C][C]0[/C][/ROW]
[ROW][C]44[/C][C]387[/C][C]346.4943[/C][C]312.6914[/C][C]380.2971[/C][C]0.0094[/C][C]0[/C][C]0.2712[/C][C]0[/C][/ROW]
[ROW][C]45[/C][C]991[/C][C]822.4618[/C][C]788.6994[/C][C]856.2242[/C][C]0[/C][C]1[/C][C]0[/C][C]0.0196[/C][/ROW]
[ROW][C]46[/C][C]841[/C][C]693.1114[/C][C]659.3792[/C][C]726.8435[/C][C]0[/C][C]0[/C][C]0[/C][C]0[/C][/ROW]
[ROW][C]47[/C][C]892[/C][C]714.5729[/C][C]680.5733[/C][C]748.5724[/C][C]0[/C][C]0[/C][C]0.6476[/C][C]0[/C][/ROW]
[ROW][C]48[/C][C]782[/C][C]857.1962[/C][C]824.9617[/C][C]889.4308[/C][C]0[/C][C]0.0172[/C][C]0.4805[/C][C]0.4805[/C][/ROW]
[/TABLE]
Source: https://freestatistics.org/blog/index.php?pk=115064&T=1

Globally Unique Identifier (entire table): ba.freestatistics.org/blog/index.php?pk=115064&T=1

As an alternative you can also use a QR Code:  

The GUIDs for individual cells are displayed in the table below:

Univariate ARIMA Extrapolation Forecast
timeY[t]F[t]95% LB95% UBp-value(H0: Y[t] = F[t])P(F[t]>Y[t-1])P(F[t]>Y[t-s])P(F[t]>Y[36])
24629-------
25685-------
26617-------
27715-------
28715-------
29629-------
30916-------
31531-------
32357-------
33917-------
34828-------
35708-------
36858-------
37775792.572765.7959819.3480.0992010
38785662.457628.7023696.2117000.99580
391006687.2676654.1687720.3666000.05030
40789650.166616.7897683.5423001e-040
41734723.0601689.6369756.48320.26061e-0410
42906906.0763872.5162939.63640.498210.28110.9975
43532510.3801476.6377544.12260.104600.11550
44387346.4943312.6914380.29710.009400.27120
45991822.4618788.6994856.22420100.0196
46841693.1114659.3792726.84350000
47892714.5729680.5733748.5724000.64760
48782857.1962824.9617889.430800.01720.48050.4805


Univariate ARIMA Extrapolation Forecast Performance
time% S.E.PEMAPESq.EMSERMSE
370.0172-0.02220308.774200
380.0260.1850.103615016.79587662.78587.5373
390.02460.46380.2236101590.317538971.9625197.4132
400.02620.21350.221119274.876434047.691184.5202
410.02360.01510.1799119.682227262.0892165.1124
420.0189-1e-040.14990.005822718.4087150.7263
430.03370.04240.1346467.419319539.6959139.7845
440.04980.11690.13241640.712417302.323131.5383
450.02090.20490.140428405.120618535.9671136.1469
460.02480.21340.147721871.050718869.4755137.3662
470.02430.24830.156931480.391820015.9224141.4776
480.0192-0.08770.15115654.469618819.1347137.1829

\begin{tabular}{lllllllll}
\hline
Univariate ARIMA Extrapolation Forecast Performance \tabularnewline
time & % S.E. & PE & MAPE & Sq.E & MSE & RMSE \tabularnewline
37 & 0.0172 & -0.0222 & 0 & 308.7742 & 0 & 0 \tabularnewline
38 & 0.026 & 0.185 & 0.1036 & 15016.7958 & 7662.785 & 87.5373 \tabularnewline
39 & 0.0246 & 0.4638 & 0.2236 & 101590.3175 & 38971.9625 & 197.4132 \tabularnewline
40 & 0.0262 & 0.2135 & 0.2211 & 19274.8764 & 34047.691 & 184.5202 \tabularnewline
41 & 0.0236 & 0.0151 & 0.1799 & 119.6822 & 27262.0892 & 165.1124 \tabularnewline
42 & 0.0189 & -1e-04 & 0.1499 & 0.0058 & 22718.4087 & 150.7263 \tabularnewline
43 & 0.0337 & 0.0424 & 0.1346 & 467.4193 & 19539.6959 & 139.7845 \tabularnewline
44 & 0.0498 & 0.1169 & 0.1324 & 1640.7124 & 17302.323 & 131.5383 \tabularnewline
45 & 0.0209 & 0.2049 & 0.1404 & 28405.1206 & 18535.9671 & 136.1469 \tabularnewline
46 & 0.0248 & 0.2134 & 0.1477 & 21871.0507 & 18869.4755 & 137.3662 \tabularnewline
47 & 0.0243 & 0.2483 & 0.1569 & 31480.3918 & 20015.9224 & 141.4776 \tabularnewline
48 & 0.0192 & -0.0877 & 0.1511 & 5654.4696 & 18819.1347 & 137.1829 \tabularnewline
\hline
\end{tabular}
%Source: https://freestatistics.org/blog/index.php?pk=115064&T=2

[TABLE]
[ROW][C]Univariate ARIMA Extrapolation Forecast Performance[/C][/ROW]
[ROW][C]time[/C][C]% S.E.[/C][C]PE[/C][C]MAPE[/C][C]Sq.E[/C][C]MSE[/C][C]RMSE[/C][/ROW]
[ROW][C]37[/C][C]0.0172[/C][C]-0.0222[/C][C]0[/C][C]308.7742[/C][C]0[/C][C]0[/C][/ROW]
[ROW][C]38[/C][C]0.026[/C][C]0.185[/C][C]0.1036[/C][C]15016.7958[/C][C]7662.785[/C][C]87.5373[/C][/ROW]
[ROW][C]39[/C][C]0.0246[/C][C]0.4638[/C][C]0.2236[/C][C]101590.3175[/C][C]38971.9625[/C][C]197.4132[/C][/ROW]
[ROW][C]40[/C][C]0.0262[/C][C]0.2135[/C][C]0.2211[/C][C]19274.8764[/C][C]34047.691[/C][C]184.5202[/C][/ROW]
[ROW][C]41[/C][C]0.0236[/C][C]0.0151[/C][C]0.1799[/C][C]119.6822[/C][C]27262.0892[/C][C]165.1124[/C][/ROW]
[ROW][C]42[/C][C]0.0189[/C][C]-1e-04[/C][C]0.1499[/C][C]0.0058[/C][C]22718.4087[/C][C]150.7263[/C][/ROW]
[ROW][C]43[/C][C]0.0337[/C][C]0.0424[/C][C]0.1346[/C][C]467.4193[/C][C]19539.6959[/C][C]139.7845[/C][/ROW]
[ROW][C]44[/C][C]0.0498[/C][C]0.1169[/C][C]0.1324[/C][C]1640.7124[/C][C]17302.323[/C][C]131.5383[/C][/ROW]
[ROW][C]45[/C][C]0.0209[/C][C]0.2049[/C][C]0.1404[/C][C]28405.1206[/C][C]18535.9671[/C][C]136.1469[/C][/ROW]
[ROW][C]46[/C][C]0.0248[/C][C]0.2134[/C][C]0.1477[/C][C]21871.0507[/C][C]18869.4755[/C][C]137.3662[/C][/ROW]
[ROW][C]47[/C][C]0.0243[/C][C]0.2483[/C][C]0.1569[/C][C]31480.3918[/C][C]20015.9224[/C][C]141.4776[/C][/ROW]
[ROW][C]48[/C][C]0.0192[/C][C]-0.0877[/C][C]0.1511[/C][C]5654.4696[/C][C]18819.1347[/C][C]137.1829[/C][/ROW]
[/TABLE]
Source: https://freestatistics.org/blog/index.php?pk=115064&T=2

Globally Unique Identifier (entire table): ba.freestatistics.org/blog/index.php?pk=115064&T=2

As an alternative you can also use a QR Code:  

The GUIDs for individual cells are displayed in the table below:

Univariate ARIMA Extrapolation Forecast Performance
time% S.E.PEMAPESq.EMSERMSE
370.0172-0.02220308.774200
380.0260.1850.103615016.79587662.78587.5373
390.02460.46380.2236101590.317538971.9625197.4132
400.02620.21350.221119274.876434047.691184.5202
410.02360.01510.1799119.682227262.0892165.1124
420.0189-1e-040.14990.005822718.4087150.7263
430.03370.04240.1346467.419319539.6959139.7845
440.04980.11690.13241640.712417302.323131.5383
450.02090.20490.140428405.120618535.9671136.1469
460.02480.21340.147721871.050718869.4755137.3662
470.02430.24830.156931480.391820015.9224141.4776
480.0192-0.08770.15115654.469618819.1347137.1829


Parameters (Session):
par1 = FALSE ; par2 = -0.2 ; par3 = 0 ; par4 = 0 ; par5 = 12 ; par6 = 3 ; par7 = 1 ; par8 = 2 ; par9 = 1 ;
Parameters (R input):
par1 = 12 ; par2 = 1 ; par3 = 0 ; par4 = 1 ; par5 = 12 ; par6 = 3 ; par7 = 2 ; par8 = 2 ; par9 = 1 ; par10 = FALSE ;
R code (references can be found in the software module):
par1 <- as.numeric(par1) #cut off periods
par2 <- as.numeric(par2) #lambda
par3 <- as.numeric(par3) #degree of non-seasonal differencing
par4 <- as.numeric(par4) #degree of seasonal differencing
par5 <- as.numeric(par5) #seasonal period
par6 <- as.numeric(par6) #p
par7 <- as.numeric(par7) #q
par8 <- as.numeric(par8) #P
par9 <- as.numeric(par9) #Q
if (par10 == 'TRUE') par10 <- TRUE
if (par10 == 'FALSE') par10 <- FALSE
if (par2 == 0) x <- log(x)
if (par2 != 0) x <- x^par2
lx <- length(x)
first <- lx - 2*par1
nx <- lx - par1
nx1 <- nx + 1
fx <- lx - nx
if (fx < 1) {
fx <- par5
nx1 <- lx + fx - 1
first <- lx - 2*fx
}
first <- 1
if (fx < 3) fx <- round(lx/10,0)
(arima.out <- arima(x[1:nx], order=c(par6,par3,par7), seasonal=list(order=c(par8,par4,par9), period=par5), include.mean=par10, method='ML'))
(forecast <- predict(arima.out,par1))
(lb <- forecast$pred - 1.96 * forecast$se)
(ub <- forecast$pred + 1.96 * forecast$se)
if (par2 == 0) {
x <- exp(x)
forecast$pred <- exp(forecast$pred)
lb <- exp(lb)
ub <- exp(ub)
}
if (par2 != 0) {
x <- x^(1/par2)
forecast$pred <- forecast$pred^(1/par2)
lb <- lb^(1/par2)
ub <- ub^(1/par2)
}
if (par2 < 0) {
olb <- lb
lb <- ub
ub <- olb
}
(actandfor <- c(x[1:nx], forecast$pred))
(perc.se <- (ub-forecast$pred)/1.96/forecast$pred)
bitmap(file='test1.png')
opar <- par(mar=c(4,4,2,2),las=1)
ylim <- c( min(x[first:nx],lb), max(x[first:nx],ub))
plot(x,ylim=ylim,type='n',xlim=c(first,lx))
usr <- par('usr')
rect(usr[1],usr[3],nx+1,usr[4],border=NA,col='lemonchiffon')
rect(nx1,usr[3],usr[2],usr[4],border=NA,col='lavender')
abline(h= (-3:3)*2 , col ='gray', lty =3)
polygon( c(nx1:lx,lx:nx1), c(lb,rev(ub)), col = 'orange', lty=2,border=NA)
lines(nx1:lx, lb , lty=2)
lines(nx1:lx, ub , lty=2)
lines(x, lwd=2)
lines(nx1:lx, forecast$pred , lwd=2 , col ='white')
box()
par(opar)
dev.off()
prob.dec <- array(NA, dim=fx)
prob.sdec <- array(NA, dim=fx)
prob.ldec <- array(NA, dim=fx)
prob.pval <- array(NA, dim=fx)
perf.pe <- array(0, dim=fx)
perf.mape <- array(0, dim=fx)
perf.mape1 <- array(0, dim=fx)
perf.se <- array(0, dim=fx)
perf.mse <- array(0, dim=fx)
perf.mse1 <- array(0, dim=fx)
perf.rmse <- array(0, dim=fx)
for (i in 1:fx) {
locSD <- (ub[i] - forecast$pred[i]) / 1.96
perf.pe[i] = (x[nx+i] - forecast$pred[i]) / forecast$pred[i]
perf.se[i] = (x[nx+i] - forecast$pred[i])^2
prob.dec[i] = pnorm((x[nx+i-1] - forecast$pred[i]) / locSD)
prob.sdec[i] = pnorm((x[nx+i-par5] - forecast$pred[i]) / locSD)
prob.ldec[i] = pnorm((x[nx] - forecast$pred[i]) / locSD)
prob.pval[i] = pnorm(abs(x[nx+i] - forecast$pred[i]) / locSD)
}
perf.mape[1] = abs(perf.pe[1])
perf.mse[1] = abs(perf.se[1])
for (i in 2:fx) {
perf.mape[i] = perf.mape[i-1] + abs(perf.pe[i])
perf.mape1[i] = perf.mape[i] / i
perf.mse[i] = perf.mse[i-1] + perf.se[i]
perf.mse1[i] = perf.mse[i] / i
}
perf.rmse = sqrt(perf.mse1)
bitmap(file='test2.png')
plot(forecast$pred, pch=19, type='b',main='ARIMA Extrapolation Forecast', ylab='Forecast and 95% CI', xlab='time',ylim=c(min(lb),max(ub)))
dum <- forecast$pred
dum[1:par1] <- x[(nx+1):lx]
lines(dum, lty=1)
lines(ub,lty=3)
lines(lb,lty=3)
dev.off()
load(file='createtable')
a<-table.start()
a<-table.row.start(a)
a<-table.element(a,'Univariate ARIMA Extrapolation Forecast',9,TRUE)
a<-table.row.end(a)
a<-table.row.start(a)
a<-table.element(a,'time',1,header=TRUE)
a<-table.element(a,'Y[t]',1,header=TRUE)
a<-table.element(a,'F[t]',1,header=TRUE)
a<-table.element(a,'95% LB',1,header=TRUE)
a<-table.element(a,'95% UB',1,header=TRUE)
a<-table.element(a,'p-value
(H0: Y[t] = F[t])',1,header=TRUE)
a<-table.element(a,'P(F[t]>Y[t-1])',1,header=TRUE)
a<-table.element(a,'P(F[t]>Y[t-s])',1,header=TRUE)
mylab <- paste('P(F[t]>Y[',nx,sep='')
mylab <- paste(mylab,'])',sep='')
a<-table.element(a,mylab,1,header=TRUE)
a<-table.row.end(a)
for (i in (nx-par5):nx) {
a<-table.row.start(a)
a<-table.element(a,i,header=TRUE)
a<-table.element(a,x[i])
a<-table.element(a,'-')
a<-table.row.end(a)
}
for (i in 1:fx) {
a<-table.row.start(a)
a<-table.element(a,nx+i,header=TRUE)
a<-table.element(a,round(x[nx+i],4))
a<-table.element(a,round(forecast$pred[i],4))
a<-table.element(a,round(lb[i],4))
a<-table.element(a,round(ub[i],4))
a<-table.element(a,round((1-prob.pval[i]),4))
a<-table.element(a,round((1-prob.dec[i]),4))
a<-table.element(a,round((1-prob.sdec[i]),4))
a<-table.element(a,round((1-prob.ldec[i]),4))
a<-table.row.end(a)
}
a<-table.end(a)
table.save(a,file='mytable.tab')
a<-table.start()
a<-table.row.start(a)
a<-table.element(a,'Univariate ARIMA Extrapolation Forecast Performance',7,TRUE)
a<-table.row.end(a)
a<-table.row.start(a)
a<-table.element(a,'time',1,header=TRUE)
a<-table.element(a,'% S.E.',1,header=TRUE)
a<-table.element(a,'PE',1,header=TRUE)
a<-table.element(a,'MAPE',1,header=TRUE)
a<-table.element(a,'Sq.E',1,header=TRUE)
a<-table.element(a,'MSE',1,header=TRUE)
a<-table.element(a,'RMSE',1,header=TRUE)
a<-table.row.end(a)
for (i in 1:fx) {
a<-table.row.start(a)
a<-table.element(a,nx+i,header=TRUE)
a<-table.element(a,round(perc.se[i],4))
a<-table.element(a,round(perf.pe[i],4))
a<-table.element(a,round(perf.mape1[i],4))
a<-table.element(a,round(perf.se[i],4))
a<-table.element(a,round(perf.mse1[i],4))
a<-table.element(a,round(perf.rmse[i],4))
a<-table.row.end(a)
}
a<-table.end(a)
table.save(a,file='mytable1.tab')