Free Statistics

of Irreproducible Research!

Author's title

Author*The author of this computation has been verified*
R Software Modulerwasp_autocorrelation.wasp
Title produced by software(Partial) Autocorrelation Function
Date of computationFri, 24 Dec 2010 14:43:38 +0000
Cite this page as followsStatistical Computations at FreeStatistics.org, Office for Research Development and Education, URL https://freestatistics.org/blog/index.php?v=date/2010/Dec/24/t1293201678n5bnohw4r2oiliu.htm/, Retrieved Tue, 30 Apr 2024 06:49:19 +0000
Statistical Computations at FreeStatistics.org, Office for Research Development and Education, URL https://freestatistics.org/blog/index.php?pk=115020, Retrieved Tue, 30 Apr 2024 06:49:19 +0000
QR Codes:

Original text written by user:
IsPrivate?No (this computation is public)
User-defined keywords
Estimated Impact103
Family? (F = Feedback message, R = changed R code, M = changed R Module, P = changed Parameters, D = changed Data)
-       [(Partial) Autocorrelation Function] [] [2010-12-24 14:43:38] [5e4b6b538311b7e958647ef5010fb0e5] [Current]
Feedback Forum

Post a new message
Dataseries X:
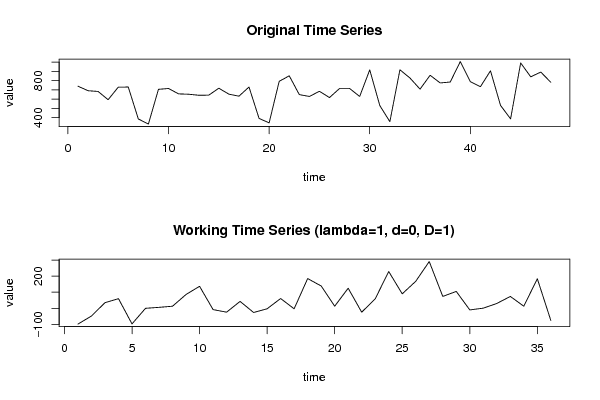
740
691
683
594
729
731
386
331
706
715
657
653
642
643
718
654
632
731
392
344
792
852
649
629
685
617
715
715
629
916
531
357
917
828
708
858
775
785
1006
789
734
906
532
387
991
841
892
782


Summary of computational transaction
Raw Inputview raw input (R code)
Raw Outputview raw output of R engine
Computing time3 seconds
R Server'RServer@AstonUniversity' @ vre.aston.ac.uk

\begin{tabular}{lllllllll}
\hline
Summary of computational transaction \tabularnewline
Raw Input & view raw input (R code)  \tabularnewline
Raw Output & view raw output of R engine  \tabularnewline
Computing time & 3 seconds \tabularnewline
R Server & 'RServer@AstonUniversity' @ vre.aston.ac.uk \tabularnewline
\hline
\end{tabular}
%Source: https://freestatistics.org/blog/index.php?pk=115020&T=0

[TABLE]
[ROW][C]Summary of computational transaction[/C][/ROW]
[ROW][C]Raw Input[/C][C]view raw input (R code) [/C][/ROW]
[ROW][C]Raw Output[/C][C]view raw output of R engine [/C][/ROW]
[ROW][C]Computing time[/C][C]3 seconds[/C][/ROW]
[ROW][C]R Server[/C][C]'RServer@AstonUniversity' @ vre.aston.ac.uk[/C][/ROW]
[/TABLE]
Source: https://freestatistics.org/blog/index.php?pk=115020&T=0

Globally Unique Identifier (entire table): ba.freestatistics.org/blog/index.php?pk=115020&T=0

As an alternative you can also use a QR Code:  

The GUIDs for individual cells are displayed in the table below:

Summary of computational transaction
Raw Inputview raw input (R code)
Raw Outputview raw output of R engine
Computing time3 seconds
R Server'RServer@AstonUniversity' @ vre.aston.ac.uk


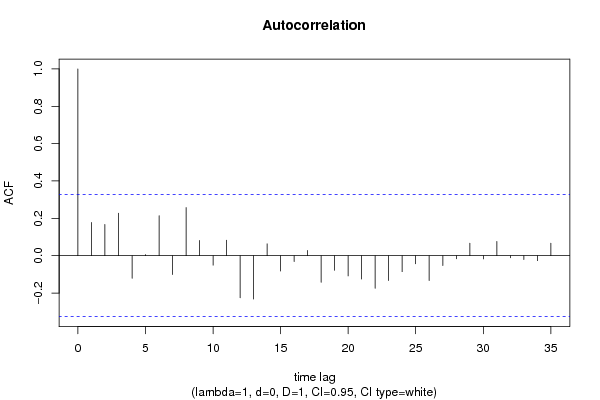
Autocorrelation Function
Time lag kACF(k)T-STATP-value
10.1775721.06540.146888
20.1672861.00370.161108
30.2268481.36110.090973
4-0.121236-0.72740.235838
50.005590.03350.486715
60.2143661.28620.103293
7-0.101232-0.60740.273701
80.2574851.54490.065557
90.081330.4880.314262
10-0.050862-0.30520.380997
110.0822420.49350.312346
12-0.225555-1.35330.092194
13-0.232051-1.39230.086186
140.063310.37990.353141
15-0.081983-0.49190.312888
16-0.030955-0.18570.426851
170.0276630.1660.434552
18-0.142566-0.85540.198995
19-0.078551-0.47130.320132
20-0.108429-0.65060.259726
21-0.125481-0.75290.228206
22-0.174531-1.04720.150997
23-0.1332-0.79920.214709
24-0.085521-0.51310.305499
25-0.042988-0.25790.398966
26-0.132941-0.79760.215153
27-0.052387-0.31430.377545
28-0.016399-0.09840.461083
290.0666620.40.345769
30-0.017435-0.10460.458634
310.0756250.45380.326365
32-0.011368-0.06820.472999
33-0.020578-0.12350.451212
34-0.026764-0.16060.436659
350.0670350.40220.344954
36NANANA
37NANANA
38NANANA
39NANANA
40NANANA
41NANANA
42NANANA
43NANANA
44NANANA
45NANANA
46NANANA
47NANANA
48NANANA

\begin{tabular}{lllllllll}
\hline
Autocorrelation Function \tabularnewline
Time lag k & ACF(k) & T-STAT & P-value \tabularnewline
1 & 0.177572 & 1.0654 & 0.146888 \tabularnewline
2 & 0.167286 & 1.0037 & 0.161108 \tabularnewline
3 & 0.226848 & 1.3611 & 0.090973 \tabularnewline
4 & -0.121236 & -0.7274 & 0.235838 \tabularnewline
5 & 0.00559 & 0.0335 & 0.486715 \tabularnewline
6 & 0.214366 & 1.2862 & 0.103293 \tabularnewline
7 & -0.101232 & -0.6074 & 0.273701 \tabularnewline
8 & 0.257485 & 1.5449 & 0.065557 \tabularnewline
9 & 0.08133 & 0.488 & 0.314262 \tabularnewline
10 & -0.050862 & -0.3052 & 0.380997 \tabularnewline
11 & 0.082242 & 0.4935 & 0.312346 \tabularnewline
12 & -0.225555 & -1.3533 & 0.092194 \tabularnewline
13 & -0.232051 & -1.3923 & 0.086186 \tabularnewline
14 & 0.06331 & 0.3799 & 0.353141 \tabularnewline
15 & -0.081983 & -0.4919 & 0.312888 \tabularnewline
16 & -0.030955 & -0.1857 & 0.426851 \tabularnewline
17 & 0.027663 & 0.166 & 0.434552 \tabularnewline
18 & -0.142566 & -0.8554 & 0.198995 \tabularnewline
19 & -0.078551 & -0.4713 & 0.320132 \tabularnewline
20 & -0.108429 & -0.6506 & 0.259726 \tabularnewline
21 & -0.125481 & -0.7529 & 0.228206 \tabularnewline
22 & -0.174531 & -1.0472 & 0.150997 \tabularnewline
23 & -0.1332 & -0.7992 & 0.214709 \tabularnewline
24 & -0.085521 & -0.5131 & 0.305499 \tabularnewline
25 & -0.042988 & -0.2579 & 0.398966 \tabularnewline
26 & -0.132941 & -0.7976 & 0.215153 \tabularnewline
27 & -0.052387 & -0.3143 & 0.377545 \tabularnewline
28 & -0.016399 & -0.0984 & 0.461083 \tabularnewline
29 & 0.066662 & 0.4 & 0.345769 \tabularnewline
30 & -0.017435 & -0.1046 & 0.458634 \tabularnewline
31 & 0.075625 & 0.4538 & 0.326365 \tabularnewline
32 & -0.011368 & -0.0682 & 0.472999 \tabularnewline
33 & -0.020578 & -0.1235 & 0.451212 \tabularnewline
34 & -0.026764 & -0.1606 & 0.436659 \tabularnewline
35 & 0.067035 & 0.4022 & 0.344954 \tabularnewline
36 & NA & NA & NA \tabularnewline
37 & NA & NA & NA \tabularnewline
38 & NA & NA & NA \tabularnewline
39 & NA & NA & NA \tabularnewline
40 & NA & NA & NA \tabularnewline
41 & NA & NA & NA \tabularnewline
42 & NA & NA & NA \tabularnewline
43 & NA & NA & NA \tabularnewline
44 & NA & NA & NA \tabularnewline
45 & NA & NA & NA \tabularnewline
46 & NA & NA & NA \tabularnewline
47 & NA & NA & NA \tabularnewline
48 & NA & NA & NA \tabularnewline
\hline
\end{tabular}
%Source: https://freestatistics.org/blog/index.php?pk=115020&T=1

[TABLE]
[ROW][C]Autocorrelation Function[/C][/ROW]
[ROW][C]Time lag k[/C][C]ACF(k)[/C][C]T-STAT[/C][C]P-value[/C][/ROW]
[ROW][C]1[/C][C]0.177572[/C][C]1.0654[/C][C]0.146888[/C][/ROW]
[ROW][C]2[/C][C]0.167286[/C][C]1.0037[/C][C]0.161108[/C][/ROW]
[ROW][C]3[/C][C]0.226848[/C][C]1.3611[/C][C]0.090973[/C][/ROW]
[ROW][C]4[/C][C]-0.121236[/C][C]-0.7274[/C][C]0.235838[/C][/ROW]
[ROW][C]5[/C][C]0.00559[/C][C]0.0335[/C][C]0.486715[/C][/ROW]
[ROW][C]6[/C][C]0.214366[/C][C]1.2862[/C][C]0.103293[/C][/ROW]
[ROW][C]7[/C][C]-0.101232[/C][C]-0.6074[/C][C]0.273701[/C][/ROW]
[ROW][C]8[/C][C]0.257485[/C][C]1.5449[/C][C]0.065557[/C][/ROW]
[ROW][C]9[/C][C]0.08133[/C][C]0.488[/C][C]0.314262[/C][/ROW]
[ROW][C]10[/C][C]-0.050862[/C][C]-0.3052[/C][C]0.380997[/C][/ROW]
[ROW][C]11[/C][C]0.082242[/C][C]0.4935[/C][C]0.312346[/C][/ROW]
[ROW][C]12[/C][C]-0.225555[/C][C]-1.3533[/C][C]0.092194[/C][/ROW]
[ROW][C]13[/C][C]-0.232051[/C][C]-1.3923[/C][C]0.086186[/C][/ROW]
[ROW][C]14[/C][C]0.06331[/C][C]0.3799[/C][C]0.353141[/C][/ROW]
[ROW][C]15[/C][C]-0.081983[/C][C]-0.4919[/C][C]0.312888[/C][/ROW]
[ROW][C]16[/C][C]-0.030955[/C][C]-0.1857[/C][C]0.426851[/C][/ROW]
[ROW][C]17[/C][C]0.027663[/C][C]0.166[/C][C]0.434552[/C][/ROW]
[ROW][C]18[/C][C]-0.142566[/C][C]-0.8554[/C][C]0.198995[/C][/ROW]
[ROW][C]19[/C][C]-0.078551[/C][C]-0.4713[/C][C]0.320132[/C][/ROW]
[ROW][C]20[/C][C]-0.108429[/C][C]-0.6506[/C][C]0.259726[/C][/ROW]
[ROW][C]21[/C][C]-0.125481[/C][C]-0.7529[/C][C]0.228206[/C][/ROW]
[ROW][C]22[/C][C]-0.174531[/C][C]-1.0472[/C][C]0.150997[/C][/ROW]
[ROW][C]23[/C][C]-0.1332[/C][C]-0.7992[/C][C]0.214709[/C][/ROW]
[ROW][C]24[/C][C]-0.085521[/C][C]-0.5131[/C][C]0.305499[/C][/ROW]
[ROW][C]25[/C][C]-0.042988[/C][C]-0.2579[/C][C]0.398966[/C][/ROW]
[ROW][C]26[/C][C]-0.132941[/C][C]-0.7976[/C][C]0.215153[/C][/ROW]
[ROW][C]27[/C][C]-0.052387[/C][C]-0.3143[/C][C]0.377545[/C][/ROW]
[ROW][C]28[/C][C]-0.016399[/C][C]-0.0984[/C][C]0.461083[/C][/ROW]
[ROW][C]29[/C][C]0.066662[/C][C]0.4[/C][C]0.345769[/C][/ROW]
[ROW][C]30[/C][C]-0.017435[/C][C]-0.1046[/C][C]0.458634[/C][/ROW]
[ROW][C]31[/C][C]0.075625[/C][C]0.4538[/C][C]0.326365[/C][/ROW]
[ROW][C]32[/C][C]-0.011368[/C][C]-0.0682[/C][C]0.472999[/C][/ROW]
[ROW][C]33[/C][C]-0.020578[/C][C]-0.1235[/C][C]0.451212[/C][/ROW]
[ROW][C]34[/C][C]-0.026764[/C][C]-0.1606[/C][C]0.436659[/C][/ROW]
[ROW][C]35[/C][C]0.067035[/C][C]0.4022[/C][C]0.344954[/C][/ROW]
[ROW][C]36[/C][C]NA[/C][C]NA[/C][C]NA[/C][/ROW]
[ROW][C]37[/C][C]NA[/C][C]NA[/C][C]NA[/C][/ROW]
[ROW][C]38[/C][C]NA[/C][C]NA[/C][C]NA[/C][/ROW]
[ROW][C]39[/C][C]NA[/C][C]NA[/C][C]NA[/C][/ROW]
[ROW][C]40[/C][C]NA[/C][C]NA[/C][C]NA[/C][/ROW]
[ROW][C]41[/C][C]NA[/C][C]NA[/C][C]NA[/C][/ROW]
[ROW][C]42[/C][C]NA[/C][C]NA[/C][C]NA[/C][/ROW]
[ROW][C]43[/C][C]NA[/C][C]NA[/C][C]NA[/C][/ROW]
[ROW][C]44[/C][C]NA[/C][C]NA[/C][C]NA[/C][/ROW]
[ROW][C]45[/C][C]NA[/C][C]NA[/C][C]NA[/C][/ROW]
[ROW][C]46[/C][C]NA[/C][C]NA[/C][C]NA[/C][/ROW]
[ROW][C]47[/C][C]NA[/C][C]NA[/C][C]NA[/C][/ROW]
[ROW][C]48[/C][C]NA[/C][C]NA[/C][C]NA[/C][/ROW]
[/TABLE]
Source: https://freestatistics.org/blog/index.php?pk=115020&T=1

Globally Unique Identifier (entire table): ba.freestatistics.org/blog/index.php?pk=115020&T=1

As an alternative you can also use a QR Code:  

The GUIDs for individual cells are displayed in the table below:

Autocorrelation Function
Time lag kACF(k)T-STATP-value
10.1775721.06540.146888
20.1672861.00370.161108
30.2268481.36110.090973
4-0.121236-0.72740.235838
50.005590.03350.486715
60.2143661.28620.103293
7-0.101232-0.60740.273701
80.2574851.54490.065557
90.081330.4880.314262
10-0.050862-0.30520.380997
110.0822420.49350.312346
12-0.225555-1.35330.092194
13-0.232051-1.39230.086186
140.063310.37990.353141
15-0.081983-0.49190.312888
16-0.030955-0.18570.426851
170.0276630.1660.434552
18-0.142566-0.85540.198995
19-0.078551-0.47130.320132
20-0.108429-0.65060.259726
21-0.125481-0.75290.228206
22-0.174531-1.04720.150997
23-0.1332-0.79920.214709
24-0.085521-0.51310.305499
25-0.042988-0.25790.398966
26-0.132941-0.79760.215153
27-0.052387-0.31430.377545
28-0.016399-0.09840.461083
290.0666620.40.345769
30-0.017435-0.10460.458634
310.0756250.45380.326365
32-0.011368-0.06820.472999
33-0.020578-0.12350.451212
34-0.026764-0.16060.436659
350.0670350.40220.344954
36NANANA
37NANANA
38NANANA
39NANANA
40NANANA
41NANANA
42NANANA
43NANANA
44NANANA
45NANANA
46NANANA
47NANANA
48NANANA


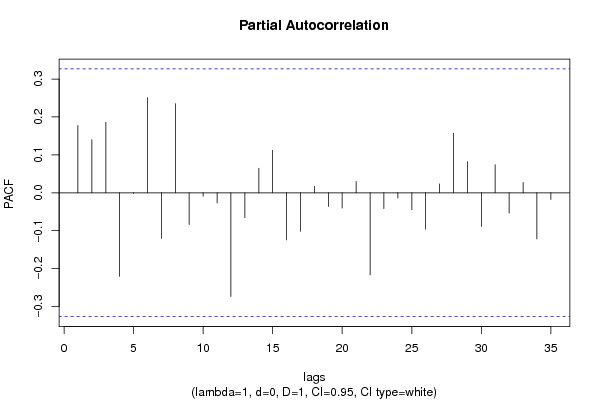
Partial Autocorrelation Function
Time lag kPACF(k)T-STATP-value
10.1775721.06540.146888
20.1401740.8410.202938
30.185811.11490.136149
4-0.219995-1.320.097588
5-0.001975-0.01190.495305
60.2505881.50350.070713
7-0.120296-0.72180.237547
80.2347121.40830.083814
9-0.083723-0.50230.309244
10-0.008976-0.05390.478674
11-0.02682-0.16090.436527
12-0.27326-1.63960.054904
13-0.065784-0.39470.347696
140.0646420.38790.350204
150.1123060.67380.25236
16-0.124214-0.74530.230469
17-0.101673-0.610.272834
180.01720.10320.459188
19-0.036161-0.2170.414731
20-0.040022-0.24010.405796
210.0297450.17850.429676
22-0.215989-1.29590.101622
23-0.041369-0.24820.402689
24-0.013566-0.08140.467789
25-0.044901-0.26940.394578
26-0.096063-0.57640.283973
270.0233950.14040.444574
280.1573720.94420.175673
290.0818660.49120.313134
30-0.089096-0.53460.298115
310.0738530.44310.330166
32-0.053049-0.31830.376051
330.0274690.16480.435007
34-0.121545-0.72930.235278
35-0.017451-0.10470.458595
36NANANA
37NANANA
38NANANA
39NANANA
40NANANA
41NANANA
42NANANA
43NANANA
44NANANA
45NANANA
46NANANA
47NANANA
48NANANA

\begin{tabular}{lllllllll}
\hline
Partial Autocorrelation Function \tabularnewline
Time lag k & PACF(k) & T-STAT & P-value \tabularnewline
1 & 0.177572 & 1.0654 & 0.146888 \tabularnewline
2 & 0.140174 & 0.841 & 0.202938 \tabularnewline
3 & 0.18581 & 1.1149 & 0.136149 \tabularnewline
4 & -0.219995 & -1.32 & 0.097588 \tabularnewline
5 & -0.001975 & -0.0119 & 0.495305 \tabularnewline
6 & 0.250588 & 1.5035 & 0.070713 \tabularnewline
7 & -0.120296 & -0.7218 & 0.237547 \tabularnewline
8 & 0.234712 & 1.4083 & 0.083814 \tabularnewline
9 & -0.083723 & -0.5023 & 0.309244 \tabularnewline
10 & -0.008976 & -0.0539 & 0.478674 \tabularnewline
11 & -0.02682 & -0.1609 & 0.436527 \tabularnewline
12 & -0.27326 & -1.6396 & 0.054904 \tabularnewline
13 & -0.065784 & -0.3947 & 0.347696 \tabularnewline
14 & 0.064642 & 0.3879 & 0.350204 \tabularnewline
15 & 0.112306 & 0.6738 & 0.25236 \tabularnewline
16 & -0.124214 & -0.7453 & 0.230469 \tabularnewline
17 & -0.101673 & -0.61 & 0.272834 \tabularnewline
18 & 0.0172 & 0.1032 & 0.459188 \tabularnewline
19 & -0.036161 & -0.217 & 0.414731 \tabularnewline
20 & -0.040022 & -0.2401 & 0.405796 \tabularnewline
21 & 0.029745 & 0.1785 & 0.429676 \tabularnewline
22 & -0.215989 & -1.2959 & 0.101622 \tabularnewline
23 & -0.041369 & -0.2482 & 0.402689 \tabularnewline
24 & -0.013566 & -0.0814 & 0.467789 \tabularnewline
25 & -0.044901 & -0.2694 & 0.394578 \tabularnewline
26 & -0.096063 & -0.5764 & 0.283973 \tabularnewline
27 & 0.023395 & 0.1404 & 0.444574 \tabularnewline
28 & 0.157372 & 0.9442 & 0.175673 \tabularnewline
29 & 0.081866 & 0.4912 & 0.313134 \tabularnewline
30 & -0.089096 & -0.5346 & 0.298115 \tabularnewline
31 & 0.073853 & 0.4431 & 0.330166 \tabularnewline
32 & -0.053049 & -0.3183 & 0.376051 \tabularnewline
33 & 0.027469 & 0.1648 & 0.435007 \tabularnewline
34 & -0.121545 & -0.7293 & 0.235278 \tabularnewline
35 & -0.017451 & -0.1047 & 0.458595 \tabularnewline
36 & NA & NA & NA \tabularnewline
37 & NA & NA & NA \tabularnewline
38 & NA & NA & NA \tabularnewline
39 & NA & NA & NA \tabularnewline
40 & NA & NA & NA \tabularnewline
41 & NA & NA & NA \tabularnewline
42 & NA & NA & NA \tabularnewline
43 & NA & NA & NA \tabularnewline
44 & NA & NA & NA \tabularnewline
45 & NA & NA & NA \tabularnewline
46 & NA & NA & NA \tabularnewline
47 & NA & NA & NA \tabularnewline
48 & NA & NA & NA \tabularnewline
\hline
\end{tabular}
%Source: https://freestatistics.org/blog/index.php?pk=115020&T=2

[TABLE]
[ROW][C]Partial Autocorrelation Function[/C][/ROW]
[ROW][C]Time lag k[/C][C]PACF(k)[/C][C]T-STAT[/C][C]P-value[/C][/ROW]
[ROW][C]1[/C][C]0.177572[/C][C]1.0654[/C][C]0.146888[/C][/ROW]
[ROW][C]2[/C][C]0.140174[/C][C]0.841[/C][C]0.202938[/C][/ROW]
[ROW][C]3[/C][C]0.18581[/C][C]1.1149[/C][C]0.136149[/C][/ROW]
[ROW][C]4[/C][C]-0.219995[/C][C]-1.32[/C][C]0.097588[/C][/ROW]
[ROW][C]5[/C][C]-0.001975[/C][C]-0.0119[/C][C]0.495305[/C][/ROW]
[ROW][C]6[/C][C]0.250588[/C][C]1.5035[/C][C]0.070713[/C][/ROW]
[ROW][C]7[/C][C]-0.120296[/C][C]-0.7218[/C][C]0.237547[/C][/ROW]
[ROW][C]8[/C][C]0.234712[/C][C]1.4083[/C][C]0.083814[/C][/ROW]
[ROW][C]9[/C][C]-0.083723[/C][C]-0.5023[/C][C]0.309244[/C][/ROW]
[ROW][C]10[/C][C]-0.008976[/C][C]-0.0539[/C][C]0.478674[/C][/ROW]
[ROW][C]11[/C][C]-0.02682[/C][C]-0.1609[/C][C]0.436527[/C][/ROW]
[ROW][C]12[/C][C]-0.27326[/C][C]-1.6396[/C][C]0.054904[/C][/ROW]
[ROW][C]13[/C][C]-0.065784[/C][C]-0.3947[/C][C]0.347696[/C][/ROW]
[ROW][C]14[/C][C]0.064642[/C][C]0.3879[/C][C]0.350204[/C][/ROW]
[ROW][C]15[/C][C]0.112306[/C][C]0.6738[/C][C]0.25236[/C][/ROW]
[ROW][C]16[/C][C]-0.124214[/C][C]-0.7453[/C][C]0.230469[/C][/ROW]
[ROW][C]17[/C][C]-0.101673[/C][C]-0.61[/C][C]0.272834[/C][/ROW]
[ROW][C]18[/C][C]0.0172[/C][C]0.1032[/C][C]0.459188[/C][/ROW]
[ROW][C]19[/C][C]-0.036161[/C][C]-0.217[/C][C]0.414731[/C][/ROW]
[ROW][C]20[/C][C]-0.040022[/C][C]-0.2401[/C][C]0.405796[/C][/ROW]
[ROW][C]21[/C][C]0.029745[/C][C]0.1785[/C][C]0.429676[/C][/ROW]
[ROW][C]22[/C][C]-0.215989[/C][C]-1.2959[/C][C]0.101622[/C][/ROW]
[ROW][C]23[/C][C]-0.041369[/C][C]-0.2482[/C][C]0.402689[/C][/ROW]
[ROW][C]24[/C][C]-0.013566[/C][C]-0.0814[/C][C]0.467789[/C][/ROW]
[ROW][C]25[/C][C]-0.044901[/C][C]-0.2694[/C][C]0.394578[/C][/ROW]
[ROW][C]26[/C][C]-0.096063[/C][C]-0.5764[/C][C]0.283973[/C][/ROW]
[ROW][C]27[/C][C]0.023395[/C][C]0.1404[/C][C]0.444574[/C][/ROW]
[ROW][C]28[/C][C]0.157372[/C][C]0.9442[/C][C]0.175673[/C][/ROW]
[ROW][C]29[/C][C]0.081866[/C][C]0.4912[/C][C]0.313134[/C][/ROW]
[ROW][C]30[/C][C]-0.089096[/C][C]-0.5346[/C][C]0.298115[/C][/ROW]
[ROW][C]31[/C][C]0.073853[/C][C]0.4431[/C][C]0.330166[/C][/ROW]
[ROW][C]32[/C][C]-0.053049[/C][C]-0.3183[/C][C]0.376051[/C][/ROW]
[ROW][C]33[/C][C]0.027469[/C][C]0.1648[/C][C]0.435007[/C][/ROW]
[ROW][C]34[/C][C]-0.121545[/C][C]-0.7293[/C][C]0.235278[/C][/ROW]
[ROW][C]35[/C][C]-0.017451[/C][C]-0.1047[/C][C]0.458595[/C][/ROW]
[ROW][C]36[/C][C]NA[/C][C]NA[/C][C]NA[/C][/ROW]
[ROW][C]37[/C][C]NA[/C][C]NA[/C][C]NA[/C][/ROW]
[ROW][C]38[/C][C]NA[/C][C]NA[/C][C]NA[/C][/ROW]
[ROW][C]39[/C][C]NA[/C][C]NA[/C][C]NA[/C][/ROW]
[ROW][C]40[/C][C]NA[/C][C]NA[/C][C]NA[/C][/ROW]
[ROW][C]41[/C][C]NA[/C][C]NA[/C][C]NA[/C][/ROW]
[ROW][C]42[/C][C]NA[/C][C]NA[/C][C]NA[/C][/ROW]
[ROW][C]43[/C][C]NA[/C][C]NA[/C][C]NA[/C][/ROW]
[ROW][C]44[/C][C]NA[/C][C]NA[/C][C]NA[/C][/ROW]
[ROW][C]45[/C][C]NA[/C][C]NA[/C][C]NA[/C][/ROW]
[ROW][C]46[/C][C]NA[/C][C]NA[/C][C]NA[/C][/ROW]
[ROW][C]47[/C][C]NA[/C][C]NA[/C][C]NA[/C][/ROW]
[ROW][C]48[/C][C]NA[/C][C]NA[/C][C]NA[/C][/ROW]
[/TABLE]
Source: https://freestatistics.org/blog/index.php?pk=115020&T=2

Globally Unique Identifier (entire table): ba.freestatistics.org/blog/index.php?pk=115020&T=2

As an alternative you can also use a QR Code:  

The GUIDs for individual cells are displayed in the table below:

Partial Autocorrelation Function
Time lag kPACF(k)T-STATP-value
10.1775721.06540.146888
20.1401740.8410.202938
30.185811.11490.136149
4-0.219995-1.320.097588
5-0.001975-0.01190.495305
60.2505881.50350.070713
7-0.120296-0.72180.237547
80.2347121.40830.083814
9-0.083723-0.50230.309244
10-0.008976-0.05390.478674
11-0.02682-0.16090.436527
12-0.27326-1.63960.054904
13-0.065784-0.39470.347696
140.0646420.38790.350204
150.1123060.67380.25236
16-0.124214-0.74530.230469
17-0.101673-0.610.272834
180.01720.10320.459188
19-0.036161-0.2170.414731
20-0.040022-0.24010.405796
210.0297450.17850.429676
22-0.215989-1.29590.101622
23-0.041369-0.24820.402689
24-0.013566-0.08140.467789
25-0.044901-0.26940.394578
26-0.096063-0.57640.283973
270.0233950.14040.444574
280.1573720.94420.175673
290.0818660.49120.313134
30-0.089096-0.53460.298115
310.0738530.44310.330166
32-0.053049-0.31830.376051
330.0274690.16480.435007
34-0.121545-0.72930.235278
35-0.017451-0.10470.458595
36NANANA
37NANANA
38NANANA
39NANANA
40NANANA
41NANANA
42NANANA
43NANANA
44NANANA
45NANANA
46NANANA
47NANANA
48NANANA


Parameters (Session):
par1 = 48 ; par2 = 1 ; par3 = 0 ; par4 = 1 ; par5 = 12 ; par6 = White Noise ; par7 = 0.95 ;
Parameters (R input):
par1 = 48 ; par2 = 1 ; par3 = 0 ; par4 = 1 ; par5 = 12 ; par6 = White Noise ; par7 = 0.95 ; par8 = ;
R code (references can be found in the software module):
if (par1 == 'Default') {
par1 = 10*log10(length(x))
} else {
par1 <- as.numeric(par1)
}
par2 <- as.numeric(par2)
par3 <- as.numeric(par3)
par4 <- as.numeric(par4)
par5 <- as.numeric(par5)
if (par6 == 'White Noise') par6 <- 'white' else par6 <- 'ma'
par7 <- as.numeric(par7)
if (par8 != '') par8 <- as.numeric(par8)
ox <- x
if (par8 == '') {
if (par2 == 0) {
x <- log(x)
} else {
x <- (x ^ par2 - 1) / par2
}
} else {
x <- log(x,base=par8)
}
if (par3 > 0) x <- diff(x,lag=1,difference=par3)
if (par4 > 0) x <- diff(x,lag=par5,difference=par4)
bitmap(file='picts.png')
op <- par(mfrow=c(2,1))
plot(ox,type='l',main='Original Time Series',xlab='time',ylab='value')
if (par8=='') {
mytitle <- paste('Working Time Series (lambda=',par2,', d=',par3,', D=',par4,')',sep='')
mysub <- paste('(lambda=',par2,', d=',par3,', D=',par4,', CI=', par7, ', CI type=',par6,')',sep='')
} else {
mytitle <- paste('Working Time Series (base=',par8,', d=',par3,', D=',par4,')',sep='')
mysub <- paste('(base=',par8,', d=',par3,', D=',par4,', CI=', par7, ', CI type=',par6,')',sep='')
}
plot(x,type='l', main=mytitle,xlab='time',ylab='value')
par(op)
dev.off()
bitmap(file='pic1.png')
racf <- acf(x, par1, main='Autocorrelation', xlab='time lag', ylab='ACF', ci.type=par6, ci=par7, sub=mysub)
dev.off()
bitmap(file='pic2.png')
rpacf <- pacf(x,par1,main='Partial Autocorrelation',xlab='lags',ylab='PACF',sub=mysub)
dev.off()
(myacf <- c(racf$acf))
(mypacf <- c(rpacf$acf))
lengthx <- length(x)
sqrtn <- sqrt(lengthx)
load(file='createtable')
a<-table.start()
a<-table.row.start(a)
a<-table.element(a,'Autocorrelation Function',4,TRUE)
a<-table.row.end(a)
a<-table.row.start(a)
a<-table.element(a,'Time lag k',header=TRUE)
a<-table.element(a,hyperlink('basics.htm','ACF(k)','click here for more information about the Autocorrelation Function'),header=TRUE)
a<-table.element(a,'T-STAT',header=TRUE)
a<-table.element(a,'P-value',header=TRUE)
a<-table.row.end(a)
for (i in 2:(par1+1)) {
a<-table.row.start(a)
a<-table.element(a,i-1,header=TRUE)
a<-table.element(a,round(myacf[i],6))
mytstat <- myacf[i]*sqrtn
a<-table.element(a,round(mytstat,4))
a<-table.element(a,round(1-pt(abs(mytstat),lengthx),6))
a<-table.row.end(a)
}
a<-table.end(a)
table.save(a,file='mytable.tab')
a<-table.start()
a<-table.row.start(a)
a<-table.element(a,'Partial Autocorrelation Function',4,TRUE)
a<-table.row.end(a)
a<-table.row.start(a)
a<-table.element(a,'Time lag k',header=TRUE)
a<-table.element(a,hyperlink('basics.htm','PACF(k)','click here for more information about the Partial Autocorrelation Function'),header=TRUE)
a<-table.element(a,'T-STAT',header=TRUE)
a<-table.element(a,'P-value',header=TRUE)
a<-table.row.end(a)
for (i in 1:par1) {
a<-table.row.start(a)
a<-table.element(a,i,header=TRUE)
a<-table.element(a,round(mypacf[i],6))
mytstat <- mypacf[i]*sqrtn
a<-table.element(a,round(mytstat,4))
a<-table.element(a,round(1-pt(abs(mytstat),lengthx),6))
a<-table.row.end(a)
}
a<-table.end(a)
table.save(a,file='mytable1.tab')