Free Statistics

of Irreproducible Research!

Author's title

Author*The author of this computation has been verified*
R Software Modulerwasp_autocorrelation.wasp
Title produced by software(Partial) Autocorrelation Function
Date of computationFri, 24 Dec 2010 14:42:57 +0000
Cite this page as followsStatistical Computations at FreeStatistics.org, Office for Research Development and Education, URL https://freestatistics.org/blog/index.php?v=date/2010/Dec/24/t12932016364jtpvevvsmmgnkl.htm/, Retrieved Tue, 30 Apr 2024 06:52:07 +0000
Statistical Computations at FreeStatistics.org, Office for Research Development and Education, URL https://freestatistics.org/blog/index.php?pk=115019, Retrieved Tue, 30 Apr 2024 06:52:07 +0000
QR Codes:

Original text written by user:
IsPrivate?No (this computation is public)
User-defined keywords
Estimated Impact100
Family? (F = Feedback message, R = changed R code, M = changed R Module, P = changed Parameters, D = changed Data)
-       [(Partial) Autocorrelation Function] [] [2010-12-24 14:42:57] [5e4b6b538311b7e958647ef5010fb0e5] [Current]
Feedback Forum

Post a new message
Dataseries X:
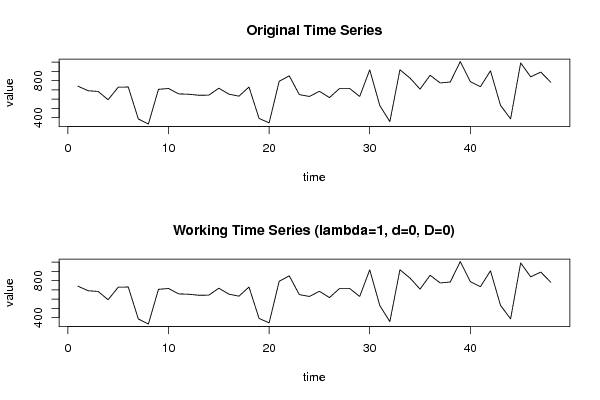
740
691
683
594
729
731
386
331
706
715
657
653
642
643
718
654
632
731
392
344
792
852
649
629
685
617
715
715
629
916
531
357
917
828
708
858
775
785
1006
789
734
906
532
387
991
841
892
782


Summary of computational transaction
Raw Inputview raw input (R code)
Raw Outputview raw output of R engine
Computing time2 seconds
R Server'RServer@AstonUniversity' @ vre.aston.ac.uk

\begin{tabular}{lllllllll}
\hline
Summary of computational transaction \tabularnewline
Raw Input & view raw input (R code)  \tabularnewline
Raw Output & view raw output of R engine  \tabularnewline
Computing time & 2 seconds \tabularnewline
R Server & 'RServer@AstonUniversity' @ vre.aston.ac.uk \tabularnewline
\hline
\end{tabular}
%Source: https://freestatistics.org/blog/index.php?pk=115019&T=0

[TABLE]
[ROW][C]Summary of computational transaction[/C][/ROW]
[ROW][C]Raw Input[/C][C]view raw input (R code) [/C][/ROW]
[ROW][C]Raw Output[/C][C]view raw output of R engine [/C][/ROW]
[ROW][C]Computing time[/C][C]2 seconds[/C][/ROW]
[ROW][C]R Server[/C][C]'RServer@AstonUniversity' @ vre.aston.ac.uk[/C][/ROW]
[/TABLE]
Source: https://freestatistics.org/blog/index.php?pk=115019&T=0

Globally Unique Identifier (entire table): ba.freestatistics.org/blog/index.php?pk=115019&T=0

As an alternative you can also use a QR Code:  

The GUIDs for individual cells are displayed in the table below:

Summary of computational transaction
Raw Inputview raw input (R code)
Raw Outputview raw output of R engine
Computing time2 seconds
R Server'RServer@AstonUniversity' @ vre.aston.ac.uk


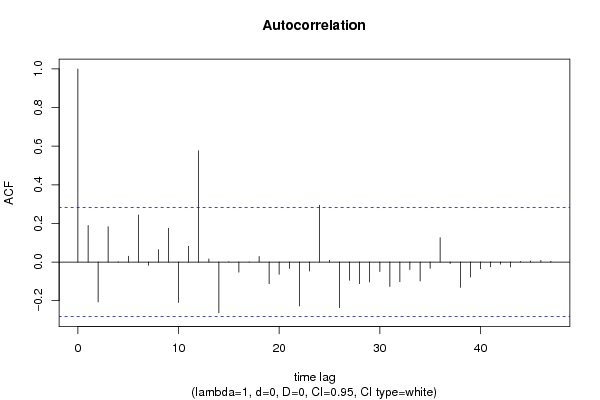
Autocorrelation Function
Time lag kACF(k)T-STATP-value
10.1890931.31010.098202
2-0.206369-1.42980.07963
30.1829841.26770.105501
40.001770.01230.495134
50.0298470.20680.418527
60.2438941.68970.048781
7-0.016593-0.1150.454479
80.0639550.44310.329844
90.1753161.21460.115225
10-0.209488-1.45140.07659
110.0820740.56860.286131
120.5762963.99270.000112
130.0160180.1110.45605
14-0.262525-1.81880.03759
150.0004180.00290.49885
16-0.052392-0.3630.359106
17-0.000295-0.0020.49919
180.0283790.19660.42248
19-0.112362-0.77850.220057
20-0.06346-0.43970.331077
21-0.033689-0.23340.408221
22-0.227817-1.57840.060525
23-0.046671-0.32330.373918
240.2941112.03770.023558
250.0089290.06190.475466
26-0.236842-1.64090.053679
27-0.094191-0.65260.258573
28-0.112039-0.77620.220711
29-0.103706-0.71850.237967
30-0.048774-0.33790.36845
31-0.126743-0.87810.192131
32-0.101527-0.70340.242603
33-0.038715-0.26820.394839
34-0.098714-0.68390.24866
35-0.032603-0.22590.411126
360.1260540.87330.193417
37-0.008003-0.05540.478006
38-0.131293-0.90960.183784
39-0.078088-0.5410.295501
40-0.034933-0.2420.404898
41-0.024149-0.16730.433914
42-0.010859-0.07520.47017
43-0.025813-0.17880.42941
440.0031550.02190.491325
450.0051110.03540.485949
460.007740.05360.478729
470.0035090.02430.490351
48NANANA

\begin{tabular}{lllllllll}
\hline
Autocorrelation Function \tabularnewline
Time lag k & ACF(k) & T-STAT & P-value \tabularnewline
1 & 0.189093 & 1.3101 & 0.098202 \tabularnewline
2 & -0.206369 & -1.4298 & 0.07963 \tabularnewline
3 & 0.182984 & 1.2677 & 0.105501 \tabularnewline
4 & 0.00177 & 0.0123 & 0.495134 \tabularnewline
5 & 0.029847 & 0.2068 & 0.418527 \tabularnewline
6 & 0.243894 & 1.6897 & 0.048781 \tabularnewline
7 & -0.016593 & -0.115 & 0.454479 \tabularnewline
8 & 0.063955 & 0.4431 & 0.329844 \tabularnewline
9 & 0.175316 & 1.2146 & 0.115225 \tabularnewline
10 & -0.209488 & -1.4514 & 0.07659 \tabularnewline
11 & 0.082074 & 0.5686 & 0.286131 \tabularnewline
12 & 0.576296 & 3.9927 & 0.000112 \tabularnewline
13 & 0.016018 & 0.111 & 0.45605 \tabularnewline
14 & -0.262525 & -1.8188 & 0.03759 \tabularnewline
15 & 0.000418 & 0.0029 & 0.49885 \tabularnewline
16 & -0.052392 & -0.363 & 0.359106 \tabularnewline
17 & -0.000295 & -0.002 & 0.49919 \tabularnewline
18 & 0.028379 & 0.1966 & 0.42248 \tabularnewline
19 & -0.112362 & -0.7785 & 0.220057 \tabularnewline
20 & -0.06346 & -0.4397 & 0.331077 \tabularnewline
21 & -0.033689 & -0.2334 & 0.408221 \tabularnewline
22 & -0.227817 & -1.5784 & 0.060525 \tabularnewline
23 & -0.046671 & -0.3233 & 0.373918 \tabularnewline
24 & 0.294111 & 2.0377 & 0.023558 \tabularnewline
25 & 0.008929 & 0.0619 & 0.475466 \tabularnewline
26 & -0.236842 & -1.6409 & 0.053679 \tabularnewline
27 & -0.094191 & -0.6526 & 0.258573 \tabularnewline
28 & -0.112039 & -0.7762 & 0.220711 \tabularnewline
29 & -0.103706 & -0.7185 & 0.237967 \tabularnewline
30 & -0.048774 & -0.3379 & 0.36845 \tabularnewline
31 & -0.126743 & -0.8781 & 0.192131 \tabularnewline
32 & -0.101527 & -0.7034 & 0.242603 \tabularnewline
33 & -0.038715 & -0.2682 & 0.394839 \tabularnewline
34 & -0.098714 & -0.6839 & 0.24866 \tabularnewline
35 & -0.032603 & -0.2259 & 0.411126 \tabularnewline
36 & 0.126054 & 0.8733 & 0.193417 \tabularnewline
37 & -0.008003 & -0.0554 & 0.478006 \tabularnewline
38 & -0.131293 & -0.9096 & 0.183784 \tabularnewline
39 & -0.078088 & -0.541 & 0.295501 \tabularnewline
40 & -0.034933 & -0.242 & 0.404898 \tabularnewline
41 & -0.024149 & -0.1673 & 0.433914 \tabularnewline
42 & -0.010859 & -0.0752 & 0.47017 \tabularnewline
43 & -0.025813 & -0.1788 & 0.42941 \tabularnewline
44 & 0.003155 & 0.0219 & 0.491325 \tabularnewline
45 & 0.005111 & 0.0354 & 0.485949 \tabularnewline
46 & 0.00774 & 0.0536 & 0.478729 \tabularnewline
47 & 0.003509 & 0.0243 & 0.490351 \tabularnewline
48 & NA & NA & NA \tabularnewline
\hline
\end{tabular}
%Source: https://freestatistics.org/blog/index.php?pk=115019&T=1

[TABLE]
[ROW][C]Autocorrelation Function[/C][/ROW]
[ROW][C]Time lag k[/C][C]ACF(k)[/C][C]T-STAT[/C][C]P-value[/C][/ROW]
[ROW][C]1[/C][C]0.189093[/C][C]1.3101[/C][C]0.098202[/C][/ROW]
[ROW][C]2[/C][C]-0.206369[/C][C]-1.4298[/C][C]0.07963[/C][/ROW]
[ROW][C]3[/C][C]0.182984[/C][C]1.2677[/C][C]0.105501[/C][/ROW]
[ROW][C]4[/C][C]0.00177[/C][C]0.0123[/C][C]0.495134[/C][/ROW]
[ROW][C]5[/C][C]0.029847[/C][C]0.2068[/C][C]0.418527[/C][/ROW]
[ROW][C]6[/C][C]0.243894[/C][C]1.6897[/C][C]0.048781[/C][/ROW]
[ROW][C]7[/C][C]-0.016593[/C][C]-0.115[/C][C]0.454479[/C][/ROW]
[ROW][C]8[/C][C]0.063955[/C][C]0.4431[/C][C]0.329844[/C][/ROW]
[ROW][C]9[/C][C]0.175316[/C][C]1.2146[/C][C]0.115225[/C][/ROW]
[ROW][C]10[/C][C]-0.209488[/C][C]-1.4514[/C][C]0.07659[/C][/ROW]
[ROW][C]11[/C][C]0.082074[/C][C]0.5686[/C][C]0.286131[/C][/ROW]
[ROW][C]12[/C][C]0.576296[/C][C]3.9927[/C][C]0.000112[/C][/ROW]
[ROW][C]13[/C][C]0.016018[/C][C]0.111[/C][C]0.45605[/C][/ROW]
[ROW][C]14[/C][C]-0.262525[/C][C]-1.8188[/C][C]0.03759[/C][/ROW]
[ROW][C]15[/C][C]0.000418[/C][C]0.0029[/C][C]0.49885[/C][/ROW]
[ROW][C]16[/C][C]-0.052392[/C][C]-0.363[/C][C]0.359106[/C][/ROW]
[ROW][C]17[/C][C]-0.000295[/C][C]-0.002[/C][C]0.49919[/C][/ROW]
[ROW][C]18[/C][C]0.028379[/C][C]0.1966[/C][C]0.42248[/C][/ROW]
[ROW][C]19[/C][C]-0.112362[/C][C]-0.7785[/C][C]0.220057[/C][/ROW]
[ROW][C]20[/C][C]-0.06346[/C][C]-0.4397[/C][C]0.331077[/C][/ROW]
[ROW][C]21[/C][C]-0.033689[/C][C]-0.2334[/C][C]0.408221[/C][/ROW]
[ROW][C]22[/C][C]-0.227817[/C][C]-1.5784[/C][C]0.060525[/C][/ROW]
[ROW][C]23[/C][C]-0.046671[/C][C]-0.3233[/C][C]0.373918[/C][/ROW]
[ROW][C]24[/C][C]0.294111[/C][C]2.0377[/C][C]0.023558[/C][/ROW]
[ROW][C]25[/C][C]0.008929[/C][C]0.0619[/C][C]0.475466[/C][/ROW]
[ROW][C]26[/C][C]-0.236842[/C][C]-1.6409[/C][C]0.053679[/C][/ROW]
[ROW][C]27[/C][C]-0.094191[/C][C]-0.6526[/C][C]0.258573[/C][/ROW]
[ROW][C]28[/C][C]-0.112039[/C][C]-0.7762[/C][C]0.220711[/C][/ROW]
[ROW][C]29[/C][C]-0.103706[/C][C]-0.7185[/C][C]0.237967[/C][/ROW]
[ROW][C]30[/C][C]-0.048774[/C][C]-0.3379[/C][C]0.36845[/C][/ROW]
[ROW][C]31[/C][C]-0.126743[/C][C]-0.8781[/C][C]0.192131[/C][/ROW]
[ROW][C]32[/C][C]-0.101527[/C][C]-0.7034[/C][C]0.242603[/C][/ROW]
[ROW][C]33[/C][C]-0.038715[/C][C]-0.2682[/C][C]0.394839[/C][/ROW]
[ROW][C]34[/C][C]-0.098714[/C][C]-0.6839[/C][C]0.24866[/C][/ROW]
[ROW][C]35[/C][C]-0.032603[/C][C]-0.2259[/C][C]0.411126[/C][/ROW]
[ROW][C]36[/C][C]0.126054[/C][C]0.8733[/C][C]0.193417[/C][/ROW]
[ROW][C]37[/C][C]-0.008003[/C][C]-0.0554[/C][C]0.478006[/C][/ROW]
[ROW][C]38[/C][C]-0.131293[/C][C]-0.9096[/C][C]0.183784[/C][/ROW]
[ROW][C]39[/C][C]-0.078088[/C][C]-0.541[/C][C]0.295501[/C][/ROW]
[ROW][C]40[/C][C]-0.034933[/C][C]-0.242[/C][C]0.404898[/C][/ROW]
[ROW][C]41[/C][C]-0.024149[/C][C]-0.1673[/C][C]0.433914[/C][/ROW]
[ROW][C]42[/C][C]-0.010859[/C][C]-0.0752[/C][C]0.47017[/C][/ROW]
[ROW][C]43[/C][C]-0.025813[/C][C]-0.1788[/C][C]0.42941[/C][/ROW]
[ROW][C]44[/C][C]0.003155[/C][C]0.0219[/C][C]0.491325[/C][/ROW]
[ROW][C]45[/C][C]0.005111[/C][C]0.0354[/C][C]0.485949[/C][/ROW]
[ROW][C]46[/C][C]0.00774[/C][C]0.0536[/C][C]0.478729[/C][/ROW]
[ROW][C]47[/C][C]0.003509[/C][C]0.0243[/C][C]0.490351[/C][/ROW]
[ROW][C]48[/C][C]NA[/C][C]NA[/C][C]NA[/C][/ROW]
[/TABLE]
Source: https://freestatistics.org/blog/index.php?pk=115019&T=1

Globally Unique Identifier (entire table): ba.freestatistics.org/blog/index.php?pk=115019&T=1

As an alternative you can also use a QR Code:  

The GUIDs for individual cells are displayed in the table below:

Autocorrelation Function
Time lag kACF(k)T-STATP-value
10.1890931.31010.098202
2-0.206369-1.42980.07963
30.1829841.26770.105501
40.001770.01230.495134
50.0298470.20680.418527
60.2438941.68970.048781
7-0.016593-0.1150.454479
80.0639550.44310.329844
90.1753161.21460.115225
10-0.209488-1.45140.07659
110.0820740.56860.286131
120.5762963.99270.000112
130.0160180.1110.45605
14-0.262525-1.81880.03759
150.0004180.00290.49885
16-0.052392-0.3630.359106
17-0.000295-0.0020.49919
180.0283790.19660.42248
19-0.112362-0.77850.220057
20-0.06346-0.43970.331077
21-0.033689-0.23340.408221
22-0.227817-1.57840.060525
23-0.046671-0.32330.373918
240.2941112.03770.023558
250.0089290.06190.475466
26-0.236842-1.64090.053679
27-0.094191-0.65260.258573
28-0.112039-0.77620.220711
29-0.103706-0.71850.237967
30-0.048774-0.33790.36845
31-0.126743-0.87810.192131
32-0.101527-0.70340.242603
33-0.038715-0.26820.394839
34-0.098714-0.68390.24866
35-0.032603-0.22590.411126
360.1260540.87330.193417
37-0.008003-0.05540.478006
38-0.131293-0.90960.183784
39-0.078088-0.5410.295501
40-0.034933-0.2420.404898
41-0.024149-0.16730.433914
42-0.010859-0.07520.47017
43-0.025813-0.17880.42941
440.0031550.02190.491325
450.0051110.03540.485949
460.007740.05360.478729
470.0035090.02430.490351
48NANANA


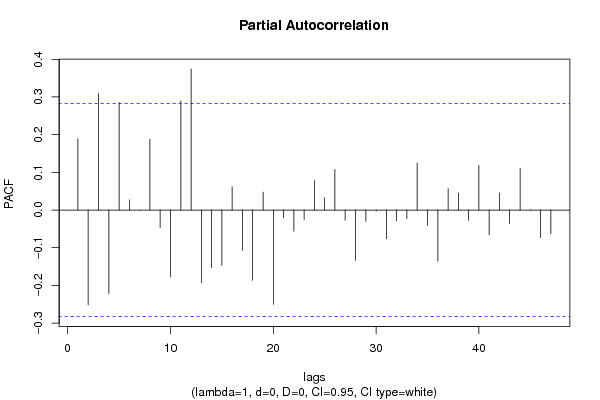
Partial Autocorrelation Function
Time lag kPACF(k)T-STATP-value
10.1890931.31010.098202
2-0.251104-1.73970.04416
30.3091362.14180.018658
4-0.221626-1.53550.065617
50.2853691.97710.026895
60.0269680.18680.426286
7-0.000263-0.00180.499278
80.187791.3010.099726
9-0.047026-0.32580.372994
10-0.177399-1.22910.112522
110.2890082.00230.025459
120.3742672.5930.006287
13-0.193105-1.33790.093621
14-0.152832-1.05890.147483
15-0.14674-1.01660.157211
160.061160.42370.336829
17-0.10701-0.74140.231035
18-0.18655-1.29250.101194
190.0476060.32980.371484
20-0.250184-1.73330.044729
21-0.020662-0.14310.443386
22-0.056514-0.39150.348566
23-0.02485-0.17220.432016
240.078010.54050.295686
250.0328130.22730.410565
260.1077120.74630.229578
27-0.027306-0.18920.425373
28-0.133201-0.92280.180352
29-0.030217-0.20940.41753
30-0.00288-0.020.492083
31-0.076003-0.52660.300461
32-0.028521-0.19760.422095
33-0.022568-0.15640.438205
340.1248440.86490.195685
35-0.04027-0.2790.390722
36-0.13624-0.94390.174974
370.0566950.39280.348106
380.0453390.31410.377397
39-0.027371-0.18960.425198
400.1181080.81830.208621
41-0.065771-0.45570.325339
420.0453520.31420.377362
43-0.0365-0.25290.40072
440.1105090.76560.223822
450.0008180.00570.497751
46-0.072818-0.50450.308109
47-0.062686-0.43430.333008
48NANANA

\begin{tabular}{lllllllll}
\hline
Partial Autocorrelation Function \tabularnewline
Time lag k & PACF(k) & T-STAT & P-value \tabularnewline
1 & 0.189093 & 1.3101 & 0.098202 \tabularnewline
2 & -0.251104 & -1.7397 & 0.04416 \tabularnewline
3 & 0.309136 & 2.1418 & 0.018658 \tabularnewline
4 & -0.221626 & -1.5355 & 0.065617 \tabularnewline
5 & 0.285369 & 1.9771 & 0.026895 \tabularnewline
6 & 0.026968 & 0.1868 & 0.426286 \tabularnewline
7 & -0.000263 & -0.0018 & 0.499278 \tabularnewline
8 & 0.18779 & 1.301 & 0.099726 \tabularnewline
9 & -0.047026 & -0.3258 & 0.372994 \tabularnewline
10 & -0.177399 & -1.2291 & 0.112522 \tabularnewline
11 & 0.289008 & 2.0023 & 0.025459 \tabularnewline
12 & 0.374267 & 2.593 & 0.006287 \tabularnewline
13 & -0.193105 & -1.3379 & 0.093621 \tabularnewline
14 & -0.152832 & -1.0589 & 0.147483 \tabularnewline
15 & -0.14674 & -1.0166 & 0.157211 \tabularnewline
16 & 0.06116 & 0.4237 & 0.336829 \tabularnewline
17 & -0.10701 & -0.7414 & 0.231035 \tabularnewline
18 & -0.18655 & -1.2925 & 0.101194 \tabularnewline
19 & 0.047606 & 0.3298 & 0.371484 \tabularnewline
20 & -0.250184 & -1.7333 & 0.044729 \tabularnewline
21 & -0.020662 & -0.1431 & 0.443386 \tabularnewline
22 & -0.056514 & -0.3915 & 0.348566 \tabularnewline
23 & -0.02485 & -0.1722 & 0.432016 \tabularnewline
24 & 0.07801 & 0.5405 & 0.295686 \tabularnewline
25 & 0.032813 & 0.2273 & 0.410565 \tabularnewline
26 & 0.107712 & 0.7463 & 0.229578 \tabularnewline
27 & -0.027306 & -0.1892 & 0.425373 \tabularnewline
28 & -0.133201 & -0.9228 & 0.180352 \tabularnewline
29 & -0.030217 & -0.2094 & 0.41753 \tabularnewline
30 & -0.00288 & -0.02 & 0.492083 \tabularnewline
31 & -0.076003 & -0.5266 & 0.300461 \tabularnewline
32 & -0.028521 & -0.1976 & 0.422095 \tabularnewline
33 & -0.022568 & -0.1564 & 0.438205 \tabularnewline
34 & 0.124844 & 0.8649 & 0.195685 \tabularnewline
35 & -0.04027 & -0.279 & 0.390722 \tabularnewline
36 & -0.13624 & -0.9439 & 0.174974 \tabularnewline
37 & 0.056695 & 0.3928 & 0.348106 \tabularnewline
38 & 0.045339 & 0.3141 & 0.377397 \tabularnewline
39 & -0.027371 & -0.1896 & 0.425198 \tabularnewline
40 & 0.118108 & 0.8183 & 0.208621 \tabularnewline
41 & -0.065771 & -0.4557 & 0.325339 \tabularnewline
42 & 0.045352 & 0.3142 & 0.377362 \tabularnewline
43 & -0.0365 & -0.2529 & 0.40072 \tabularnewline
44 & 0.110509 & 0.7656 & 0.223822 \tabularnewline
45 & 0.000818 & 0.0057 & 0.497751 \tabularnewline
46 & -0.072818 & -0.5045 & 0.308109 \tabularnewline
47 & -0.062686 & -0.4343 & 0.333008 \tabularnewline
48 & NA & NA & NA \tabularnewline
\hline
\end{tabular}
%Source: https://freestatistics.org/blog/index.php?pk=115019&T=2

[TABLE]
[ROW][C]Partial Autocorrelation Function[/C][/ROW]
[ROW][C]Time lag k[/C][C]PACF(k)[/C][C]T-STAT[/C][C]P-value[/C][/ROW]
[ROW][C]1[/C][C]0.189093[/C][C]1.3101[/C][C]0.098202[/C][/ROW]
[ROW][C]2[/C][C]-0.251104[/C][C]-1.7397[/C][C]0.04416[/C][/ROW]
[ROW][C]3[/C][C]0.309136[/C][C]2.1418[/C][C]0.018658[/C][/ROW]
[ROW][C]4[/C][C]-0.221626[/C][C]-1.5355[/C][C]0.065617[/C][/ROW]
[ROW][C]5[/C][C]0.285369[/C][C]1.9771[/C][C]0.026895[/C][/ROW]
[ROW][C]6[/C][C]0.026968[/C][C]0.1868[/C][C]0.426286[/C][/ROW]
[ROW][C]7[/C][C]-0.000263[/C][C]-0.0018[/C][C]0.499278[/C][/ROW]
[ROW][C]8[/C][C]0.18779[/C][C]1.301[/C][C]0.099726[/C][/ROW]
[ROW][C]9[/C][C]-0.047026[/C][C]-0.3258[/C][C]0.372994[/C][/ROW]
[ROW][C]10[/C][C]-0.177399[/C][C]-1.2291[/C][C]0.112522[/C][/ROW]
[ROW][C]11[/C][C]0.289008[/C][C]2.0023[/C][C]0.025459[/C][/ROW]
[ROW][C]12[/C][C]0.374267[/C][C]2.593[/C][C]0.006287[/C][/ROW]
[ROW][C]13[/C][C]-0.193105[/C][C]-1.3379[/C][C]0.093621[/C][/ROW]
[ROW][C]14[/C][C]-0.152832[/C][C]-1.0589[/C][C]0.147483[/C][/ROW]
[ROW][C]15[/C][C]-0.14674[/C][C]-1.0166[/C][C]0.157211[/C][/ROW]
[ROW][C]16[/C][C]0.06116[/C][C]0.4237[/C][C]0.336829[/C][/ROW]
[ROW][C]17[/C][C]-0.10701[/C][C]-0.7414[/C][C]0.231035[/C][/ROW]
[ROW][C]18[/C][C]-0.18655[/C][C]-1.2925[/C][C]0.101194[/C][/ROW]
[ROW][C]19[/C][C]0.047606[/C][C]0.3298[/C][C]0.371484[/C][/ROW]
[ROW][C]20[/C][C]-0.250184[/C][C]-1.7333[/C][C]0.044729[/C][/ROW]
[ROW][C]21[/C][C]-0.020662[/C][C]-0.1431[/C][C]0.443386[/C][/ROW]
[ROW][C]22[/C][C]-0.056514[/C][C]-0.3915[/C][C]0.348566[/C][/ROW]
[ROW][C]23[/C][C]-0.02485[/C][C]-0.1722[/C][C]0.432016[/C][/ROW]
[ROW][C]24[/C][C]0.07801[/C][C]0.5405[/C][C]0.295686[/C][/ROW]
[ROW][C]25[/C][C]0.032813[/C][C]0.2273[/C][C]0.410565[/C][/ROW]
[ROW][C]26[/C][C]0.107712[/C][C]0.7463[/C][C]0.229578[/C][/ROW]
[ROW][C]27[/C][C]-0.027306[/C][C]-0.1892[/C][C]0.425373[/C][/ROW]
[ROW][C]28[/C][C]-0.133201[/C][C]-0.9228[/C][C]0.180352[/C][/ROW]
[ROW][C]29[/C][C]-0.030217[/C][C]-0.2094[/C][C]0.41753[/C][/ROW]
[ROW][C]30[/C][C]-0.00288[/C][C]-0.02[/C][C]0.492083[/C][/ROW]
[ROW][C]31[/C][C]-0.076003[/C][C]-0.5266[/C][C]0.300461[/C][/ROW]
[ROW][C]32[/C][C]-0.028521[/C][C]-0.1976[/C][C]0.422095[/C][/ROW]
[ROW][C]33[/C][C]-0.022568[/C][C]-0.1564[/C][C]0.438205[/C][/ROW]
[ROW][C]34[/C][C]0.124844[/C][C]0.8649[/C][C]0.195685[/C][/ROW]
[ROW][C]35[/C][C]-0.04027[/C][C]-0.279[/C][C]0.390722[/C][/ROW]
[ROW][C]36[/C][C]-0.13624[/C][C]-0.9439[/C][C]0.174974[/C][/ROW]
[ROW][C]37[/C][C]0.056695[/C][C]0.3928[/C][C]0.348106[/C][/ROW]
[ROW][C]38[/C][C]0.045339[/C][C]0.3141[/C][C]0.377397[/C][/ROW]
[ROW][C]39[/C][C]-0.027371[/C][C]-0.1896[/C][C]0.425198[/C][/ROW]
[ROW][C]40[/C][C]0.118108[/C][C]0.8183[/C][C]0.208621[/C][/ROW]
[ROW][C]41[/C][C]-0.065771[/C][C]-0.4557[/C][C]0.325339[/C][/ROW]
[ROW][C]42[/C][C]0.045352[/C][C]0.3142[/C][C]0.377362[/C][/ROW]
[ROW][C]43[/C][C]-0.0365[/C][C]-0.2529[/C][C]0.40072[/C][/ROW]
[ROW][C]44[/C][C]0.110509[/C][C]0.7656[/C][C]0.223822[/C][/ROW]
[ROW][C]45[/C][C]0.000818[/C][C]0.0057[/C][C]0.497751[/C][/ROW]
[ROW][C]46[/C][C]-0.072818[/C][C]-0.5045[/C][C]0.308109[/C][/ROW]
[ROW][C]47[/C][C]-0.062686[/C][C]-0.4343[/C][C]0.333008[/C][/ROW]
[ROW][C]48[/C][C]NA[/C][C]NA[/C][C]NA[/C][/ROW]
[/TABLE]
Source: https://freestatistics.org/blog/index.php?pk=115019&T=2

Globally Unique Identifier (entire table): ba.freestatistics.org/blog/index.php?pk=115019&T=2

As an alternative you can also use a QR Code:  

The GUIDs for individual cells are displayed in the table below:

Partial Autocorrelation Function
Time lag kPACF(k)T-STATP-value
10.1890931.31010.098202
2-0.251104-1.73970.04416
30.3091362.14180.018658
4-0.221626-1.53550.065617
50.2853691.97710.026895
60.0269680.18680.426286
7-0.000263-0.00180.499278
80.187791.3010.099726
9-0.047026-0.32580.372994
10-0.177399-1.22910.112522
110.2890082.00230.025459
120.3742672.5930.006287
13-0.193105-1.33790.093621
14-0.152832-1.05890.147483
15-0.14674-1.01660.157211
160.061160.42370.336829
17-0.10701-0.74140.231035
18-0.18655-1.29250.101194
190.0476060.32980.371484
20-0.250184-1.73330.044729
21-0.020662-0.14310.443386
22-0.056514-0.39150.348566
23-0.02485-0.17220.432016
240.078010.54050.295686
250.0328130.22730.410565
260.1077120.74630.229578
27-0.027306-0.18920.425373
28-0.133201-0.92280.180352
29-0.030217-0.20940.41753
30-0.00288-0.020.492083
31-0.076003-0.52660.300461
32-0.028521-0.19760.422095
33-0.022568-0.15640.438205
340.1248440.86490.195685
35-0.04027-0.2790.390722
36-0.13624-0.94390.174974
370.0566950.39280.348106
380.0453390.31410.377397
39-0.027371-0.18960.425198
400.1181080.81830.208621
41-0.065771-0.45570.325339
420.0453520.31420.377362
43-0.0365-0.25290.40072
440.1105090.76560.223822
450.0008180.00570.497751
46-0.072818-0.50450.308109
47-0.062686-0.43430.333008
48NANANA


Parameters (Session):
par1 = 48 ; par2 = 1 ; par3 = 0 ; par4 = 0 ; par5 = 12 ; par6 = White Noise ; par7 = 0.95 ;
Parameters (R input):
par1 = 48 ; par2 = 1 ; par3 = 0 ; par4 = 0 ; par5 = 12 ; par6 = White Noise ; par7 = 0.95 ; par8 = ;
R code (references can be found in the software module):
if (par1 == 'Default') {
par1 = 10*log10(length(x))
} else {
par1 <- as.numeric(par1)
}
par2 <- as.numeric(par2)
par3 <- as.numeric(par3)
par4 <- as.numeric(par4)
par5 <- as.numeric(par5)
if (par6 == 'White Noise') par6 <- 'white' else par6 <- 'ma'
par7 <- as.numeric(par7)
if (par8 != '') par8 <- as.numeric(par8)
ox <- x
if (par8 == '') {
if (par2 == 0) {
x <- log(x)
} else {
x <- (x ^ par2 - 1) / par2
}
} else {
x <- log(x,base=par8)
}
if (par3 > 0) x <- diff(x,lag=1,difference=par3)
if (par4 > 0) x <- diff(x,lag=par5,difference=par4)
bitmap(file='picts.png')
op <- par(mfrow=c(2,1))
plot(ox,type='l',main='Original Time Series',xlab='time',ylab='value')
if (par8=='') {
mytitle <- paste('Working Time Series (lambda=',par2,', d=',par3,', D=',par4,')',sep='')
mysub <- paste('(lambda=',par2,', d=',par3,', D=',par4,', CI=', par7, ', CI type=',par6,')',sep='')
} else {
mytitle <- paste('Working Time Series (base=',par8,', d=',par3,', D=',par4,')',sep='')
mysub <- paste('(base=',par8,', d=',par3,', D=',par4,', CI=', par7, ', CI type=',par6,')',sep='')
}
plot(x,type='l', main=mytitle,xlab='time',ylab='value')
par(op)
dev.off()
bitmap(file='pic1.png')
racf <- acf(x, par1, main='Autocorrelation', xlab='time lag', ylab='ACF', ci.type=par6, ci=par7, sub=mysub)
dev.off()
bitmap(file='pic2.png')
rpacf <- pacf(x,par1,main='Partial Autocorrelation',xlab='lags',ylab='PACF',sub=mysub)
dev.off()
(myacf <- c(racf$acf))
(mypacf <- c(rpacf$acf))
lengthx <- length(x)
sqrtn <- sqrt(lengthx)
load(file='createtable')
a<-table.start()
a<-table.row.start(a)
a<-table.element(a,'Autocorrelation Function',4,TRUE)
a<-table.row.end(a)
a<-table.row.start(a)
a<-table.element(a,'Time lag k',header=TRUE)
a<-table.element(a,hyperlink('basics.htm','ACF(k)','click here for more information about the Autocorrelation Function'),header=TRUE)
a<-table.element(a,'T-STAT',header=TRUE)
a<-table.element(a,'P-value',header=TRUE)
a<-table.row.end(a)
for (i in 2:(par1+1)) {
a<-table.row.start(a)
a<-table.element(a,i-1,header=TRUE)
a<-table.element(a,round(myacf[i],6))
mytstat <- myacf[i]*sqrtn
a<-table.element(a,round(mytstat,4))
a<-table.element(a,round(1-pt(abs(mytstat),lengthx),6))
a<-table.row.end(a)
}
a<-table.end(a)
table.save(a,file='mytable.tab')
a<-table.start()
a<-table.row.start(a)
a<-table.element(a,'Partial Autocorrelation Function',4,TRUE)
a<-table.row.end(a)
a<-table.row.start(a)
a<-table.element(a,'Time lag k',header=TRUE)
a<-table.element(a,hyperlink('basics.htm','PACF(k)','click here for more information about the Partial Autocorrelation Function'),header=TRUE)
a<-table.element(a,'T-STAT',header=TRUE)
a<-table.element(a,'P-value',header=TRUE)
a<-table.row.end(a)
for (i in 1:par1) {
a<-table.row.start(a)
a<-table.element(a,i,header=TRUE)
a<-table.element(a,round(mypacf[i],6))
mytstat <- mypacf[i]*sqrtn
a<-table.element(a,round(mytstat,4))
a<-table.element(a,round(1-pt(abs(mytstat),lengthx),6))
a<-table.row.end(a)
}
a<-table.end(a)
table.save(a,file='mytable1.tab')