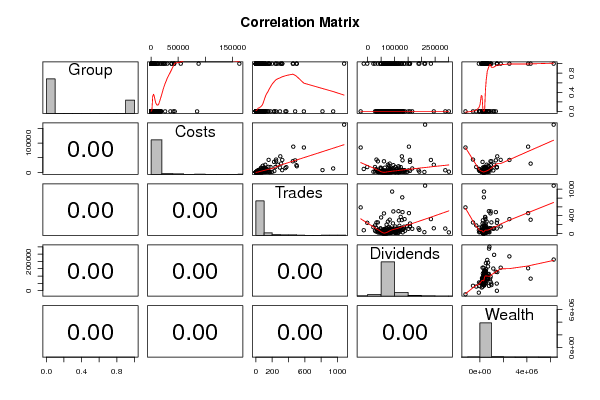
| Correlations for all pairs of data series (method=pearson) | |||||
| Group | Costs | Trades | Dividends | Wealth | |
| Group | 1 | 0.184 | 0.159 | 0.147 | 0.218 |
| Costs | 0.184 | 1 | 0.764 | 0.317 | 0.702 |
| Trades | 0.159 | 0.764 | 1 | 0.347 | 0.516 |
| Dividends | 0.147 | 0.317 | 0.347 | 1 | 0.442 |
| Wealth | 0.218 | 0.702 | 0.516 | 0.442 | 1 |
| Correlations for all pairs of data series with p-values | |||
| pair | Pearson r | Spearman rho | Kendall tau |
| Group;Costs | 0.1839 | 0.1909 | 0.1617 |
| p-value | (1e-04) | (1e-04) | (1e-04) |
| Group;Trades | 0.1586 | 0.1583 | 0.1344 |
| p-value | (0.001) | (0.001) | (0.001) |
| Group;Dividends | 0.1474 | 0.1743 | 0.1476 |
| p-value | (0.0022) | (3e-04) | (3e-04) |
| Group;Wealth | 0.218 | 0.1481 | 0.1254 |
| p-value | (0) | (0.002) | (0.0021) |
| Costs;Trades | 0.7644 | 0.9357 | 0.8021 |
| p-value | (0) | (0) | (0) |
| Costs;Dividends | 0.3169 | 0.428 | 0.3504 |
| p-value | (0) | (0) | (0) |
| Costs;Wealth | 0.7019 | 0.3269 | 0.2405 |
| p-value | (0) | (0) | (0) |
| Trades;Dividends | 0.3472 | 0.4191 | 0.3349 |
| p-value | (0) | (0) | (0) |
| Trades;Wealth | 0.5159 | 0.3575 | 0.2586 |
| p-value | (0) | (0) | (0) |
| Dividends;Wealth | 0.4423 | 0.4309 | 0.3396 |
| p-value | (0) | (0) | (0) |