Free Statistics

of Irreproducible Research!

Author's title

Author*The author of this computation has been verified*
R Software Modulerwasp_arimabackwardselection.wasp
Title produced by softwareARIMA Backward Selection
Date of computationFri, 24 Dec 2010 14:20:19 +0000
Cite this page as followsStatistical Computations at FreeStatistics.org, Office for Research Development and Education, URL https://freestatistics.org/blog/index.php?v=date/2010/Dec/24/t1293200332u65cra4zzqrwq8q.htm/, Retrieved Tue, 30 Apr 2024 07:09:51 +0000
Statistical Computations at FreeStatistics.org, Office for Research Development and Education, URL https://freestatistics.org/blog/index.php?pk=114991, Retrieved Tue, 30 Apr 2024 07:09:51 +0000
QR Codes:

Original text written by user:
IsPrivate?No (this computation is public)
User-defined keywords
Estimated Impact134
Family? (F = Feedback message, R = changed R code, M = changed R Module, P = changed Parameters, D = changed Data)
-     [Univariate Data Series] [data set] [2008-12-01 19:54:57] [b98453cac15ba1066b407e146608df68]
- RMP   [Standard Deviation-Mean Plot] [Unemployment] [2010-11-29 10:34:47] [b98453cac15ba1066b407e146608df68]
- RMP     [ARIMA Backward Selection] [Unemployment] [2010-11-29 17:10:28] [b98453cac15ba1066b407e146608df68]
-   PD      [ARIMA Backward Selection] [Arima - Parameter...] [2010-12-12 13:50:49] [aeb27d5c05332f2e597ad139ee63fbe4]
-    D          [ARIMA Backward Selection] [Arima Parameters ...] [2010-12-24 14:20:19] [18ef3d986e8801a4b28404e69e5bf56b] [Current]
Feedback Forum

Post a new message
Dataseries X:
44164
40399
36763
37903
35532
35533
32110
33374
35462
33508
36080
34560
38737
38144
37594
36424
36843
37246
38661
40454
44928
48441
48140
45998
47369
49554
47510
44873
45344
42413
36912
43452
42142
44382
43636
44167
44423
42868
43908
42013
38846
35087
33026
34646
37135
37985
43121
43722
43630
42234
39351
39327
35704
30466
28155
29257
29998
32529
34787
33855
34556
31348
30805
28353
24514
21106
21346
23335
24379
26290
30084
29429
30632
27349
27264
27474
24482
21453
18788
19282
19713
21917
23812
23785
24696
24562
23580
24939
23899
21454
19761
19815
20780
23462
25005
24725
26198
27543
26471
26558
25317
22896


Summary of computational transaction
Raw Inputview raw input (R code)
Raw Outputview raw output of R engine
Computing time14 seconds
R Server'Sir Ronald Aylmer Fisher' @ 193.190.124.24

\begin{tabular}{lllllllll}
\hline
Summary of computational transaction \tabularnewline
Raw Input & view raw input (R code)  \tabularnewline
Raw Output & view raw output of R engine  \tabularnewline
Computing time & 14 seconds \tabularnewline
R Server & 'Sir Ronald Aylmer Fisher' @ 193.190.124.24 \tabularnewline
\hline
\end{tabular}
%Source: https://freestatistics.org/blog/index.php?pk=114991&T=0

[TABLE]
[ROW][C]Summary of computational transaction[/C][/ROW]
[ROW][C]Raw Input[/C][C]view raw input (R code) [/C][/ROW]
[ROW][C]Raw Output[/C][C]view raw output of R engine [/C][/ROW]
[ROW][C]Computing time[/C][C]14 seconds[/C][/ROW]
[ROW][C]R Server[/C][C]'Sir Ronald Aylmer Fisher' @ 193.190.124.24[/C][/ROW]
[/TABLE]
Source: https://freestatistics.org/blog/index.php?pk=114991&T=0

Globally Unique Identifier (entire table): ba.freestatistics.org/blog/index.php?pk=114991&T=0

As an alternative you can also use a QR Code:  

The GUIDs for individual cells are displayed in the table below:

Summary of computational transaction
Raw Inputview raw input (R code)
Raw Outputview raw output of R engine
Computing time14 seconds
R Server'Sir Ronald Aylmer Fisher' @ 193.190.124.24


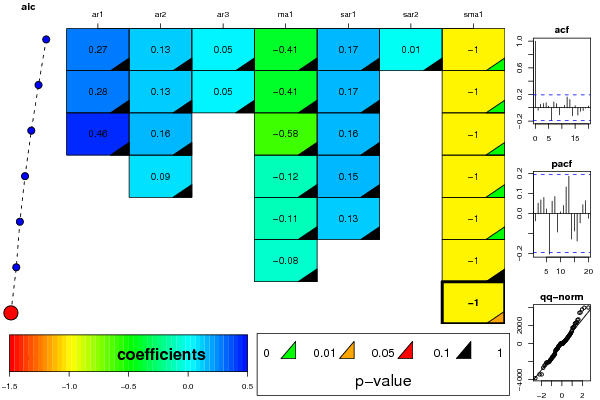
ARIMA Parameter Estimation and Backward Selection
Iterationar1ar2ar3ma1sar1sar2sma1
Estimates ( 1 )0.2740.12880.0514-0.40570.17340.01-0.9998
(p-val)(0.6878 )(0.3545 )(0.6946 )(0.5486 )(0.2186 )(0.9441 )(0 )
Estimates ( 2 )0.27860.12910.0514-0.40970.17120-1
(p-val)(0.6788 )(0.3512 )(0.6944 )(0.5395 )(0.2124 )(NA )(0 )
Estimates ( 3 )0.45820.1580-0.58020.1640-1.0003
(p-val)(0.3574 )(0.1767 )(NA )(0.244 )(0.2242 )(NA )(0 )
Estimates ( 4 )00.09060-0.12190.15220-1
(p-val)(NA )(0.4169 )(NA )(0.2773 )(0.251 )(NA )(0 )
Estimates ( 5 )000-0.1060.1320-1
(p-val)(NA )(NA )(NA )(0.2964 )(0.3095 )(NA )(0 )
Estimates ( 6 )000-0.078600-0.9977
(p-val)(NA )(NA )(NA )(0.4349 )(NA )(NA )(0.1817 )
Estimates ( 7 )000000-1
(p-val)(NA )(NA )(NA )(NA )(NA )(NA )(0.0138 )
Estimates ( 8 )NANANANANANANA
(p-val)(NA )(NA )(NA )(NA )(NA )(NA )(NA )
Estimates ( 9 )NANANANANANANA
(p-val)(NA )(NA )(NA )(NA )(NA )(NA )(NA )
Estimates ( 10 )NANANANANANANA
(p-val)(NA )(NA )(NA )(NA )(NA )(NA )(NA )
Estimates ( 11 )NANANANANANANA
(p-val)(NA )(NA )(NA )(NA )(NA )(NA )(NA )
Estimates ( 12 )NANANANANANANA
(p-val)(NA )(NA )(NA )(NA )(NA )(NA )(NA )
Estimates ( 13 )NANANANANANANA
(p-val)(NA )(NA )(NA )(NA )(NA )(NA )(NA )

\begin{tabular}{lllllllll}
\hline
ARIMA Parameter Estimation and Backward Selection \tabularnewline
Iteration & ar1 & ar2 & ar3 & ma1 & sar1 & sar2 & sma1 \tabularnewline
Estimates ( 1 ) & 0.274 & 0.1288 & 0.0514 & -0.4057 & 0.1734 & 0.01 & -0.9998 \tabularnewline
(p-val) & (0.6878 ) & (0.3545 ) & (0.6946 ) & (0.5486 ) & (0.2186 ) & (0.9441 ) & (0 ) \tabularnewline
Estimates ( 2 ) & 0.2786 & 0.1291 & 0.0514 & -0.4097 & 0.1712 & 0 & -1 \tabularnewline
(p-val) & (0.6788 ) & (0.3512 ) & (0.6944 ) & (0.5395 ) & (0.2124 ) & (NA ) & (0 ) \tabularnewline
Estimates ( 3 ) & 0.4582 & 0.158 & 0 & -0.5802 & 0.164 & 0 & -1.0003 \tabularnewline
(p-val) & (0.3574 ) & (0.1767 ) & (NA ) & (0.244 ) & (0.2242 ) & (NA ) & (0 ) \tabularnewline
Estimates ( 4 ) & 0 & 0.0906 & 0 & -0.1219 & 0.1522 & 0 & -1 \tabularnewline
(p-val) & (NA ) & (0.4169 ) & (NA ) & (0.2773 ) & (0.251 ) & (NA ) & (0 ) \tabularnewline
Estimates ( 5 ) & 0 & 0 & 0 & -0.106 & 0.132 & 0 & -1 \tabularnewline
(p-val) & (NA ) & (NA ) & (NA ) & (0.2964 ) & (0.3095 ) & (NA ) & (0 ) \tabularnewline
Estimates ( 6 ) & 0 & 0 & 0 & -0.0786 & 0 & 0 & -0.9977 \tabularnewline
(p-val) & (NA ) & (NA ) & (NA ) & (0.4349 ) & (NA ) & (NA ) & (0.1817 ) \tabularnewline
Estimates ( 7 ) & 0 & 0 & 0 & 0 & 0 & 0 & -1 \tabularnewline
(p-val) & (NA ) & (NA ) & (NA ) & (NA ) & (NA ) & (NA ) & (0.0138 ) \tabularnewline
Estimates ( 8 ) & NA & NA & NA & NA & NA & NA & NA \tabularnewline
(p-val) & (NA ) & (NA ) & (NA ) & (NA ) & (NA ) & (NA ) & (NA ) \tabularnewline
Estimates ( 9 ) & NA & NA & NA & NA & NA & NA & NA \tabularnewline
(p-val) & (NA ) & (NA ) & (NA ) & (NA ) & (NA ) & (NA ) & (NA ) \tabularnewline
Estimates ( 10 ) & NA & NA & NA & NA & NA & NA & NA \tabularnewline
(p-val) & (NA ) & (NA ) & (NA ) & (NA ) & (NA ) & (NA ) & (NA ) \tabularnewline
Estimates ( 11 ) & NA & NA & NA & NA & NA & NA & NA \tabularnewline
(p-val) & (NA ) & (NA ) & (NA ) & (NA ) & (NA ) & (NA ) & (NA ) \tabularnewline
Estimates ( 12 ) & NA & NA & NA & NA & NA & NA & NA \tabularnewline
(p-val) & (NA ) & (NA ) & (NA ) & (NA ) & (NA ) & (NA ) & (NA ) \tabularnewline
Estimates ( 13 ) & NA & NA & NA & NA & NA & NA & NA \tabularnewline
(p-val) & (NA ) & (NA ) & (NA ) & (NA ) & (NA ) & (NA ) & (NA ) \tabularnewline
\hline
\end{tabular}
%Source: https://freestatistics.org/blog/index.php?pk=114991&T=1

[TABLE]
[ROW][C]ARIMA Parameter Estimation and Backward Selection[/C][/ROW]
[ROW][C]Iteration[/C][C]ar1[/C][C]ar2[/C][C]ar3[/C][C]ma1[/C][C]sar1[/C][C]sar2[/C][C]sma1[/C][/ROW]
[ROW][C]Estimates ( 1 )[/C][C]0.274[/C][C]0.1288[/C][C]0.0514[/C][C]-0.4057[/C][C]0.1734[/C][C]0.01[/C][C]-0.9998[/C][/ROW]
[ROW][C](p-val)[/C][C](0.6878 )[/C][C](0.3545 )[/C][C](0.6946 )[/C][C](0.5486 )[/C][C](0.2186 )[/C][C](0.9441 )[/C][C](0 )[/C][/ROW]
[ROW][C]Estimates ( 2 )[/C][C]0.2786[/C][C]0.1291[/C][C]0.0514[/C][C]-0.4097[/C][C]0.1712[/C][C]0[/C][C]-1[/C][/ROW]
[ROW][C](p-val)[/C][C](0.6788 )[/C][C](0.3512 )[/C][C](0.6944 )[/C][C](0.5395 )[/C][C](0.2124 )[/C][C](NA )[/C][C](0 )[/C][/ROW]
[ROW][C]Estimates ( 3 )[/C][C]0.4582[/C][C]0.158[/C][C]0[/C][C]-0.5802[/C][C]0.164[/C][C]0[/C][C]-1.0003[/C][/ROW]
[ROW][C](p-val)[/C][C](0.3574 )[/C][C](0.1767 )[/C][C](NA )[/C][C](0.244 )[/C][C](0.2242 )[/C][C](NA )[/C][C](0 )[/C][/ROW]
[ROW][C]Estimates ( 4 )[/C][C]0[/C][C]0.0906[/C][C]0[/C][C]-0.1219[/C][C]0.1522[/C][C]0[/C][C]-1[/C][/ROW]
[ROW][C](p-val)[/C][C](NA )[/C][C](0.4169 )[/C][C](NA )[/C][C](0.2773 )[/C][C](0.251 )[/C][C](NA )[/C][C](0 )[/C][/ROW]
[ROW][C]Estimates ( 5 )[/C][C]0[/C][C]0[/C][C]0[/C][C]-0.106[/C][C]0.132[/C][C]0[/C][C]-1[/C][/ROW]
[ROW][C](p-val)[/C][C](NA )[/C][C](NA )[/C][C](NA )[/C][C](0.2964 )[/C][C](0.3095 )[/C][C](NA )[/C][C](0 )[/C][/ROW]
[ROW][C]Estimates ( 6 )[/C][C]0[/C][C]0[/C][C]0[/C][C]-0.0786[/C][C]0[/C][C]0[/C][C]-0.9977[/C][/ROW]
[ROW][C](p-val)[/C][C](NA )[/C][C](NA )[/C][C](NA )[/C][C](0.4349 )[/C][C](NA )[/C][C](NA )[/C][C](0.1817 )[/C][/ROW]
[ROW][C]Estimates ( 7 )[/C][C]0[/C][C]0[/C][C]0[/C][C]0[/C][C]0[/C][C]0[/C][C]-1[/C][/ROW]
[ROW][C](p-val)[/C][C](NA )[/C][C](NA )[/C][C](NA )[/C][C](NA )[/C][C](NA )[/C][C](NA )[/C][C](0.0138 )[/C][/ROW]
[ROW][C]Estimates ( 8 )[/C][C]NA[/C][C]NA[/C][C]NA[/C][C]NA[/C][C]NA[/C][C]NA[/C][C]NA[/C][/ROW]
[ROW][C](p-val)[/C][C](NA )[/C][C](NA )[/C][C](NA )[/C][C](NA )[/C][C](NA )[/C][C](NA )[/C][C](NA )[/C][/ROW]
[ROW][C]Estimates ( 9 )[/C][C]NA[/C][C]NA[/C][C]NA[/C][C]NA[/C][C]NA[/C][C]NA[/C][C]NA[/C][/ROW]
[ROW][C](p-val)[/C][C](NA )[/C][C](NA )[/C][C](NA )[/C][C](NA )[/C][C](NA )[/C][C](NA )[/C][C](NA )[/C][/ROW]
[ROW][C]Estimates ( 10 )[/C][C]NA[/C][C]NA[/C][C]NA[/C][C]NA[/C][C]NA[/C][C]NA[/C][C]NA[/C][/ROW]
[ROW][C](p-val)[/C][C](NA )[/C][C](NA )[/C][C](NA )[/C][C](NA )[/C][C](NA )[/C][C](NA )[/C][C](NA )[/C][/ROW]
[ROW][C]Estimates ( 11 )[/C][C]NA[/C][C]NA[/C][C]NA[/C][C]NA[/C][C]NA[/C][C]NA[/C][C]NA[/C][/ROW]
[ROW][C](p-val)[/C][C](NA )[/C][C](NA )[/C][C](NA )[/C][C](NA )[/C][C](NA )[/C][C](NA )[/C][C](NA )[/C][/ROW]
[ROW][C]Estimates ( 12 )[/C][C]NA[/C][C]NA[/C][C]NA[/C][C]NA[/C][C]NA[/C][C]NA[/C][C]NA[/C][/ROW]
[ROW][C](p-val)[/C][C](NA )[/C][C](NA )[/C][C](NA )[/C][C](NA )[/C][C](NA )[/C][C](NA )[/C][C](NA )[/C][/ROW]
[ROW][C]Estimates ( 13 )[/C][C]NA[/C][C]NA[/C][C]NA[/C][C]NA[/C][C]NA[/C][C]NA[/C][C]NA[/C][/ROW]
[ROW][C](p-val)[/C][C](NA )[/C][C](NA )[/C][C](NA )[/C][C](NA )[/C][C](NA )[/C][C](NA )[/C][C](NA )[/C][/ROW]
[/TABLE]
Source: https://freestatistics.org/blog/index.php?pk=114991&T=1

Globally Unique Identifier (entire table): ba.freestatistics.org/blog/index.php?pk=114991&T=1

As an alternative you can also use a QR Code:  

The GUIDs for individual cells are displayed in the table below:

ARIMA Parameter Estimation and Backward Selection
Iterationar1ar2ar3ma1sar1sar2sma1
Estimates ( 1 )0.2740.12880.0514-0.40570.17340.01-0.9998
(p-val)(0.6878 )(0.3545 )(0.6946 )(0.5486 )(0.2186 )(0.9441 )(0 )
Estimates ( 2 )0.27860.12910.0514-0.40970.17120-1
(p-val)(0.6788 )(0.3512 )(0.6944 )(0.5395 )(0.2124 )(NA )(0 )
Estimates ( 3 )0.45820.1580-0.58020.1640-1.0003
(p-val)(0.3574 )(0.1767 )(NA )(0.244 )(0.2242 )(NA )(0 )
Estimates ( 4 )00.09060-0.12190.15220-1
(p-val)(NA )(0.4169 )(NA )(0.2773 )(0.251 )(NA )(0 )
Estimates ( 5 )000-0.1060.1320-1
(p-val)(NA )(NA )(NA )(0.2964 )(0.3095 )(NA )(0 )
Estimates ( 6 )000-0.078600-0.9977
(p-val)(NA )(NA )(NA )(0.4349 )(NA )(NA )(0.1817 )
Estimates ( 7 )000000-1
(p-val)(NA )(NA )(NA )(NA )(NA )(NA )(0.0138 )
Estimates ( 8 )NANANANANANANA
(p-val)(NA )(NA )(NA )(NA )(NA )(NA )(NA )
Estimates ( 9 )NANANANANANANA
(p-val)(NA )(NA )(NA )(NA )(NA )(NA )(NA )
Estimates ( 10 )NANANANANANANA
(p-val)(NA )(NA )(NA )(NA )(NA )(NA )(NA )
Estimates ( 11 )NANANANANANANA
(p-val)(NA )(NA )(NA )(NA )(NA )(NA )(NA )
Estimates ( 12 )NANANANANANANA
(p-val)(NA )(NA )(NA )(NA )(NA )(NA )(NA )
Estimates ( 13 )NANANANANANANA
(p-val)(NA )(NA )(NA )(NA )(NA )(NA )(NA )


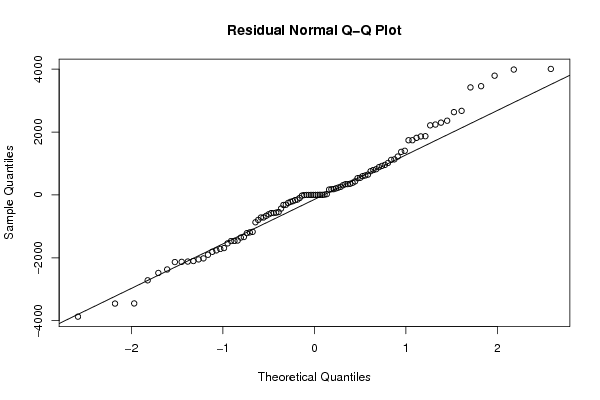
Estimated ARIMA Residuals
Value
-147.826066663623
2238.51297053823
2359.87483395732
-1449.98823408313
1861.04485769614
430.661862085229
3458.60124930771
646.058695199012
1739.66151058062
4006.68951553663
-1719.28392057718
-575.688088629192
-2128.27131604289
3419.71213819808
308.502215360756
-2119.13729050271
1016.25448028340
-2481.26751870816
-3871.08862568888
3792.31982323137
-3455.01057714190
922.252358135583
-1465.69642083271
1815.46030370953
-2017.77690746499
-869.475043292874
2633.89158638264
-665.304587408435
-2370.17777372114
-2715.10906432759
169.824011233324
-1355.78204489664
533.542936046002
-319.157604564192
3987.11895062398
1739.12598407361
-1689.18541662456
-543.947891123456
-1462.51853820954
884.841526030664
-2134.23068235969
-3450.92188789189
-198.224283564799
-1539.93549586108
-1190.46559340156
1132.03582290952
619.631251788837
-219.607440237834
-719.22141611945
-2050.41755313472
818.245087541027
-1338.42064825063
-2101.91670162007
-1173.39925248942
2298.76094769557
-253.353038693245
-616.197195029518
385.619986138646
1867.38067337042
180.824149010268
-95.0370398256055
-1763.04145138124
1113.67614797106
1369.37844318859
-794.875836511573
-563.278738703531
-716.153011928976
-1808.73694189458
-1214.25216076101
542.99316144218
-164.890495653356
597.944337601865
-312.922621446362
1404.00908678077
354.697910094941
2214.01722511453
1220.43706940638
209.085010474083
344.826728950765
-1902.62240021539
-577.893269151195
955.100165337919
-434.344544370957
257.988741739936
232.873048615491
2673.78605530612
340.654917047013
754.108948123252
792.420534632403
184.740327032007

\begin{tabular}{lllllllll}
\hline
Estimated ARIMA Residuals \tabularnewline
Value \tabularnewline
-147.826066663623 \tabularnewline
2238.51297053823 \tabularnewline
2359.87483395732 \tabularnewline
-1449.98823408313 \tabularnewline
1861.04485769614 \tabularnewline
430.661862085229 \tabularnewline
3458.60124930771 \tabularnewline
646.058695199012 \tabularnewline
1739.66151058062 \tabularnewline
4006.68951553663 \tabularnewline
-1719.28392057718 \tabularnewline
-575.688088629192 \tabularnewline
-2128.27131604289 \tabularnewline
3419.71213819808 \tabularnewline
308.502215360756 \tabularnewline
-2119.13729050271 \tabularnewline
1016.25448028340 \tabularnewline
-2481.26751870816 \tabularnewline
-3871.08862568888 \tabularnewline
3792.31982323137 \tabularnewline
-3455.01057714190 \tabularnewline
922.252358135583 \tabularnewline
-1465.69642083271 \tabularnewline
1815.46030370953 \tabularnewline
-2017.77690746499 \tabularnewline
-869.475043292874 \tabularnewline
2633.89158638264 \tabularnewline
-665.304587408435 \tabularnewline
-2370.17777372114 \tabularnewline
-2715.10906432759 \tabularnewline
169.824011233324 \tabularnewline
-1355.78204489664 \tabularnewline
533.542936046002 \tabularnewline
-319.157604564192 \tabularnewline
3987.11895062398 \tabularnewline
1739.12598407361 \tabularnewline
-1689.18541662456 \tabularnewline
-543.947891123456 \tabularnewline
-1462.51853820954 \tabularnewline
884.841526030664 \tabularnewline
-2134.23068235969 \tabularnewline
-3450.92188789189 \tabularnewline
-198.224283564799 \tabularnewline
-1539.93549586108 \tabularnewline
-1190.46559340156 \tabularnewline
1132.03582290952 \tabularnewline
619.631251788837 \tabularnewline
-219.607440237834 \tabularnewline
-719.22141611945 \tabularnewline
-2050.41755313472 \tabularnewline
818.245087541027 \tabularnewline
-1338.42064825063 \tabularnewline
-2101.91670162007 \tabularnewline
-1173.39925248942 \tabularnewline
2298.76094769557 \tabularnewline
-253.353038693245 \tabularnewline
-616.197195029518 \tabularnewline
385.619986138646 \tabularnewline
1867.38067337042 \tabularnewline
180.824149010268 \tabularnewline
-95.0370398256055 \tabularnewline
-1763.04145138124 \tabularnewline
1113.67614797106 \tabularnewline
1369.37844318859 \tabularnewline
-794.875836511573 \tabularnewline
-563.278738703531 \tabularnewline
-716.153011928976 \tabularnewline
-1808.73694189458 \tabularnewline
-1214.25216076101 \tabularnewline
542.99316144218 \tabularnewline
-164.890495653356 \tabularnewline
597.944337601865 \tabularnewline
-312.922621446362 \tabularnewline
1404.00908678077 \tabularnewline
354.697910094941 \tabularnewline
2214.01722511453 \tabularnewline
1220.43706940638 \tabularnewline
209.085010474083 \tabularnewline
344.826728950765 \tabularnewline
-1902.62240021539 \tabularnewline
-577.893269151195 \tabularnewline
955.100165337919 \tabularnewline
-434.344544370957 \tabularnewline
257.988741739936 \tabularnewline
232.873048615491 \tabularnewline
2673.78605530612 \tabularnewline
340.654917047013 \tabularnewline
754.108948123252 \tabularnewline
792.420534632403 \tabularnewline
184.740327032007 \tabularnewline
\hline
\end{tabular}
%Source: https://freestatistics.org/blog/index.php?pk=114991&T=2

[TABLE]
[ROW][C]Estimated ARIMA Residuals[/C][/ROW]
[ROW][C]Value[/C][/ROW]
[ROW][C]-147.826066663623[/C][/ROW]
[ROW][C]2238.51297053823[/C][/ROW]
[ROW][C]2359.87483395732[/C][/ROW]
[ROW][C]-1449.98823408313[/C][/ROW]
[ROW][C]1861.04485769614[/C][/ROW]
[ROW][C]430.661862085229[/C][/ROW]
[ROW][C]3458.60124930771[/C][/ROW]
[ROW][C]646.058695199012[/C][/ROW]
[ROW][C]1739.66151058062[/C][/ROW]
[ROW][C]4006.68951553663[/C][/ROW]
[ROW][C]-1719.28392057718[/C][/ROW]
[ROW][C]-575.688088629192[/C][/ROW]
[ROW][C]-2128.27131604289[/C][/ROW]
[ROW][C]3419.71213819808[/C][/ROW]
[ROW][C]308.502215360756[/C][/ROW]
[ROW][C]-2119.13729050271[/C][/ROW]
[ROW][C]1016.25448028340[/C][/ROW]
[ROW][C]-2481.26751870816[/C][/ROW]
[ROW][C]-3871.08862568888[/C][/ROW]
[ROW][C]3792.31982323137[/C][/ROW]
[ROW][C]-3455.01057714190[/C][/ROW]
[ROW][C]922.252358135583[/C][/ROW]
[ROW][C]-1465.69642083271[/C][/ROW]
[ROW][C]1815.46030370953[/C][/ROW]
[ROW][C]-2017.77690746499[/C][/ROW]
[ROW][C]-869.475043292874[/C][/ROW]
[ROW][C]2633.89158638264[/C][/ROW]
[ROW][C]-665.304587408435[/C][/ROW]
[ROW][C]-2370.17777372114[/C][/ROW]
[ROW][C]-2715.10906432759[/C][/ROW]
[ROW][C]169.824011233324[/C][/ROW]
[ROW][C]-1355.78204489664[/C][/ROW]
[ROW][C]533.542936046002[/C][/ROW]
[ROW][C]-319.157604564192[/C][/ROW]
[ROW][C]3987.11895062398[/C][/ROW]
[ROW][C]1739.12598407361[/C][/ROW]
[ROW][C]-1689.18541662456[/C][/ROW]
[ROW][C]-543.947891123456[/C][/ROW]
[ROW][C]-1462.51853820954[/C][/ROW]
[ROW][C]884.841526030664[/C][/ROW]
[ROW][C]-2134.23068235969[/C][/ROW]
[ROW][C]-3450.92188789189[/C][/ROW]
[ROW][C]-198.224283564799[/C][/ROW]
[ROW][C]-1539.93549586108[/C][/ROW]
[ROW][C]-1190.46559340156[/C][/ROW]
[ROW][C]1132.03582290952[/C][/ROW]
[ROW][C]619.631251788837[/C][/ROW]
[ROW][C]-219.607440237834[/C][/ROW]
[ROW][C]-719.22141611945[/C][/ROW]
[ROW][C]-2050.41755313472[/C][/ROW]
[ROW][C]818.245087541027[/C][/ROW]
[ROW][C]-1338.42064825063[/C][/ROW]
[ROW][C]-2101.91670162007[/C][/ROW]
[ROW][C]-1173.39925248942[/C][/ROW]
[ROW][C]2298.76094769557[/C][/ROW]
[ROW][C]-253.353038693245[/C][/ROW]
[ROW][C]-616.197195029518[/C][/ROW]
[ROW][C]385.619986138646[/C][/ROW]
[ROW][C]1867.38067337042[/C][/ROW]
[ROW][C]180.824149010268[/C][/ROW]
[ROW][C]-95.0370398256055[/C][/ROW]
[ROW][C]-1763.04145138124[/C][/ROW]
[ROW][C]1113.67614797106[/C][/ROW]
[ROW][C]1369.37844318859[/C][/ROW]
[ROW][C]-794.875836511573[/C][/ROW]
[ROW][C]-563.278738703531[/C][/ROW]
[ROW][C]-716.153011928976[/C][/ROW]
[ROW][C]-1808.73694189458[/C][/ROW]
[ROW][C]-1214.25216076101[/C][/ROW]
[ROW][C]542.99316144218[/C][/ROW]
[ROW][C]-164.890495653356[/C][/ROW]
[ROW][C]597.944337601865[/C][/ROW]
[ROW][C]-312.922621446362[/C][/ROW]
[ROW][C]1404.00908678077[/C][/ROW]
[ROW][C]354.697910094941[/C][/ROW]
[ROW][C]2214.01722511453[/C][/ROW]
[ROW][C]1220.43706940638[/C][/ROW]
[ROW][C]209.085010474083[/C][/ROW]
[ROW][C]344.826728950765[/C][/ROW]
[ROW][C]-1902.62240021539[/C][/ROW]
[ROW][C]-577.893269151195[/C][/ROW]
[ROW][C]955.100165337919[/C][/ROW]
[ROW][C]-434.344544370957[/C][/ROW]
[ROW][C]257.988741739936[/C][/ROW]
[ROW][C]232.873048615491[/C][/ROW]
[ROW][C]2673.78605530612[/C][/ROW]
[ROW][C]340.654917047013[/C][/ROW]
[ROW][C]754.108948123252[/C][/ROW]
[ROW][C]792.420534632403[/C][/ROW]
[ROW][C]184.740327032007[/C][/ROW]
[/TABLE]
Source: https://freestatistics.org/blog/index.php?pk=114991&T=2

Globally Unique Identifier (entire table): ba.freestatistics.org/blog/index.php?pk=114991&T=2

As an alternative you can also use a QR Code:  

The GUIDs for individual cells are displayed in the table below:

Estimated ARIMA Residuals
Value
-147.826066663623
2238.51297053823
2359.87483395732
-1449.98823408313
1861.04485769614
430.661862085229
3458.60124930771
646.058695199012
1739.66151058062
4006.68951553663
-1719.28392057718
-575.688088629192
-2128.27131604289
3419.71213819808
308.502215360756
-2119.13729050271
1016.25448028340
-2481.26751870816
-3871.08862568888
3792.31982323137
-3455.01057714190
922.252358135583
-1465.69642083271
1815.46030370953
-2017.77690746499
-869.475043292874
2633.89158638264
-665.304587408435
-2370.17777372114
-2715.10906432759
169.824011233324
-1355.78204489664
533.542936046002
-319.157604564192
3987.11895062398
1739.12598407361
-1689.18541662456
-543.947891123456
-1462.51853820954
884.841526030664
-2134.23068235969
-3450.92188789189
-198.224283564799
-1539.93549586108
-1190.46559340156
1132.03582290952
619.631251788837
-219.607440237834
-719.22141611945
-2050.41755313472
818.245087541027
-1338.42064825063
-2101.91670162007
-1173.39925248942
2298.76094769557
-253.353038693245
-616.197195029518
385.619986138646
1867.38067337042
180.824149010268
-95.0370398256055
-1763.04145138124
1113.67614797106
1369.37844318859
-794.875836511573
-563.278738703531
-716.153011928976
-1808.73694189458
-1214.25216076101
542.99316144218
-164.890495653356
597.944337601865
-312.922621446362
1404.00908678077
354.697910094941
2214.01722511453
1220.43706940638
209.085010474083
344.826728950765
-1902.62240021539
-577.893269151195
955.100165337919
-434.344544370957
257.988741739936
232.873048615491
2673.78605530612
340.654917047013
754.108948123252
792.420534632403
184.740327032007


Parameters (Session):
par1 = FALSE ; par2 = 1 ; par3 = 1 ; par4 = 1 ; par5 = 12 ; par6 = 3 ; par7 = 1 ; par8 = 2 ; par9 = 1 ;
Parameters (R input):
par1 = FALSE ; par2 = 1 ; par3 = 1 ; par4 = 1 ; par5 = 12 ; par6 = 3 ; par7 = 1 ; par8 = 2 ; par9 = 1 ;
R code (references can be found in the software module):
library(lattice)
if (par1 == 'TRUE') par1 <- TRUE
if (par1 == 'FALSE') par1 <- FALSE
par2 <- as.numeric(par2) #Box-Cox lambda transformation parameter
par3 <- as.numeric(par3) #degree of non-seasonal differencing
par4 <- as.numeric(par4) #degree of seasonal differencing
par5 <- as.numeric(par5) #seasonal period
par6 <- as.numeric(par6) #degree (p) of the non-seasonal AR(p) polynomial
par7 <- as.numeric(par7) #degree (q) of the non-seasonal MA(q) polynomial
par8 <- as.numeric(par8) #degree (P) of the seasonal AR(P) polynomial
par9 <- as.numeric(par9) #degree (Q) of the seasonal MA(Q) polynomial
armaGR <- function(arima.out, names, n){
try1 <- arima.out$coef
try2 <- sqrt(diag(arima.out$var.coef))
try.data.frame <- data.frame(matrix(NA,ncol=4,nrow=length(names)))
dimnames(try.data.frame) <- list(names,c('coef','std','tstat','pv'))
try.data.frame[,1] <- try1
for(i in 1:length(try2)) try.data.frame[which(rownames(try.data.frame)==names(try2)[i]),2] <- try2[i]
try.data.frame[,3] <- try.data.frame[,1] / try.data.frame[,2]
try.data.frame[,4] <- round((1-pt(abs(try.data.frame[,3]),df=n-(length(try2)+1)))*2,5)
vector <- rep(NA,length(names))
vector[is.na(try.data.frame[,4])] <- 0
maxi <- which.max(try.data.frame[,4])
continue <- max(try.data.frame[,4],na.rm=TRUE) > .05
vector[maxi] <- 0
list(summary=try.data.frame,next.vector=vector,continue=continue)
}
arimaSelect <- function(series, order=c(13,0,0), seasonal=list(order=c(2,0,0),period=12), include.mean=F){
nrc <- order[1]+order[3]+seasonal$order[1]+seasonal$order[3]
coeff <- matrix(NA, nrow=nrc*2, ncol=nrc)
pval <- matrix(NA, nrow=nrc*2, ncol=nrc)
mylist <- rep(list(NULL), nrc)
names <- NULL
if(order[1] > 0) names <- paste('ar',1:order[1],sep='')
if(order[3] > 0) names <- c( names , paste('ma',1:order[3],sep='') )
if(seasonal$order[1] > 0) names <- c(names, paste('sar',1:seasonal$order[1],sep=''))
if(seasonal$order[3] > 0) names <- c(names, paste('sma',1:seasonal$order[3],sep=''))
arima.out <- arima(series, order=order, seasonal=seasonal, include.mean=include.mean, method='ML')
mylist[[1]] <- arima.out
last.arma <- armaGR(arima.out, names, length(series))
mystop <- FALSE
i <- 1
coeff[i,] <- last.arma[[1]][,1]
pval [i,] <- last.arma[[1]][,4]
i <- 2
aic <- arima.out$aic
while(!mystop){
mylist[[i]] <- arima.out
arima.out <- arima(series, order=order, seasonal=seasonal, include.mean=include.mean, method='ML', fixed=last.arma$next.vector)
aic <- c(aic, arima.out$aic)
last.arma <- armaGR(arima.out, names, length(series))
mystop <- !last.arma$continue
coeff[i,] <- last.arma[[1]][,1]
pval [i,] <- last.arma[[1]][,4]
i <- i+1
}
list(coeff, pval, mylist, aic=aic)
}
arimaSelectplot <- function(arimaSelect.out,noms,choix){
noms <- names(arimaSelect.out[[3]][[1]]$coef)
coeff <- arimaSelect.out[[1]]
k <- min(which(is.na(coeff[,1])))-1
coeff <- coeff[1:k,]
pval <- arimaSelect.out[[2]][1:k,]
aic <- arimaSelect.out$aic[1:k]
coeff[coeff==0] <- NA
n <- ncol(coeff)
if(missing(choix)) choix <- k
layout(matrix(c(1,1,1,2,
3,3,3,2,
3,3,3,4,
5,6,7,7),nr=4),
widths=c(10,35,45,15),
heights=c(30,30,15,15))
couleurs <- rainbow(75)[1:50]#(50)
ticks <- pretty(coeff)
par(mar=c(1,1,3,1))
plot(aic,k:1-.5,type='o',pch=21,bg='blue',cex=2,axes=F,lty=2,xpd=NA)
points(aic[choix],k-choix+.5,pch=21,cex=4,bg=2,xpd=NA)
title('aic',line=2)
par(mar=c(3,0,0,0))
plot(0,axes=F,xlab='',ylab='',xlim=range(ticks),ylim=c(.1,1))
rect(xleft = min(ticks) + (0:49)/50*(max(ticks)-min(ticks)),
xright = min(ticks) + (1:50)/50*(max(ticks)-min(ticks)),
ytop = rep(1,50),
ybottom= rep(0,50),col=couleurs,border=NA)
axis(1,ticks)
rect(xleft=min(ticks),xright=max(ticks),ytop=1,ybottom=0)
text(mean(coeff,na.rm=T),.5,'coefficients',cex=2,font=2)
par(mar=c(1,1,3,1))
image(1:n,1:k,t(coeff[k:1,]),axes=F,col=couleurs,zlim=range(ticks))
for(i in 1:n) for(j in 1:k) if(!is.na(coeff[j,i])) {
if(pval[j,i]<.01) symb = 'green'
else if( (pval[j,i]<.05) & (pval[j,i]>=.01)) symb = 'orange'
else if( (pval[j,i]<.1) & (pval[j,i]>=.05)) symb = 'red'
else symb = 'black'
polygon(c(i+.5 ,i+.2 ,i+.5 ,i+.5),
c(k-j+0.5,k-j+0.5,k-j+0.8,k-j+0.5),
col=symb)
if(j==choix) {
rect(xleft=i-.5,
xright=i+.5,
ybottom=k-j+1.5,
ytop=k-j+.5,
lwd=4)
text(i,
k-j+1,
round(coeff[j,i],2),
cex=1.2,
font=2)
}
else{
rect(xleft=i-.5,xright=i+.5,ybottom=k-j+1.5,ytop=k-j+.5)
text(i,k-j+1,round(coeff[j,i],2),cex=1.2,font=1)
}
}
axis(3,1:n,noms)
par(mar=c(0.5,0,0,0.5))
plot(0,axes=F,xlab='',ylab='',type='n',xlim=c(0,8),ylim=c(-.2,.8))
cols <- c('green','orange','red','black')
niv <- c('0','0.01','0.05','0.1')
for(i in 0:3){
polygon(c(1+2*i ,1+2*i ,1+2*i-.5 ,1+2*i),
c(.4 ,.7 , .4 , .4),
col=cols[i+1])
text(2*i,0.5,niv[i+1],cex=1.5)
}
text(8,.5,1,cex=1.5)
text(4,0,'p-value',cex=2)
box()
residus <- arimaSelect.out[[3]][[choix]]$res
par(mar=c(1,2,4,1))
acf(residus,main='')
title('acf',line=.5)
par(mar=c(1,2,4,1))
pacf(residus,main='')
title('pacf',line=.5)
par(mar=c(2,2,4,1))
qqnorm(residus,main='')
title('qq-norm',line=.5)
qqline(residus)
residus
}
if (par2 == 0) x <- log(x)
if (par2 != 0) x <- x^par2
(selection <- arimaSelect(x, order=c(par6,par3,par7), seasonal=list(order=c(par8,par4,par9), period=par5)))
bitmap(file='test1.png')
resid <- arimaSelectplot(selection)
dev.off()
resid
bitmap(file='test2.png')
acf(resid,length(resid)/2, main='Residual Autocorrelation Function')
dev.off()
bitmap(file='test3.png')
pacf(resid,length(resid)/2, main='Residual Partial Autocorrelation Function')
dev.off()
bitmap(file='test4.png')
cpgram(resid, main='Residual Cumulative Periodogram')
dev.off()
bitmap(file='test5.png')
hist(resid, main='Residual Histogram', xlab='values of Residuals')
dev.off()
bitmap(file='test6.png')
densityplot(~resid,col='black',main='Residual Density Plot', xlab='values of Residuals')
dev.off()
bitmap(file='test7.png')
qqnorm(resid, main='Residual Normal Q-Q Plot')
qqline(resid)
dev.off()
ncols <- length(selection[[1]][1,])
nrows <- length(selection[[2]][,1])-1
load(file='createtable')
a<-table.start()
a<-table.row.start(a)
a<-table.element(a,'ARIMA Parameter Estimation and Backward Selection', ncols+1,TRUE)
a<-table.row.end(a)
a<-table.row.start(a)
a<-table.element(a,'Iteration', header=TRUE)
for (i in 1:ncols) {
a<-table.element(a,names(selection[[3]][[1]]$coef)[i],header=TRUE)
}
a<-table.row.end(a)
for (j in 1:nrows) {
a<-table.row.start(a)
mydum <- 'Estimates ('
mydum <- paste(mydum,j)
mydum <- paste(mydum,')')
a<-table.element(a,mydum, header=TRUE)
for (i in 1:ncols) {
a<-table.element(a,round(selection[[1]][j,i],4))
}
a<-table.row.end(a)
a<-table.row.start(a)
a<-table.element(a,'(p-val)', header=TRUE)
for (i in 1:ncols) {
mydum <- '('
mydum <- paste(mydum,round(selection[[2]][j,i],4),sep='')
mydum <- paste(mydum,')')
a<-table.element(a,mydum)
}
a<-table.row.end(a)
}
a<-table.end(a)
table.save(a,file='mytable.tab')
a<-table.start()
a<-table.row.start(a)
a<-table.element(a,'Estimated ARIMA Residuals', 1,TRUE)
a<-table.row.end(a)
a<-table.row.start(a)
a<-table.element(a,'Value', 1,TRUE)
a<-table.row.end(a)
for (i in (par4*par5+par3):length(resid)) {
a<-table.row.start(a)
a<-table.element(a,resid[i])
a<-table.row.end(a)
}
a<-table.end(a)
table.save(a,file='mytable1.tab')