| Multiple Linear Regression - Estimated Regression Equation |
| y[t] = + 22.6729257443683 + 0.0174685988429137y1[t] + 0.131437577783892y2[t] + 0.300291730285133y3[t] -0.0319892632868462y4[t] + 0.00451269410751495uitvoer[t] + 0.00879190661155511ondernemersvertrouwen[t] -0.00216823737255318invoer[t] -3.25700323627328M1[t] + 0.633033557802868M2[t] -19.234836827881M3[t] -1.94318071962852M4[t] + 2.79138694440754M5[t] + 10.1653722367121M6[t] + 0.0331127764477652M7[t] -7.23163967356985M8[t] -6.33995057650054M9[t] -3.28869162373367M10[t] + 5.43507600211532M11[t] + e[t] |
| Multiple Linear Regression - Ordinary Least Squares | |||||
| Variable | Parameter | S.D. | T-STAT H0: parameter = 0 | 2-tail p-value | 1-tail p-value |
| (Intercept) | 22.6729257443683 | 10.888402 | 2.0823 | 0.04303 | 0.021515 |
| y1 | 0.0174685988429137 | 0.116318 | 0.1502 | 0.881294 | 0.440647 |
| y2 | 0.131437577783892 | 0.093905 | 1.3997 | 0.168462 | 0.084231 |
| y3 | 0.300291730285133 | 0.092809 | 3.2356 | 0.002279 | 0.001139 |
| y4 | -0.0319892632868462 | 0.104465 | -0.3062 | 0.760849 | 0.380425 |
| uitvoer | 0.00451269410751495 | 0.001168 | 3.864 | 0.000355 | 0.000178 |
| ondernemersvertrouwen | 0.00879190661155511 | 0.069271 | 0.1269 | 0.899569 | 0.449784 |
| invoer | -0.00216823737255318 | 0.000911 | -2.3797 | 0.021629 | 0.010814 |
| M1 | -3.25700323627328 | 2.151944 | -1.5135 | 0.137141 | 0.06857 |
| M2 | 0.633033557802868 | 2.428659 | 0.2607 | 0.79555 | 0.397775 |
| M3 | -19.234836827881 | 2.184607 | -8.8047 | 0 | 0 |
| M4 | -1.94318071962852 | 4.195265 | -0.4632 | 0.645465 | 0.322732 |
| M5 | 2.79138694440754 | 3.584662 | 0.7787 | 0.44023 | 0.220115 |
| M6 | 10.1653722367121 | 2.918588 | 3.483 | 0.001116 | 0.000558 |
| M7 | 0.0331127764477652 | 2.594757 | 0.0128 | 0.989875 | 0.494937 |
| M8 | -7.23163967356985 | 2.897468 | -2.4958 | 0.016298 | 0.008149 |
| M9 | -6.33995057650054 | 3.823156 | -1.6583 | 0.104212 | 0.052106 |
| M10 | -3.28869162373367 | 3.52406 | -0.9332 | 0.355692 | 0.177846 |
| M11 | 5.43507600211532 | 2.718687 | 1.9992 | 0.051652 | 0.025826 |
| Multiple Linear Regression - Regression Statistics | |
| Multiple R | 0.971939318067388 |
| R-squared | 0.9446660380053 |
| Adjusted R-squared | 0.92253245320742 |
| F-TEST (value) | 42.6802095833921 |
| F-TEST (DF numerator) | 18 |
| F-TEST (DF denominator) | 45 |
| p-value | 0 |
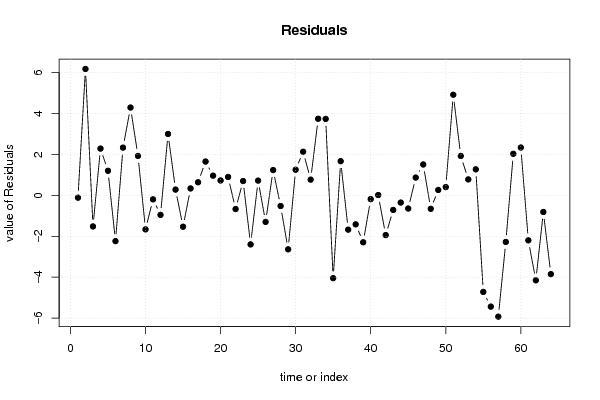
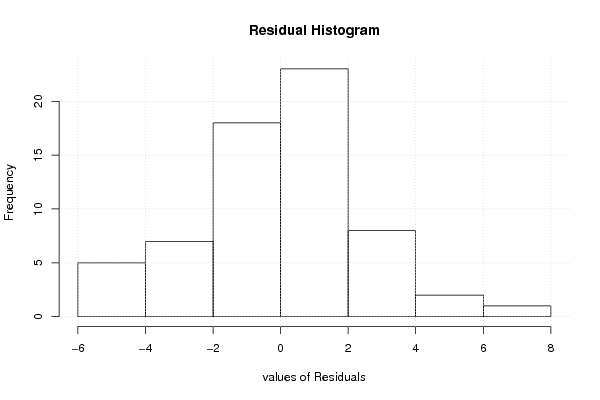
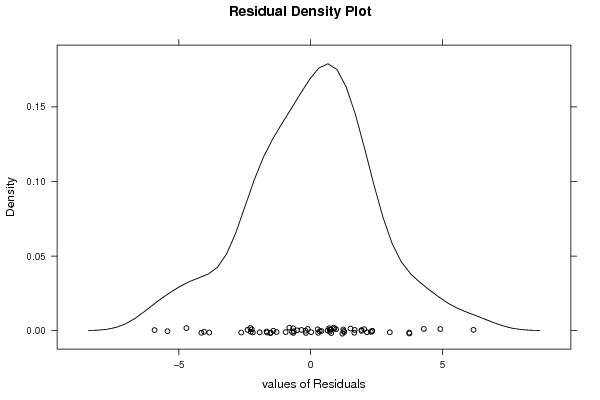
| Multiple Linear Regression - Residual Statistics | |
| Residual Standard Deviation | 2.82736393509048 |
| Sum Squared Residuals | 359.729406965265 |
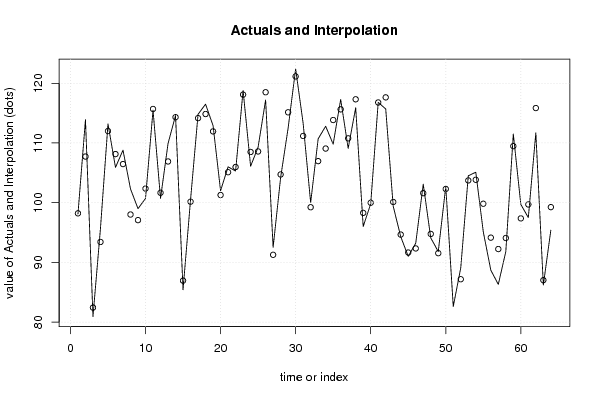
| Multiple Linear Regression - Actuals, Interpolation, and Residuals | |||
| Time or Index | Actuals | Interpolation Forecast | Residuals Prediction Error |
| 1 | 98.1 | 98.2126858457704 | -0.11268584577039 |
| 2 | 113.9 | 107.723404054436 | 6.17659594556361 |
| 3 | 80.9 | 82.4187825217305 | -1.51878252173045 |
| 4 | 95.7 | 93.4145238194512 | 2.28547618054877 |
| 5 | 113.2 | 111.998912483449 | 1.20108751655118 |
| 6 | 105.9 | 108.136266679403 | -2.23626667940299 |
| 7 | 108.8 | 106.467453676597 | 2.33254632340276 |
| 8 | 102.3 | 98.0086745310502 | 4.29132546894982 |
| 9 | 99 | 97.0737519255512 | 1.92624807444879 |
| 10 | 100.7 | 102.361043037936 | -1.66104303793599 |
| 11 | 115.5 | 115.695653758072 | -0.19565375807171 |
| 12 | 100.7 | 101.653218436107 | -0.953218436106535 |
| 13 | 109.9 | 106.900213191253 | 2.99978680874656 |
| 14 | 114.6 | 114.317785615123 | 0.282214384877284 |
| 15 | 85.4 | 86.9312178978523 | -1.53121789785226 |
| 16 | 100.5 | 100.162147264872 | 0.337852735128445 |
| 17 | 114.8 | 114.159978611363 | 0.640021388636504 |
| 18 | 116.5 | 114.848282707168 | 1.65171729283243 |
| 19 | 112.9 | 111.936526601124 | 0.963473398875858 |
| 20 | 102 | 101.273789666642 | 0.726210333358164 |
| 21 | 106 | 105.100946066386 | 0.89905393361392 |
| 22 | 105.3 | 105.967992678265 | -0.667992678264846 |
| 23 | 118.8 | 118.098726514335 | 0.70127348566528 |
| 24 | 106.1 | 108.496166729084 | -2.39616672908354 |
| 25 | 109.3 | 108.57889835095 | 0.721101649049747 |
| 26 | 117.2 | 118.496871933851 | -1.29687193385051 |
| 27 | 92.5 | 91.264706675504 | 1.23529332449606 |
| 28 | 104.2 | 104.719301259494 | -0.519301259494098 |
| 29 | 112.5 | 115.13701492345 | -2.63701492345026 |
| 30 | 122.4 | 121.146187942434 | 1.2538120575657 |
| 31 | 113.3 | 111.168196872299 | 2.13180312770121 |
| 32 | 100 | 99.2306439637765 | 0.769356036223451 |
| 33 | 110.7 | 106.956991636316 | 3.74300836368439 |
| 34 | 112.8 | 109.065162422447 | 3.7348375775528 |
| 35 | 109.8 | 113.845530816836 | -4.045530816836 |
| 36 | 117.3 | 115.630294788806 | 1.66970521119373 |
| 37 | 109.1 | 110.775007217749 | -1.6750072177491 |
| 38 | 115.9 | 117.316091535858 | -1.41609153585804 |
| 39 | 96 | 98.2915522879947 | -2.29155228799473 |
| 40 | 99.8 | 99.9826234123155 | -0.182623412315491 |
| 41 | 116.8 | 116.78335635834 | 0.0166436416596489 |
| 42 | 115.7 | 117.640292328459 | -1.94029232845949 |
| 43 | 99.4 | 100.110975002563 | -0.71097500256337 |
| 44 | 94.3 | 94.6518241568002 | -0.351824156800161 |
| 45 | 91 | 91.6426872839394 | -0.642687283939394 |
| 46 | 93.2 | 92.3292790927532 | 0.870720907246779 |
| 47 | 103.1 | 101.591124995163 | 1.50887500483729 |
| 48 | 94.1 | 94.757231725179 | -0.657231725179031 |
| 49 | 91.8 | 91.5351055879438 | 0.264894412056175 |
| 50 | 102.7 | 102.295739476698 | 0.404260523302348 |
| 51 | 82.6 | 77.682234761797 | 4.91776523820299 |
| 52 | 89.1 | 87.1720980303419 | 1.92790196965811 |
| 53 | 104.5 | 103.720737623397 | 0.779262376602925 |
| 54 | 105.1 | 103.828970342536 | 1.27102965746434 |
| 55 | 95.1 | 99.8168478474165 | -4.71684784741646 |
| 56 | 88.7 | 94.1350676817313 | -5.43506768173127 |
| 57 | 86.3 | 92.2256230878077 | -5.92562308780771 |
| 58 | 91.8 | 94.0765227685987 | -2.27652276859874 |
| 59 | 111.5 | 109.468963915595 | 2.03103608440514 |
| 60 | 99.7 | 97.3630883208246 | 2.33691167917537 |
| 61 | 97.5 | 99.698089806333 | -2.19808980633299 |
| 62 | 111.7 | 115.850107384035 | -4.15010738403469 |
| 63 | 86.2 | 87.0115058551216 | -0.811505855121604 |
| 64 | 95.4 | 99.2493062135257 | -3.84930621352573 |
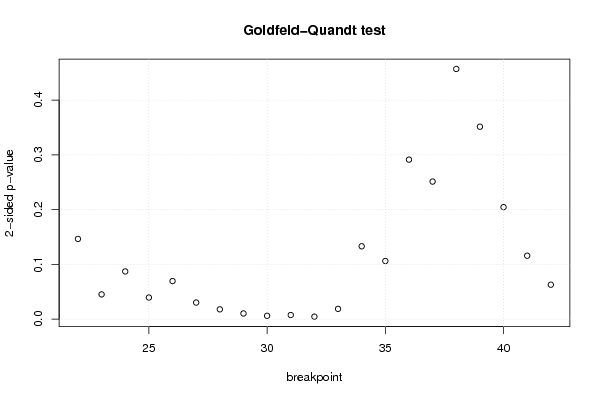
| Goldfeld-Quandt test for Heteroskedasticity | |||
| p-values | Alternative Hypothesis | ||
| breakpoint index | greater | 2-sided | less |
| 22 | 0.073211397064447 | 0.146422794128894 | 0.926788602935553 |
| 23 | 0.0225565926229421 | 0.0451131852458841 | 0.977443407377058 |
| 24 | 0.0435311834372226 | 0.0870623668744451 | 0.956468816562777 |
| 25 | 0.0196832308989213 | 0.0393664617978426 | 0.980316769101079 |
| 26 | 0.0347149777819045 | 0.069429955563809 | 0.965285022218096 |
| 27 | 0.0150868967437901 | 0.0301737934875801 | 0.98491310325621 |
| 28 | 0.00891700690103692 | 0.0178340138020738 | 0.991082993098963 |
| 29 | 0.00513539169437615 | 0.0102707833887523 | 0.994864608305624 |
| 30 | 0.00299041675305313 | 0.00598083350610626 | 0.997009583246947 |
| 31 | 0.00370764570975998 | 0.00741529141951997 | 0.99629235429024 |
| 32 | 0.0022165395733576 | 0.00443307914671519 | 0.997783460426642 |
| 33 | 0.00931990615726703 | 0.0186398123145341 | 0.990680093842733 |
| 34 | 0.0664838237187395 | 0.132967647437479 | 0.93351617628126 |
| 35 | 0.0530418636280755 | 0.106083727256151 | 0.946958136371924 |
| 36 | 0.145631554223126 | 0.291263108446252 | 0.854368445776874 |
| 37 | 0.125610751824047 | 0.251221503648093 | 0.874389248175953 |
| 38 | 0.228472458789349 | 0.456944917578699 | 0.77152754121065 |
| 39 | 0.175710305474609 | 0.351420610949219 | 0.82428969452539 |
| 40 | 0.102237990201056 | 0.204475980402113 | 0.897762009798944 |
| 41 | 0.0578656788068161 | 0.115731357613632 | 0.942134321193184 |
| 42 | 0.031411001128021 | 0.062822002256042 | 0.968588998871979 |
| Meta Analysis of Goldfeld-Quandt test for Heteroskedasticity | |||
| Description | # significant tests | % significant tests | OK/NOK |
| 1% type I error level | 3 | 0.142857142857143 | NOK |
| 5% type I error level | 9 | 0.428571428571429 | NOK |
| 10% type I error level | 12 | 0.571428571428571 | NOK |