Free Statistics

of Irreproducible Research!

Author's title

Author*The author of this computation has been verified*
R Software Modulerwasp_multipleregression.wasp
Title produced by softwareMultiple Regression
Date of computationFri, 24 Dec 2010 13:37:13 +0000
Cite this page as followsStatistical Computations at FreeStatistics.org, Office for Research Development and Education, URL https://freestatistics.org/blog/index.php?v=date/2010/Dec/24/t12931978014vy2mnfow0z1ld0.htm/, Retrieved Tue, 30 Apr 2024 02:02:40 +0000
Statistical Computations at FreeStatistics.org, Office for Research Development and Education, URL https://freestatistics.org/blog/index.php?pk=114942, Retrieved Tue, 30 Apr 2024 02:02:40 +0000
QR Codes:

Original text written by user:
IsPrivate?No (this computation is public)
User-defined keywords
Estimated Impact129
Family? (F = Feedback message, R = changed R code, M = changed R Module, P = changed Parameters, D = changed Data)
-     [Multiple Regression] [Q1 The Seatbeltlaw] [2007-11-14 19:27:43] [8cd6641b921d30ebe00b648d1481bba0]
- RM D  [Multiple Regression] [Seatbelt] [2009-11-12 14:10:54] [b98453cac15ba1066b407e146608df68]
-    D    [Multiple Regression] [ws 8 auitoregressie] [2010-11-29 18:31:52] [bd591a1ebb67d263a02e7adae3fa1a4d]
-   PD        [Multiple Regression] [autoregressie] [2010-12-24 13:37:13] [09489ba95453d3f5c9e6f2eaeda915af] [Current]
Feedback Forum

Post a new message
Dataseries X:
98,1	102,8	104,7	95,9	94,6	15607,4	-7,5	15172,6
113,9	98,1	102,8	104,7	95,9	17160,9	-7,8	16858,9
80,9	113,9	98,1	102,8	104,7	14915,8	-7,7	14143,5
95,7	80,9	113,9	98,1	102,8	13768	-6,6	14731,8
113,2	95,7	80,9	113,9	98,1	17487,5	-4,2	16471,6
105,9	113,2	95,7	80,9	113,9	16198,1	-2,0	15214
108,8	105,9	113,2	95,7	80,9	17535,2	-0,7	17637,4
102,3	108,8	105,9	113,2	95,7	16571,8	0,1	17972,4
99	102,3	108,8	105,9	113,2	16198,9	0,9	16896,2
100,7	99	102,3	108,8	105,9	16554,2	2,1	16698
115,5	100,7	99	102,3	108,8	19554,2	3,5	19691,6
100,7	115,5	100,7	99	102,3	15903,8	4,9	15930,7
109,9	100,7	115,5	100,7	99	18003,8	5,7	17444,6
114,6	109,9	100,7	115,5	100,7	18329,6	6,2	17699,4
85,4	114,6	109,9	100,7	115,5	16260,7	6,5	15189,8
100,5	85,4	114,6	109,9	100,7	14851,9	6,5	15672,7
114,8	100,5	85,4	114,6	109,9	18174,1	6,3	17180,8
116,5	114,8	100,5	85,4	114,6	18406,6	6,2	17664,9
112,9	116,5	114,8	100,5	85,4	18466,5	6,4	17862,9
102	112,9	116,5	114,8	100,5	16016,5	6,3	16162,3
106	102	112,9	116,5	114,8	17428,5	5,8	17463,6
105,3	106	102	112,9	116,5	17167,2	5,1	16772,1
118,8	105,3	106	102	112,9	19630	5,1	19106,9
106,1	118,8	105,3	106	102	17183,6	5,8	16721,3
109,3	106,1	118,8	105,3	106	18344,7	6,7	18161,3
117,2	109,3	106,1	118,8	105,3	19301,4	7,1	18509,9
92,5	117,2	109,3	106,1	118,8	18147,5	6,7	17802,7
104,2	92,5	117,2	109,3	106,1	16192,9	5,5	16409,9
112,5	104,2	92,5	117,2	109,3	18374,4	4,2	17967,7
122,4	112,5	104,2	92,5	117,2	20515,2	3,0	20286,6
113,3	122,4	112,5	104,2	92,5	18957,2	2,2	19537,3
100	113,3	122,4	112,5	104,2	16471,5	2,0	18021,9
110,7	100	113,3	122,4	112,5	18746,8	1,8	20194,3
112,8	110,7	100	113,3	122,4	19009,5	1,8	19049,6
109,8	112,8	110,7	100	113,3	19211,2	1,5	20244,7
117,3	109,8	112,8	110,7	100	20547,7	0,4	21473,3
109,1	117,3	109,8	112,8	110,7	19325,8	-0,9	19673,6
115,9	109,1	117,3	109,8	112,8	20605,5	-1,7	21053,2
96	115,9	109,1	117,3	109,8	20056,9	-2,6	20159,5
99,8	96	115,9	109,1	117,3	16141,4	-4,4	18203,6
116,8	99,8	96	115,9	109,1	20359,8	-8,3	21289,5
115,7	116,8	99,8	96	115,9	19711,6	-14,4	20432,3
99,4	115,7	116,8	99,8	96	15638,6	-21,3	17180,4
94,3	99,4	115,7	116,8	99,8	14384,5	-26,5	15816,8
91	94,3	99,4	115,7	116,8	13855,6	-29,2	15071,8
93,2	91	94,3	99,4	115,7	14308,3	-30,8	14521,1
103,1	93,2	91	94,3	99,4	15290,6	-30,9	15668,8
94,1	103,1	93,2	91	94,3	14423,8	-29,5	14346,9
91,8	94,1	103,1	93,2	91	13779,7	-27,1	13881
102,7	91,8	94,1	103,1	93,2	15686,3	-24,4	15465,9
82,6	102,7	91,8	94,1	103,1	14733,8	-21,9	14238,2
89,1	82,6	102,7	91,8	94,1	12522,5	-19,3	13557,7
104,5	89,1	82,6	102,7	91,8	16189,4	-17,0	16127,6
105,1	104,5	89,1	82,6	102,7	16059,1	-13,8	16793,9
95,1	105,1	104,5	89,1	82,6	16007,1	-9,9	16014
88,7	95,1	105,1	104,5	89,1	15806,8	-7,9	16867,9
86,3	88,7	95,1	105,1	104,5	15160	-7,2	16014,6
91,8	86,3	88,7	95,1	105,1	15692,1	-6,2	15878,6
111,5	91,8	86,3	88,7	95,1	18908,9	-4,5	18664,9
99,7	111,5	91,8	86,3	88,7	16969,9	-3,9	17962,5
97,5	99,7	111,5	91,8	86,3	16997,5	-5,0	17332,7
111,7	97,5	99,7	111,5	91,8	19858,9	-6,2	19542,1
86,2	111,7	97,5	99,7	111,5	17681,2	-6,1	17203,6
95,4	86,2	111,7	97,5	99,7	16006,9	-5,0	16579


Summary of computational transaction
Raw Inputview raw input (R code)
Raw Outputview raw output of R engine
Computing time5 seconds
R Server'RServer@AstonUniversity' @ vre.aston.ac.uk

\begin{tabular}{lllllllll}
\hline
Summary of computational transaction \tabularnewline
Raw Input & view raw input (R code)  \tabularnewline
Raw Output & view raw output of R engine  \tabularnewline
Computing time & 5 seconds \tabularnewline
R Server & 'RServer@AstonUniversity' @ vre.aston.ac.uk \tabularnewline
\hline
\end{tabular}
%Source: https://freestatistics.org/blog/index.php?pk=114942&T=0

[TABLE]
[ROW][C]Summary of computational transaction[/C][/ROW]
[ROW][C]Raw Input[/C][C]view raw input (R code) [/C][/ROW]
[ROW][C]Raw Output[/C][C]view raw output of R engine [/C][/ROW]
[ROW][C]Computing time[/C][C]5 seconds[/C][/ROW]
[ROW][C]R Server[/C][C]'RServer@AstonUniversity' @ vre.aston.ac.uk[/C][/ROW]
[/TABLE]
Source: https://freestatistics.org/blog/index.php?pk=114942&T=0

Globally Unique Identifier (entire table): ba.freestatistics.org/blog/index.php?pk=114942&T=0

As an alternative you can also use a QR Code:  

The GUIDs for individual cells are displayed in the table below:

Summary of computational transaction
Raw Inputview raw input (R code)
Raw Outputview raw output of R engine
Computing time5 seconds
R Server'RServer@AstonUniversity' @ vre.aston.ac.uk


Multiple Linear Regression - Estimated Regression Equation
y[t] = + 22.6729257443683 + 0.0174685988429137y1[t] + 0.131437577783892y2[t] + 0.300291730285133y3[t] -0.0319892632868462y4[t] + 0.00451269410751495uitvoer[t] + 0.00879190661155511ondernemersvertrouwen[t] -0.00216823737255318invoer[t] -3.25700323627328M1[t] + 0.633033557802868M2[t] -19.234836827881M3[t] -1.94318071962852M4[t] + 2.79138694440754M5[t] + 10.1653722367121M6[t] + 0.0331127764477652M7[t] -7.23163967356985M8[t] -6.33995057650054M9[t] -3.28869162373367M10[t] + 5.43507600211532M11[t] + e[t]

\begin{tabular}{lllllllll}
\hline
Multiple Linear Regression - Estimated Regression Equation \tabularnewline
y[t] =  +  22.6729257443683 +  0.0174685988429137y1[t] +  0.131437577783892y2[t] +  0.300291730285133y3[t] -0.0319892632868462y4[t] +  0.00451269410751495uitvoer[t] +  0.00879190661155511ondernemersvertrouwen[t] -0.00216823737255318invoer[t] -3.25700323627328M1[t] +  0.633033557802868M2[t] -19.234836827881M3[t] -1.94318071962852M4[t] +  2.79138694440754M5[t] +  10.1653722367121M6[t] +  0.0331127764477652M7[t] -7.23163967356985M8[t] -6.33995057650054M9[t] -3.28869162373367M10[t] +  5.43507600211532M11[t]  + e[t] \tabularnewline
\hline
\end{tabular}
%Source: https://freestatistics.org/blog/index.php?pk=114942&T=1

[TABLE]
[ROW][C]Multiple Linear Regression - Estimated Regression Equation[/C][/ROW]
[ROW][C]y[t] =  +  22.6729257443683 +  0.0174685988429137y1[t] +  0.131437577783892y2[t] +  0.300291730285133y3[t] -0.0319892632868462y4[t] +  0.00451269410751495uitvoer[t] +  0.00879190661155511ondernemersvertrouwen[t] -0.00216823737255318invoer[t] -3.25700323627328M1[t] +  0.633033557802868M2[t] -19.234836827881M3[t] -1.94318071962852M4[t] +  2.79138694440754M5[t] +  10.1653722367121M6[t] +  0.0331127764477652M7[t] -7.23163967356985M8[t] -6.33995057650054M9[t] -3.28869162373367M10[t] +  5.43507600211532M11[t]  + e[t][/C][/ROW]
[/TABLE]
Source: https://freestatistics.org/blog/index.php?pk=114942&T=1

Globally Unique Identifier (entire table): ba.freestatistics.org/blog/index.php?pk=114942&T=1

As an alternative you can also use a QR Code:  

The GUIDs for individual cells are displayed in the table below:

Multiple Linear Regression - Estimated Regression Equation
y[t] = + 22.6729257443683 + 0.0174685988429137y1[t] + 0.131437577783892y2[t] + 0.300291730285133y3[t] -0.0319892632868462y4[t] + 0.00451269410751495uitvoer[t] + 0.00879190661155511ondernemersvertrouwen[t] -0.00216823737255318invoer[t] -3.25700323627328M1[t] + 0.633033557802868M2[t] -19.234836827881M3[t] -1.94318071962852M4[t] + 2.79138694440754M5[t] + 10.1653722367121M6[t] + 0.0331127764477652M7[t] -7.23163967356985M8[t] -6.33995057650054M9[t] -3.28869162373367M10[t] + 5.43507600211532M11[t] + e[t]


Multiple Linear Regression - Ordinary Least Squares
VariableParameterS.D.T-STATH0: parameter = 02-tail p-value1-tail p-value
(Intercept)22.672925744368310.8884022.08230.043030.021515
y10.01746859884291370.1163180.15020.8812940.440647
y20.1314375777838920.0939051.39970.1684620.084231
y30.3002917302851330.0928093.23560.0022790.001139
y4-0.03198926328684620.104465-0.30620.7608490.380425
uitvoer0.004512694107514950.0011683.8640.0003550.000178
ondernemersvertrouwen0.008791906611555110.0692710.12690.8995690.449784
invoer-0.002168237372553180.000911-2.37970.0216290.010814
M1-3.257003236273282.151944-1.51350.1371410.06857
M20.6330335578028682.4286590.26070.795550.397775
M3-19.2348368278812.184607-8.804700
M4-1.943180719628524.195265-0.46320.6454650.322732
M52.791386944407543.5846620.77870.440230.220115
M610.16537223671212.9185883.4830.0011160.000558
M70.03311277644776522.5947570.01280.9898750.494937
M8-7.231639673569852.897468-2.49580.0162980.008149
M9-6.339950576500543.823156-1.65830.1042120.052106
M10-3.288691623733673.52406-0.93320.3556920.177846
M115.435076002115322.7186871.99920.0516520.025826

\begin{tabular}{lllllllll}
\hline
Multiple Linear Regression - Ordinary Least Squares \tabularnewline
Variable & Parameter & S.D. & T-STATH0: parameter = 0 & 2-tail p-value & 1-tail p-value \tabularnewline
(Intercept) & 22.6729257443683 & 10.888402 & 2.0823 & 0.04303 & 0.021515 \tabularnewline
y1 & 0.0174685988429137 & 0.116318 & 0.1502 & 0.881294 & 0.440647 \tabularnewline
y2 & 0.131437577783892 & 0.093905 & 1.3997 & 0.168462 & 0.084231 \tabularnewline
y3 & 0.300291730285133 & 0.092809 & 3.2356 & 0.002279 & 0.001139 \tabularnewline
y4 & -0.0319892632868462 & 0.104465 & -0.3062 & 0.760849 & 0.380425 \tabularnewline
uitvoer & 0.00451269410751495 & 0.001168 & 3.864 & 0.000355 & 0.000178 \tabularnewline
ondernemersvertrouwen & 0.00879190661155511 & 0.069271 & 0.1269 & 0.899569 & 0.449784 \tabularnewline
invoer & -0.00216823737255318 & 0.000911 & -2.3797 & 0.021629 & 0.010814 \tabularnewline
M1 & -3.25700323627328 & 2.151944 & -1.5135 & 0.137141 & 0.06857 \tabularnewline
M2 & 0.633033557802868 & 2.428659 & 0.2607 & 0.79555 & 0.397775 \tabularnewline
M3 & -19.234836827881 & 2.184607 & -8.8047 & 0 & 0 \tabularnewline
M4 & -1.94318071962852 & 4.195265 & -0.4632 & 0.645465 & 0.322732 \tabularnewline
M5 & 2.79138694440754 & 3.584662 & 0.7787 & 0.44023 & 0.220115 \tabularnewline
M6 & 10.1653722367121 & 2.918588 & 3.483 & 0.001116 & 0.000558 \tabularnewline
M7 & 0.0331127764477652 & 2.594757 & 0.0128 & 0.989875 & 0.494937 \tabularnewline
M8 & -7.23163967356985 & 2.897468 & -2.4958 & 0.016298 & 0.008149 \tabularnewline
M9 & -6.33995057650054 & 3.823156 & -1.6583 & 0.104212 & 0.052106 \tabularnewline
M10 & -3.28869162373367 & 3.52406 & -0.9332 & 0.355692 & 0.177846 \tabularnewline
M11 & 5.43507600211532 & 2.718687 & 1.9992 & 0.051652 & 0.025826 \tabularnewline
\hline
\end{tabular}
%Source: https://freestatistics.org/blog/index.php?pk=114942&T=2

[TABLE]
[ROW][C]Multiple Linear Regression - Ordinary Least Squares[/C][/ROW]
[ROW][C]Variable[/C][C]Parameter[/C][C]S.D.[/C][C]T-STATH0: parameter = 0[/C][C]2-tail p-value[/C][C]1-tail p-value[/C][/ROW]
[ROW][C](Intercept)[/C][C]22.6729257443683[/C][C]10.888402[/C][C]2.0823[/C][C]0.04303[/C][C]0.021515[/C][/ROW]
[ROW][C]y1[/C][C]0.0174685988429137[/C][C]0.116318[/C][C]0.1502[/C][C]0.881294[/C][C]0.440647[/C][/ROW]
[ROW][C]y2[/C][C]0.131437577783892[/C][C]0.093905[/C][C]1.3997[/C][C]0.168462[/C][C]0.084231[/C][/ROW]
[ROW][C]y3[/C][C]0.300291730285133[/C][C]0.092809[/C][C]3.2356[/C][C]0.002279[/C][C]0.001139[/C][/ROW]
[ROW][C]y4[/C][C]-0.0319892632868462[/C][C]0.104465[/C][C]-0.3062[/C][C]0.760849[/C][C]0.380425[/C][/ROW]
[ROW][C]uitvoer[/C][C]0.00451269410751495[/C][C]0.001168[/C][C]3.864[/C][C]0.000355[/C][C]0.000178[/C][/ROW]
[ROW][C]ondernemersvertrouwen[/C][C]0.00879190661155511[/C][C]0.069271[/C][C]0.1269[/C][C]0.899569[/C][C]0.449784[/C][/ROW]
[ROW][C]invoer[/C][C]-0.00216823737255318[/C][C]0.000911[/C][C]-2.3797[/C][C]0.021629[/C][C]0.010814[/C][/ROW]
[ROW][C]M1[/C][C]-3.25700323627328[/C][C]2.151944[/C][C]-1.5135[/C][C]0.137141[/C][C]0.06857[/C][/ROW]
[ROW][C]M2[/C][C]0.633033557802868[/C][C]2.428659[/C][C]0.2607[/C][C]0.79555[/C][C]0.397775[/C][/ROW]
[ROW][C]M3[/C][C]-19.234836827881[/C][C]2.184607[/C][C]-8.8047[/C][C]0[/C][C]0[/C][/ROW]
[ROW][C]M4[/C][C]-1.94318071962852[/C][C]4.195265[/C][C]-0.4632[/C][C]0.645465[/C][C]0.322732[/C][/ROW]
[ROW][C]M5[/C][C]2.79138694440754[/C][C]3.584662[/C][C]0.7787[/C][C]0.44023[/C][C]0.220115[/C][/ROW]
[ROW][C]M6[/C][C]10.1653722367121[/C][C]2.918588[/C][C]3.483[/C][C]0.001116[/C][C]0.000558[/C][/ROW]
[ROW][C]M7[/C][C]0.0331127764477652[/C][C]2.594757[/C][C]0.0128[/C][C]0.989875[/C][C]0.494937[/C][/ROW]
[ROW][C]M8[/C][C]-7.23163967356985[/C][C]2.897468[/C][C]-2.4958[/C][C]0.016298[/C][C]0.008149[/C][/ROW]
[ROW][C]M9[/C][C]-6.33995057650054[/C][C]3.823156[/C][C]-1.6583[/C][C]0.104212[/C][C]0.052106[/C][/ROW]
[ROW][C]M10[/C][C]-3.28869162373367[/C][C]3.52406[/C][C]-0.9332[/C][C]0.355692[/C][C]0.177846[/C][/ROW]
[ROW][C]M11[/C][C]5.43507600211532[/C][C]2.718687[/C][C]1.9992[/C][C]0.051652[/C][C]0.025826[/C][/ROW]
[/TABLE]
Source: https://freestatistics.org/blog/index.php?pk=114942&T=2

Globally Unique Identifier (entire table): ba.freestatistics.org/blog/index.php?pk=114942&T=2

As an alternative you can also use a QR Code:  

The GUIDs for individual cells are displayed in the table below:

Multiple Linear Regression - Ordinary Least Squares
VariableParameterS.D.T-STATH0: parameter = 02-tail p-value1-tail p-value
(Intercept)22.672925744368310.8884022.08230.043030.021515
y10.01746859884291370.1163180.15020.8812940.440647
y20.1314375777838920.0939051.39970.1684620.084231
y30.3002917302851330.0928093.23560.0022790.001139
y4-0.03198926328684620.104465-0.30620.7608490.380425
uitvoer0.004512694107514950.0011683.8640.0003550.000178
ondernemersvertrouwen0.008791906611555110.0692710.12690.8995690.449784
invoer-0.002168237372553180.000911-2.37970.0216290.010814
M1-3.257003236273282.151944-1.51350.1371410.06857
M20.6330335578028682.4286590.26070.795550.397775
M3-19.2348368278812.184607-8.804700
M4-1.943180719628524.195265-0.46320.6454650.322732
M52.791386944407543.5846620.77870.440230.220115
M610.16537223671212.9185883.4830.0011160.000558
M70.03311277644776522.5947570.01280.9898750.494937
M8-7.231639673569852.897468-2.49580.0162980.008149
M9-6.339950576500543.823156-1.65830.1042120.052106
M10-3.288691623733673.52406-0.93320.3556920.177846
M115.435076002115322.7186871.99920.0516520.025826


Multiple Linear Regression - Regression Statistics
Multiple R0.971939318067388
R-squared0.9446660380053
Adjusted R-squared0.92253245320742
F-TEST (value)42.6802095833921
F-TEST (DF numerator)18
F-TEST (DF denominator)45
p-value0
Multiple Linear Regression - Residual Statistics
Residual Standard Deviation2.82736393509048
Sum Squared Residuals359.729406965265

\begin{tabular}{lllllllll}
\hline
Multiple Linear Regression - Regression Statistics \tabularnewline
Multiple R & 0.971939318067388 \tabularnewline
R-squared & 0.9446660380053 \tabularnewline
Adjusted R-squared & 0.92253245320742 \tabularnewline
F-TEST (value) & 42.6802095833921 \tabularnewline
F-TEST (DF numerator) & 18 \tabularnewline
F-TEST (DF denominator) & 45 \tabularnewline
p-value & 0 \tabularnewline
Multiple Linear Regression - Residual Statistics \tabularnewline
Residual Standard Deviation & 2.82736393509048 \tabularnewline
Sum Squared Residuals & 359.729406965265 \tabularnewline
\hline
\end{tabular}
%Source: https://freestatistics.org/blog/index.php?pk=114942&T=3

[TABLE]
[ROW][C]Multiple Linear Regression - Regression Statistics[/C][/ROW]
[ROW][C]Multiple R[/C][C]0.971939318067388[/C][/ROW]
[ROW][C]R-squared[/C][C]0.9446660380053[/C][/ROW]
[ROW][C]Adjusted R-squared[/C][C]0.92253245320742[/C][/ROW]
[ROW][C]F-TEST (value)[/C][C]42.6802095833921[/C][/ROW]
[ROW][C]F-TEST (DF numerator)[/C][C]18[/C][/ROW]
[ROW][C]F-TEST (DF denominator)[/C][C]45[/C][/ROW]
[ROW][C]p-value[/C][C]0[/C][/ROW]
[ROW][C]Multiple Linear Regression - Residual Statistics[/C][/ROW]
[ROW][C]Residual Standard Deviation[/C][C]2.82736393509048[/C][/ROW]
[ROW][C]Sum Squared Residuals[/C][C]359.729406965265[/C][/ROW]
[/TABLE]
Source: https://freestatistics.org/blog/index.php?pk=114942&T=3

Globally Unique Identifier (entire table): ba.freestatistics.org/blog/index.php?pk=114942&T=3

As an alternative you can also use a QR Code:  

The GUIDs for individual cells are displayed in the table below:

Multiple Linear Regression - Regression Statistics
Multiple R0.971939318067388
R-squared0.9446660380053
Adjusted R-squared0.92253245320742
F-TEST (value)42.6802095833921
F-TEST (DF numerator)18
F-TEST (DF denominator)45
p-value0
Multiple Linear Regression - Residual Statistics
Residual Standard Deviation2.82736393509048
Sum Squared Residuals359.729406965265


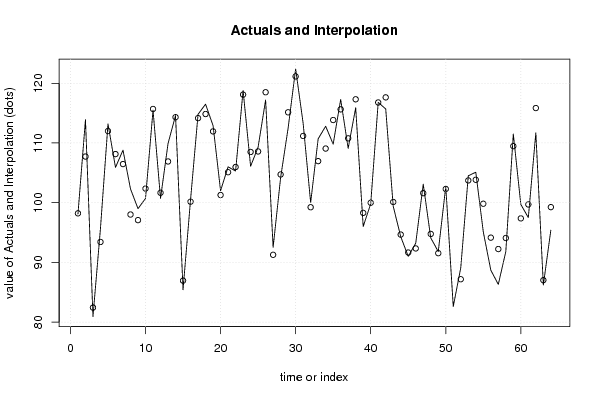
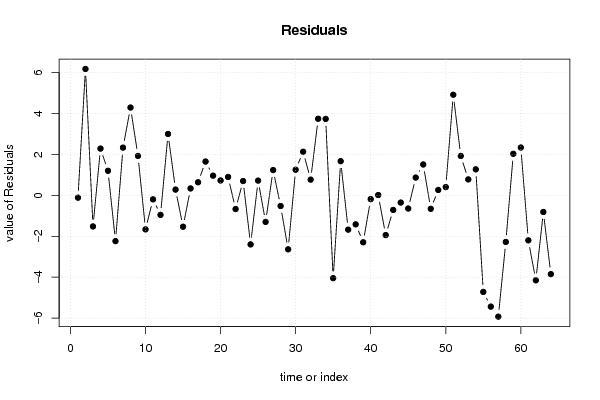
Multiple Linear Regression - Actuals, Interpolation, and Residuals
Time or IndexActualsInterpolationForecastResidualsPrediction Error
198.198.2126858457704-0.11268584577039
2113.9107.7234040544366.17659594556361
380.982.4187825217305-1.51878252173045
495.793.41452381945122.28547618054877
5113.2111.9989124834491.20108751655118
6105.9108.136266679403-2.23626667940299
7108.8106.4674536765972.33254632340276
8102.398.00867453105024.29132546894982
99997.07375192555121.92624807444879
10100.7102.361043037936-1.66104303793599
11115.5115.695653758072-0.19565375807171
12100.7101.653218436107-0.953218436106535
13109.9106.9002131912532.99978680874656
14114.6114.3177856151230.282214384877284
1585.486.9312178978523-1.53121789785226
16100.5100.1621472648720.337852735128445
17114.8114.1599786113630.640021388636504
18116.5114.8482827071681.65171729283243
19112.9111.9365266011240.963473398875858
20102101.2737896666420.726210333358164
21106105.1009460663860.89905393361392
22105.3105.967992678265-0.667992678264846
23118.8118.0987265143350.70127348566528
24106.1108.496166729084-2.39616672908354
25109.3108.578898350950.721101649049747
26117.2118.496871933851-1.29687193385051
2792.591.2647066755041.23529332449606
28104.2104.719301259494-0.519301259494098
29112.5115.13701492345-2.63701492345026
30122.4121.1461879424341.2538120575657
31113.3111.1681968722992.13180312770121
3210099.23064396377650.769356036223451
33110.7106.9569916363163.74300836368439
34112.8109.0651624224473.7348375775528
35109.8113.845530816836-4.045530816836
36117.3115.6302947888061.66970521119373
37109.1110.775007217749-1.6750072177491
38115.9117.316091535858-1.41609153585804
399698.2915522879947-2.29155228799473
4099.899.9826234123155-0.182623412315491
41116.8116.783356358340.0166436416596489
42115.7117.640292328459-1.94029232845949
4399.4100.110975002563-0.71097500256337
4494.394.6518241568002-0.351824156800161
459191.6426872839394-0.642687283939394
4693.292.32927909275320.870720907246779
47103.1101.5911249951631.50887500483729
4894.194.757231725179-0.657231725179031
4991.891.53510558794380.264894412056175
50102.7102.2957394766980.404260523302348
5182.677.6822347617974.91776523820299
5289.187.17209803034191.92790196965811
53104.5103.7207376233970.779262376602925
54105.1103.8289703425361.27102965746434
5595.199.8168478474165-4.71684784741646
5688.794.1350676817313-5.43506768173127
5786.392.2256230878077-5.92562308780771
5891.894.0765227685987-2.27652276859874
59111.5109.4689639155952.03103608440514
6099.797.36308832082462.33691167917537
6197.599.698089806333-2.19808980633299
62111.7115.850107384035-4.15010738403469
6386.287.0115058551216-0.811505855121604
6495.499.2493062135257-3.84930621352573

\begin{tabular}{lllllllll}
\hline
Multiple Linear Regression - Actuals, Interpolation, and Residuals \tabularnewline
Time or Index & Actuals & InterpolationForecast & ResidualsPrediction Error \tabularnewline
1 & 98.1 & 98.2126858457704 & -0.11268584577039 \tabularnewline
2 & 113.9 & 107.723404054436 & 6.17659594556361 \tabularnewline
3 & 80.9 & 82.4187825217305 & -1.51878252173045 \tabularnewline
4 & 95.7 & 93.4145238194512 & 2.28547618054877 \tabularnewline
5 & 113.2 & 111.998912483449 & 1.20108751655118 \tabularnewline
6 & 105.9 & 108.136266679403 & -2.23626667940299 \tabularnewline
7 & 108.8 & 106.467453676597 & 2.33254632340276 \tabularnewline
8 & 102.3 & 98.0086745310502 & 4.29132546894982 \tabularnewline
9 & 99 & 97.0737519255512 & 1.92624807444879 \tabularnewline
10 & 100.7 & 102.361043037936 & -1.66104303793599 \tabularnewline
11 & 115.5 & 115.695653758072 & -0.19565375807171 \tabularnewline
12 & 100.7 & 101.653218436107 & -0.953218436106535 \tabularnewline
13 & 109.9 & 106.900213191253 & 2.99978680874656 \tabularnewline
14 & 114.6 & 114.317785615123 & 0.282214384877284 \tabularnewline
15 & 85.4 & 86.9312178978523 & -1.53121789785226 \tabularnewline
16 & 100.5 & 100.162147264872 & 0.337852735128445 \tabularnewline
17 & 114.8 & 114.159978611363 & 0.640021388636504 \tabularnewline
18 & 116.5 & 114.848282707168 & 1.65171729283243 \tabularnewline
19 & 112.9 & 111.936526601124 & 0.963473398875858 \tabularnewline
20 & 102 & 101.273789666642 & 0.726210333358164 \tabularnewline
21 & 106 & 105.100946066386 & 0.89905393361392 \tabularnewline
22 & 105.3 & 105.967992678265 & -0.667992678264846 \tabularnewline
23 & 118.8 & 118.098726514335 & 0.70127348566528 \tabularnewline
24 & 106.1 & 108.496166729084 & -2.39616672908354 \tabularnewline
25 & 109.3 & 108.57889835095 & 0.721101649049747 \tabularnewline
26 & 117.2 & 118.496871933851 & -1.29687193385051 \tabularnewline
27 & 92.5 & 91.264706675504 & 1.23529332449606 \tabularnewline
28 & 104.2 & 104.719301259494 & -0.519301259494098 \tabularnewline
29 & 112.5 & 115.13701492345 & -2.63701492345026 \tabularnewline
30 & 122.4 & 121.146187942434 & 1.2538120575657 \tabularnewline
31 & 113.3 & 111.168196872299 & 2.13180312770121 \tabularnewline
32 & 100 & 99.2306439637765 & 0.769356036223451 \tabularnewline
33 & 110.7 & 106.956991636316 & 3.74300836368439 \tabularnewline
34 & 112.8 & 109.065162422447 & 3.7348375775528 \tabularnewline
35 & 109.8 & 113.845530816836 & -4.045530816836 \tabularnewline
36 & 117.3 & 115.630294788806 & 1.66970521119373 \tabularnewline
37 & 109.1 & 110.775007217749 & -1.6750072177491 \tabularnewline
38 & 115.9 & 117.316091535858 & -1.41609153585804 \tabularnewline
39 & 96 & 98.2915522879947 & -2.29155228799473 \tabularnewline
40 & 99.8 & 99.9826234123155 & -0.182623412315491 \tabularnewline
41 & 116.8 & 116.78335635834 & 0.0166436416596489 \tabularnewline
42 & 115.7 & 117.640292328459 & -1.94029232845949 \tabularnewline
43 & 99.4 & 100.110975002563 & -0.71097500256337 \tabularnewline
44 & 94.3 & 94.6518241568002 & -0.351824156800161 \tabularnewline
45 & 91 & 91.6426872839394 & -0.642687283939394 \tabularnewline
46 & 93.2 & 92.3292790927532 & 0.870720907246779 \tabularnewline
47 & 103.1 & 101.591124995163 & 1.50887500483729 \tabularnewline
48 & 94.1 & 94.757231725179 & -0.657231725179031 \tabularnewline
49 & 91.8 & 91.5351055879438 & 0.264894412056175 \tabularnewline
50 & 102.7 & 102.295739476698 & 0.404260523302348 \tabularnewline
51 & 82.6 & 77.682234761797 & 4.91776523820299 \tabularnewline
52 & 89.1 & 87.1720980303419 & 1.92790196965811 \tabularnewline
53 & 104.5 & 103.720737623397 & 0.779262376602925 \tabularnewline
54 & 105.1 & 103.828970342536 & 1.27102965746434 \tabularnewline
55 & 95.1 & 99.8168478474165 & -4.71684784741646 \tabularnewline
56 & 88.7 & 94.1350676817313 & -5.43506768173127 \tabularnewline
57 & 86.3 & 92.2256230878077 & -5.92562308780771 \tabularnewline
58 & 91.8 & 94.0765227685987 & -2.27652276859874 \tabularnewline
59 & 111.5 & 109.468963915595 & 2.03103608440514 \tabularnewline
60 & 99.7 & 97.3630883208246 & 2.33691167917537 \tabularnewline
61 & 97.5 & 99.698089806333 & -2.19808980633299 \tabularnewline
62 & 111.7 & 115.850107384035 & -4.15010738403469 \tabularnewline
63 & 86.2 & 87.0115058551216 & -0.811505855121604 \tabularnewline
64 & 95.4 & 99.2493062135257 & -3.84930621352573 \tabularnewline
\hline
\end{tabular}
%Source: https://freestatistics.org/blog/index.php?pk=114942&T=4

[TABLE]
[ROW][C]Multiple Linear Regression - Actuals, Interpolation, and Residuals[/C][/ROW]
[ROW][C]Time or Index[/C][C]Actuals[/C][C]InterpolationForecast[/C][C]ResidualsPrediction Error[/C][/ROW]
[ROW][C]1[/C][C]98.1[/C][C]98.2126858457704[/C][C]-0.11268584577039[/C][/ROW]
[ROW][C]2[/C][C]113.9[/C][C]107.723404054436[/C][C]6.17659594556361[/C][/ROW]
[ROW][C]3[/C][C]80.9[/C][C]82.4187825217305[/C][C]-1.51878252173045[/C][/ROW]
[ROW][C]4[/C][C]95.7[/C][C]93.4145238194512[/C][C]2.28547618054877[/C][/ROW]
[ROW][C]5[/C][C]113.2[/C][C]111.998912483449[/C][C]1.20108751655118[/C][/ROW]
[ROW][C]6[/C][C]105.9[/C][C]108.136266679403[/C][C]-2.23626667940299[/C][/ROW]
[ROW][C]7[/C][C]108.8[/C][C]106.467453676597[/C][C]2.33254632340276[/C][/ROW]
[ROW][C]8[/C][C]102.3[/C][C]98.0086745310502[/C][C]4.29132546894982[/C][/ROW]
[ROW][C]9[/C][C]99[/C][C]97.0737519255512[/C][C]1.92624807444879[/C][/ROW]
[ROW][C]10[/C][C]100.7[/C][C]102.361043037936[/C][C]-1.66104303793599[/C][/ROW]
[ROW][C]11[/C][C]115.5[/C][C]115.695653758072[/C][C]-0.19565375807171[/C][/ROW]
[ROW][C]12[/C][C]100.7[/C][C]101.653218436107[/C][C]-0.953218436106535[/C][/ROW]
[ROW][C]13[/C][C]109.9[/C][C]106.900213191253[/C][C]2.99978680874656[/C][/ROW]
[ROW][C]14[/C][C]114.6[/C][C]114.317785615123[/C][C]0.282214384877284[/C][/ROW]
[ROW][C]15[/C][C]85.4[/C][C]86.9312178978523[/C][C]-1.53121789785226[/C][/ROW]
[ROW][C]16[/C][C]100.5[/C][C]100.162147264872[/C][C]0.337852735128445[/C][/ROW]
[ROW][C]17[/C][C]114.8[/C][C]114.159978611363[/C][C]0.640021388636504[/C][/ROW]
[ROW][C]18[/C][C]116.5[/C][C]114.848282707168[/C][C]1.65171729283243[/C][/ROW]
[ROW][C]19[/C][C]112.9[/C][C]111.936526601124[/C][C]0.963473398875858[/C][/ROW]
[ROW][C]20[/C][C]102[/C][C]101.273789666642[/C][C]0.726210333358164[/C][/ROW]
[ROW][C]21[/C][C]106[/C][C]105.100946066386[/C][C]0.89905393361392[/C][/ROW]
[ROW][C]22[/C][C]105.3[/C][C]105.967992678265[/C][C]-0.667992678264846[/C][/ROW]
[ROW][C]23[/C][C]118.8[/C][C]118.098726514335[/C][C]0.70127348566528[/C][/ROW]
[ROW][C]24[/C][C]106.1[/C][C]108.496166729084[/C][C]-2.39616672908354[/C][/ROW]
[ROW][C]25[/C][C]109.3[/C][C]108.57889835095[/C][C]0.721101649049747[/C][/ROW]
[ROW][C]26[/C][C]117.2[/C][C]118.496871933851[/C][C]-1.29687193385051[/C][/ROW]
[ROW][C]27[/C][C]92.5[/C][C]91.264706675504[/C][C]1.23529332449606[/C][/ROW]
[ROW][C]28[/C][C]104.2[/C][C]104.719301259494[/C][C]-0.519301259494098[/C][/ROW]
[ROW][C]29[/C][C]112.5[/C][C]115.13701492345[/C][C]-2.63701492345026[/C][/ROW]
[ROW][C]30[/C][C]122.4[/C][C]121.146187942434[/C][C]1.2538120575657[/C][/ROW]
[ROW][C]31[/C][C]113.3[/C][C]111.168196872299[/C][C]2.13180312770121[/C][/ROW]
[ROW][C]32[/C][C]100[/C][C]99.2306439637765[/C][C]0.769356036223451[/C][/ROW]
[ROW][C]33[/C][C]110.7[/C][C]106.956991636316[/C][C]3.74300836368439[/C][/ROW]
[ROW][C]34[/C][C]112.8[/C][C]109.065162422447[/C][C]3.7348375775528[/C][/ROW]
[ROW][C]35[/C][C]109.8[/C][C]113.845530816836[/C][C]-4.045530816836[/C][/ROW]
[ROW][C]36[/C][C]117.3[/C][C]115.630294788806[/C][C]1.66970521119373[/C][/ROW]
[ROW][C]37[/C][C]109.1[/C][C]110.775007217749[/C][C]-1.6750072177491[/C][/ROW]
[ROW][C]38[/C][C]115.9[/C][C]117.316091535858[/C][C]-1.41609153585804[/C][/ROW]
[ROW][C]39[/C][C]96[/C][C]98.2915522879947[/C][C]-2.29155228799473[/C][/ROW]
[ROW][C]40[/C][C]99.8[/C][C]99.9826234123155[/C][C]-0.182623412315491[/C][/ROW]
[ROW][C]41[/C][C]116.8[/C][C]116.78335635834[/C][C]0.0166436416596489[/C][/ROW]
[ROW][C]42[/C][C]115.7[/C][C]117.640292328459[/C][C]-1.94029232845949[/C][/ROW]
[ROW][C]43[/C][C]99.4[/C][C]100.110975002563[/C][C]-0.71097500256337[/C][/ROW]
[ROW][C]44[/C][C]94.3[/C][C]94.6518241568002[/C][C]-0.351824156800161[/C][/ROW]
[ROW][C]45[/C][C]91[/C][C]91.6426872839394[/C][C]-0.642687283939394[/C][/ROW]
[ROW][C]46[/C][C]93.2[/C][C]92.3292790927532[/C][C]0.870720907246779[/C][/ROW]
[ROW][C]47[/C][C]103.1[/C][C]101.591124995163[/C][C]1.50887500483729[/C][/ROW]
[ROW][C]48[/C][C]94.1[/C][C]94.757231725179[/C][C]-0.657231725179031[/C][/ROW]
[ROW][C]49[/C][C]91.8[/C][C]91.5351055879438[/C][C]0.264894412056175[/C][/ROW]
[ROW][C]50[/C][C]102.7[/C][C]102.295739476698[/C][C]0.404260523302348[/C][/ROW]
[ROW][C]51[/C][C]82.6[/C][C]77.682234761797[/C][C]4.91776523820299[/C][/ROW]
[ROW][C]52[/C][C]89.1[/C][C]87.1720980303419[/C][C]1.92790196965811[/C][/ROW]
[ROW][C]53[/C][C]104.5[/C][C]103.720737623397[/C][C]0.779262376602925[/C][/ROW]
[ROW][C]54[/C][C]105.1[/C][C]103.828970342536[/C][C]1.27102965746434[/C][/ROW]
[ROW][C]55[/C][C]95.1[/C][C]99.8168478474165[/C][C]-4.71684784741646[/C][/ROW]
[ROW][C]56[/C][C]88.7[/C][C]94.1350676817313[/C][C]-5.43506768173127[/C][/ROW]
[ROW][C]57[/C][C]86.3[/C][C]92.2256230878077[/C][C]-5.92562308780771[/C][/ROW]
[ROW][C]58[/C][C]91.8[/C][C]94.0765227685987[/C][C]-2.27652276859874[/C][/ROW]
[ROW][C]59[/C][C]111.5[/C][C]109.468963915595[/C][C]2.03103608440514[/C][/ROW]
[ROW][C]60[/C][C]99.7[/C][C]97.3630883208246[/C][C]2.33691167917537[/C][/ROW]
[ROW][C]61[/C][C]97.5[/C][C]99.698089806333[/C][C]-2.19808980633299[/C][/ROW]
[ROW][C]62[/C][C]111.7[/C][C]115.850107384035[/C][C]-4.15010738403469[/C][/ROW]
[ROW][C]63[/C][C]86.2[/C][C]87.0115058551216[/C][C]-0.811505855121604[/C][/ROW]
[ROW][C]64[/C][C]95.4[/C][C]99.2493062135257[/C][C]-3.84930621352573[/C][/ROW]
[/TABLE]
Source: https://freestatistics.org/blog/index.php?pk=114942&T=4

Globally Unique Identifier (entire table): ba.freestatistics.org/blog/index.php?pk=114942&T=4

As an alternative you can also use a QR Code:  

The GUIDs for individual cells are displayed in the table below:

Multiple Linear Regression - Actuals, Interpolation, and Residuals
Time or IndexActualsInterpolationForecastResidualsPrediction Error
198.198.2126858457704-0.11268584577039
2113.9107.7234040544366.17659594556361
380.982.4187825217305-1.51878252173045
495.793.41452381945122.28547618054877
5113.2111.9989124834491.20108751655118
6105.9108.136266679403-2.23626667940299
7108.8106.4674536765972.33254632340276
8102.398.00867453105024.29132546894982
99997.07375192555121.92624807444879
10100.7102.361043037936-1.66104303793599
11115.5115.695653758072-0.19565375807171
12100.7101.653218436107-0.953218436106535
13109.9106.9002131912532.99978680874656
14114.6114.3177856151230.282214384877284
1585.486.9312178978523-1.53121789785226
16100.5100.1621472648720.337852735128445
17114.8114.1599786113630.640021388636504
18116.5114.8482827071681.65171729283243
19112.9111.9365266011240.963473398875858
20102101.2737896666420.726210333358164
21106105.1009460663860.89905393361392
22105.3105.967992678265-0.667992678264846
23118.8118.0987265143350.70127348566528
24106.1108.496166729084-2.39616672908354
25109.3108.578898350950.721101649049747
26117.2118.496871933851-1.29687193385051
2792.591.2647066755041.23529332449606
28104.2104.719301259494-0.519301259494098
29112.5115.13701492345-2.63701492345026
30122.4121.1461879424341.2538120575657
31113.3111.1681968722992.13180312770121
3210099.23064396377650.769356036223451
33110.7106.9569916363163.74300836368439
34112.8109.0651624224473.7348375775528
35109.8113.845530816836-4.045530816836
36117.3115.6302947888061.66970521119373
37109.1110.775007217749-1.6750072177491
38115.9117.316091535858-1.41609153585804
399698.2915522879947-2.29155228799473
4099.899.9826234123155-0.182623412315491
41116.8116.783356358340.0166436416596489
42115.7117.640292328459-1.94029232845949
4399.4100.110975002563-0.71097500256337
4494.394.6518241568002-0.351824156800161
459191.6426872839394-0.642687283939394
4693.292.32927909275320.870720907246779
47103.1101.5911249951631.50887500483729
4894.194.757231725179-0.657231725179031
4991.891.53510558794380.264894412056175
50102.7102.2957394766980.404260523302348
5182.677.6822347617974.91776523820299
5289.187.17209803034191.92790196965811
53104.5103.7207376233970.779262376602925
54105.1103.8289703425361.27102965746434
5595.199.8168478474165-4.71684784741646
5688.794.1350676817313-5.43506768173127
5786.392.2256230878077-5.92562308780771
5891.894.0765227685987-2.27652276859874
59111.5109.4689639155952.03103608440514
6099.797.36308832082462.33691167917537
6197.599.698089806333-2.19808980633299
62111.7115.850107384035-4.15010738403469
6386.287.0115058551216-0.811505855121604
6495.499.2493062135257-3.84930621352573


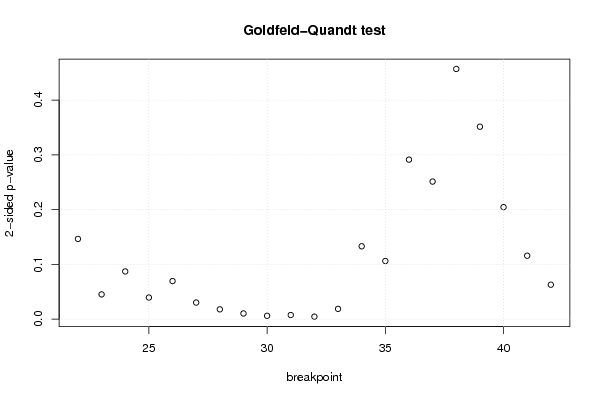
Goldfeld-Quandt test for Heteroskedasticity
p-valuesAlternative Hypothesis
breakpoint indexgreater2-sidedless
220.0732113970644470.1464227941288940.926788602935553
230.02255659262294210.04511318524588410.977443407377058
240.04353118343722260.08706236687444510.956468816562777
250.01968323089892130.03936646179784260.980316769101079
260.03471497778190450.0694299555638090.965285022218096
270.01508689674379010.03017379348758010.98491310325621
280.008917006901036920.01783401380207380.991082993098963
290.005135391694376150.01027078338875230.994864608305624
300.002990416753053130.005980833506106260.997009583246947
310.003707645709759980.007415291419519970.99629235429024
320.00221653957335760.004433079146715190.997783460426642
330.009319906157267030.01863981231453410.990680093842733
340.06648382371873950.1329676474374790.93351617628126
350.05304186362807550.1060837272561510.946958136371924
360.1456315542231260.2912631084462520.854368445776874
370.1256107518240470.2512215036480930.874389248175953
380.2284724587893490.4569449175786990.77152754121065
390.1757103054746090.3514206109492190.82428969452539
400.1022379902010560.2044759804021130.897762009798944
410.05786567880681610.1157313576136320.942134321193184
420.0314110011280210.0628220022560420.968588998871979

\begin{tabular}{lllllllll}
\hline
Goldfeld-Quandt test for Heteroskedasticity \tabularnewline
p-values & Alternative Hypothesis \tabularnewline
breakpoint index & greater & 2-sided & less \tabularnewline
22 & 0.073211397064447 & 0.146422794128894 & 0.926788602935553 \tabularnewline
23 & 0.0225565926229421 & 0.0451131852458841 & 0.977443407377058 \tabularnewline
24 & 0.0435311834372226 & 0.0870623668744451 & 0.956468816562777 \tabularnewline
25 & 0.0196832308989213 & 0.0393664617978426 & 0.980316769101079 \tabularnewline
26 & 0.0347149777819045 & 0.069429955563809 & 0.965285022218096 \tabularnewline
27 & 0.0150868967437901 & 0.0301737934875801 & 0.98491310325621 \tabularnewline
28 & 0.00891700690103692 & 0.0178340138020738 & 0.991082993098963 \tabularnewline
29 & 0.00513539169437615 & 0.0102707833887523 & 0.994864608305624 \tabularnewline
30 & 0.00299041675305313 & 0.00598083350610626 & 0.997009583246947 \tabularnewline
31 & 0.00370764570975998 & 0.00741529141951997 & 0.99629235429024 \tabularnewline
32 & 0.0022165395733576 & 0.00443307914671519 & 0.997783460426642 \tabularnewline
33 & 0.00931990615726703 & 0.0186398123145341 & 0.990680093842733 \tabularnewline
34 & 0.0664838237187395 & 0.132967647437479 & 0.93351617628126 \tabularnewline
35 & 0.0530418636280755 & 0.106083727256151 & 0.946958136371924 \tabularnewline
36 & 0.145631554223126 & 0.291263108446252 & 0.854368445776874 \tabularnewline
37 & 0.125610751824047 & 0.251221503648093 & 0.874389248175953 \tabularnewline
38 & 0.228472458789349 & 0.456944917578699 & 0.77152754121065 \tabularnewline
39 & 0.175710305474609 & 0.351420610949219 & 0.82428969452539 \tabularnewline
40 & 0.102237990201056 & 0.204475980402113 & 0.897762009798944 \tabularnewline
41 & 0.0578656788068161 & 0.115731357613632 & 0.942134321193184 \tabularnewline
42 & 0.031411001128021 & 0.062822002256042 & 0.968588998871979 \tabularnewline
\hline
\end{tabular}
%Source: https://freestatistics.org/blog/index.php?pk=114942&T=5

[TABLE]
[ROW][C]Goldfeld-Quandt test for Heteroskedasticity[/C][/ROW]
[ROW][C]p-values[/C][C]Alternative Hypothesis[/C][/ROW]
[ROW][C]breakpoint index[/C][C]greater[/C][C]2-sided[/C][C]less[/C][/ROW]
[ROW][C]22[/C][C]0.073211397064447[/C][C]0.146422794128894[/C][C]0.926788602935553[/C][/ROW]
[ROW][C]23[/C][C]0.0225565926229421[/C][C]0.0451131852458841[/C][C]0.977443407377058[/C][/ROW]
[ROW][C]24[/C][C]0.0435311834372226[/C][C]0.0870623668744451[/C][C]0.956468816562777[/C][/ROW]
[ROW][C]25[/C][C]0.0196832308989213[/C][C]0.0393664617978426[/C][C]0.980316769101079[/C][/ROW]
[ROW][C]26[/C][C]0.0347149777819045[/C][C]0.069429955563809[/C][C]0.965285022218096[/C][/ROW]
[ROW][C]27[/C][C]0.0150868967437901[/C][C]0.0301737934875801[/C][C]0.98491310325621[/C][/ROW]
[ROW][C]28[/C][C]0.00891700690103692[/C][C]0.0178340138020738[/C][C]0.991082993098963[/C][/ROW]
[ROW][C]29[/C][C]0.00513539169437615[/C][C]0.0102707833887523[/C][C]0.994864608305624[/C][/ROW]
[ROW][C]30[/C][C]0.00299041675305313[/C][C]0.00598083350610626[/C][C]0.997009583246947[/C][/ROW]
[ROW][C]31[/C][C]0.00370764570975998[/C][C]0.00741529141951997[/C][C]0.99629235429024[/C][/ROW]
[ROW][C]32[/C][C]0.0022165395733576[/C][C]0.00443307914671519[/C][C]0.997783460426642[/C][/ROW]
[ROW][C]33[/C][C]0.00931990615726703[/C][C]0.0186398123145341[/C][C]0.990680093842733[/C][/ROW]
[ROW][C]34[/C][C]0.0664838237187395[/C][C]0.132967647437479[/C][C]0.93351617628126[/C][/ROW]
[ROW][C]35[/C][C]0.0530418636280755[/C][C]0.106083727256151[/C][C]0.946958136371924[/C][/ROW]
[ROW][C]36[/C][C]0.145631554223126[/C][C]0.291263108446252[/C][C]0.854368445776874[/C][/ROW]
[ROW][C]37[/C][C]0.125610751824047[/C][C]0.251221503648093[/C][C]0.874389248175953[/C][/ROW]
[ROW][C]38[/C][C]0.228472458789349[/C][C]0.456944917578699[/C][C]0.77152754121065[/C][/ROW]
[ROW][C]39[/C][C]0.175710305474609[/C][C]0.351420610949219[/C][C]0.82428969452539[/C][/ROW]
[ROW][C]40[/C][C]0.102237990201056[/C][C]0.204475980402113[/C][C]0.897762009798944[/C][/ROW]
[ROW][C]41[/C][C]0.0578656788068161[/C][C]0.115731357613632[/C][C]0.942134321193184[/C][/ROW]
[ROW][C]42[/C][C]0.031411001128021[/C][C]0.062822002256042[/C][C]0.968588998871979[/C][/ROW]
[/TABLE]
Source: https://freestatistics.org/blog/index.php?pk=114942&T=5

Globally Unique Identifier (entire table): ba.freestatistics.org/blog/index.php?pk=114942&T=5

As an alternative you can also use a QR Code:  

The GUIDs for individual cells are displayed in the table below:

Goldfeld-Quandt test for Heteroskedasticity
p-valuesAlternative Hypothesis
breakpoint indexgreater2-sidedless
220.0732113970644470.1464227941288940.926788602935553
230.02255659262294210.04511318524588410.977443407377058
240.04353118343722260.08706236687444510.956468816562777
250.01968323089892130.03936646179784260.980316769101079
260.03471497778190450.0694299555638090.965285022218096
270.01508689674379010.03017379348758010.98491310325621
280.008917006901036920.01783401380207380.991082993098963
290.005135391694376150.01027078338875230.994864608305624
300.002990416753053130.005980833506106260.997009583246947
310.003707645709759980.007415291419519970.99629235429024
320.00221653957335760.004433079146715190.997783460426642
330.009319906157267030.01863981231453410.990680093842733
340.06648382371873950.1329676474374790.93351617628126
350.05304186362807550.1060837272561510.946958136371924
360.1456315542231260.2912631084462520.854368445776874
370.1256107518240470.2512215036480930.874389248175953
380.2284724587893490.4569449175786990.77152754121065
390.1757103054746090.3514206109492190.82428969452539
400.1022379902010560.2044759804021130.897762009798944
410.05786567880681610.1157313576136320.942134321193184
420.0314110011280210.0628220022560420.968588998871979


Meta Analysis of Goldfeld-Quandt test for Heteroskedasticity
Description# significant tests% significant testsOK/NOK
1% type I error level30.142857142857143NOK
5% type I error level90.428571428571429NOK
10% type I error level120.571428571428571NOK

\begin{tabular}{lllllllll}
\hline
Meta Analysis of Goldfeld-Quandt test for Heteroskedasticity \tabularnewline
Description & # significant tests & % significant tests & OK/NOK \tabularnewline
1% type I error level & 3 & 0.142857142857143 & NOK \tabularnewline
5% type I error level & 9 & 0.428571428571429 & NOK \tabularnewline
10% type I error level & 12 & 0.571428571428571 & NOK \tabularnewline
\hline
\end{tabular}
%Source: https://freestatistics.org/blog/index.php?pk=114942&T=6

[TABLE]
[ROW][C]Meta Analysis of Goldfeld-Quandt test for Heteroskedasticity[/C][/ROW]
[ROW][C]Description[/C][C]# significant tests[/C][C]% significant tests[/C][C]OK/NOK[/C][/ROW]
[ROW][C]1% type I error level[/C][C]3[/C][C]0.142857142857143[/C][C]NOK[/C][/ROW]
[ROW][C]5% type I error level[/C][C]9[/C][C]0.428571428571429[/C][C]NOK[/C][/ROW]
[ROW][C]10% type I error level[/C][C]12[/C][C]0.571428571428571[/C][C]NOK[/C][/ROW]
[/TABLE]
Source: https://freestatistics.org/blog/index.php?pk=114942&T=6

Globally Unique Identifier (entire table): ba.freestatistics.org/blog/index.php?pk=114942&T=6

As an alternative you can also use a QR Code:  

The GUIDs for individual cells are displayed in the table below:

Meta Analysis of Goldfeld-Quandt test for Heteroskedasticity
Description# significant tests% significant testsOK/NOK
1% type I error level30.142857142857143NOK
5% type I error level90.428571428571429NOK
10% type I error level120.571428571428571NOK


Parameters (Session):
par1 = 1 ; par2 = Include Monthly Dummies ; par3 = No Linear Trend ;
Parameters (R input):
par1 = 1 ; par2 = Include Monthly Dummies ; par3 = No Linear Trend ;
R code (references can be found in the software module):
library(lattice)
library(lmtest)
n25 <- 25 #minimum number of obs. for Goldfeld-Quandt test
par1 <- as.numeric(par1)
x <- t(y)
k <- length(x[1,])
n <- length(x[,1])
x1 <- cbind(x[,par1], x[,1:k!=par1])
mycolnames <- c(colnames(x)[par1], colnames(x)[1:k!=par1])
colnames(x1) <- mycolnames #colnames(x)[par1]
x <- x1
if (par3 == 'First Differences'){
x2 <- array(0, dim=c(n-1,k), dimnames=list(1:(n-1), paste('(1-B)',colnames(x),sep='')))
for (i in 1:n-1) {
for (j in 1:k) {
x2[i,j] <- x[i+1,j] - x[i,j]
}
}
x <- x2
}
if (par2 == 'Include Monthly Dummies'){
x2 <- array(0, dim=c(n,11), dimnames=list(1:n, paste('M', seq(1:11), sep ='')))
for (i in 1:11){
x2[seq(i,n,12),i] <- 1
}
x <- cbind(x, x2)
}
if (par2 == 'Include Quarterly Dummies'){
x2 <- array(0, dim=c(n,3), dimnames=list(1:n, paste('Q', seq(1:3), sep ='')))
for (i in 1:3){
x2[seq(i,n,4),i] <- 1
}
x <- cbind(x, x2)
}
k <- length(x[1,])
if (par3 == 'Linear Trend'){
x <- cbind(x, c(1:n))
colnames(x)[k+1] <- 't'
}
x
k <- length(x[1,])
df <- as.data.frame(x)
(mylm <- lm(df))
(mysum <- summary(mylm))
if (n > n25) {
kp3 <- k + 3
nmkm3 <- n - k - 3
gqarr <- array(NA, dim=c(nmkm3-kp3+1,3))
numgqtests <- 0
numsignificant1 <- 0
numsignificant5 <- 0
numsignificant10 <- 0
for (mypoint in kp3:nmkm3) {
j <- 0
numgqtests <- numgqtests + 1
for (myalt in c('greater', 'two.sided', 'less')) {
j <- j + 1
gqarr[mypoint-kp3+1,j] <- gqtest(mylm, point=mypoint, alternative=myalt)$p.value
}
if (gqarr[mypoint-kp3+1,2] < 0.01) numsignificant1 <- numsignificant1 + 1
if (gqarr[mypoint-kp3+1,2] < 0.05) numsignificant5 <- numsignificant5 + 1
if (gqarr[mypoint-kp3+1,2] < 0.10) numsignificant10 <- numsignificant10 + 1
}
gqarr
}
bitmap(file='test0.png')
plot(x[,1], type='l', main='Actuals and Interpolation', ylab='value of Actuals and Interpolation (dots)', xlab='time or index')
points(x[,1]-mysum$resid)
grid()
dev.off()
bitmap(file='test1.png')
plot(mysum$resid, type='b', pch=19, main='Residuals', ylab='value of Residuals', xlab='time or index')
grid()
dev.off()
bitmap(file='test2.png')
hist(mysum$resid, main='Residual Histogram', xlab='values of Residuals')
grid()
dev.off()
bitmap(file='test3.png')
densityplot(~mysum$resid,col='black',main='Residual Density Plot', xlab='values of Residuals')
dev.off()
bitmap(file='test4.png')
qqnorm(mysum$resid, main='Residual Normal Q-Q Plot')
qqline(mysum$resid)
grid()
dev.off()
(myerror <- as.ts(mysum$resid))
bitmap(file='test5.png')
dum <- cbind(lag(myerror,k=1),myerror)
dum
dum1 <- dum[2:length(myerror),]
dum1
z <- as.data.frame(dum1)
z
plot(z,main=paste('Residual Lag plot, lowess, and regression line'), ylab='values of Residuals', xlab='lagged values of Residuals')
lines(lowess(z))
abline(lm(z))
grid()
dev.off()
bitmap(file='test6.png')
acf(mysum$resid, lag.max=length(mysum$resid)/2, main='Residual Autocorrelation Function')
grid()
dev.off()
bitmap(file='test7.png')
pacf(mysum$resid, lag.max=length(mysum$resid)/2, main='Residual Partial Autocorrelation Function')
grid()
dev.off()
bitmap(file='test8.png')
opar <- par(mfrow = c(2,2), oma = c(0, 0, 1.1, 0))
plot(mylm, las = 1, sub='Residual Diagnostics')
par(opar)
dev.off()
if (n > n25) {
bitmap(file='test9.png')
plot(kp3:nmkm3,gqarr[,2], main='Goldfeld-Quandt test',ylab='2-sided p-value',xlab='breakpoint')
grid()
dev.off()
}
load(file='createtable')
a<-table.start()
a<-table.row.start(a)
a<-table.element(a, 'Multiple Linear Regression - Estimated Regression Equation', 1, TRUE)
a<-table.row.end(a)
myeq <- colnames(x)[1]
myeq <- paste(myeq, '[t] = ', sep='')
for (i in 1:k){
if (mysum$coefficients[i,1] > 0) myeq <- paste(myeq, '+', '')
myeq <- paste(myeq, mysum$coefficients[i,1], sep=' ')
if (rownames(mysum$coefficients)[i] != '(Intercept)') {
myeq <- paste(myeq, rownames(mysum$coefficients)[i], sep='')
if (rownames(mysum$coefficients)[i] != 't') myeq <- paste(myeq, '[t]', sep='')
}
}
myeq <- paste(myeq, ' + e[t]')
a<-table.row.start(a)
a<-table.element(a, myeq)
a<-table.row.end(a)
a<-table.end(a)
table.save(a,file='mytable1.tab')
a<-table.start()
a<-table.row.start(a)
a<-table.element(a,hyperlink('ols1.htm','Multiple Linear Regression - Ordinary Least Squares',''), 6, TRUE)
a<-table.row.end(a)
a<-table.row.start(a)
a<-table.element(a,'Variable',header=TRUE)
a<-table.element(a,'Parameter',header=TRUE)
a<-table.element(a,'S.D.',header=TRUE)
a<-table.element(a,'T-STAT
H0: parameter = 0',header=TRUE)
a<-table.element(a,'2-tail p-value',header=TRUE)
a<-table.element(a,'1-tail p-value',header=TRUE)
a<-table.row.end(a)
for (i in 1:k){
a<-table.row.start(a)
a<-table.element(a,rownames(mysum$coefficients)[i],header=TRUE)
a<-table.element(a,mysum$coefficients[i,1])
a<-table.element(a, round(mysum$coefficients[i,2],6))
a<-table.element(a, round(mysum$coefficients[i,3],4))
a<-table.element(a, round(mysum$coefficients[i,4],6))
a<-table.element(a, round(mysum$coefficients[i,4]/2,6))
a<-table.row.end(a)
}
a<-table.end(a)
table.save(a,file='mytable2.tab')
a<-table.start()
a<-table.row.start(a)
a<-table.element(a, 'Multiple Linear Regression - Regression Statistics', 2, TRUE)
a<-table.row.end(a)
a<-table.row.start(a)
a<-table.element(a, 'Multiple R',1,TRUE)
a<-table.element(a, sqrt(mysum$r.squared))
a<-table.row.end(a)
a<-table.row.start(a)
a<-table.element(a, 'R-squared',1,TRUE)
a<-table.element(a, mysum$r.squared)
a<-table.row.end(a)
a<-table.row.start(a)
a<-table.element(a, 'Adjusted R-squared',1,TRUE)
a<-table.element(a, mysum$adj.r.squared)
a<-table.row.end(a)
a<-table.row.start(a)
a<-table.element(a, 'F-TEST (value)',1,TRUE)
a<-table.element(a, mysum$fstatistic[1])
a<-table.row.end(a)
a<-table.row.start(a)
a<-table.element(a, 'F-TEST (DF numerator)',1,TRUE)
a<-table.element(a, mysum$fstatistic[2])
a<-table.row.end(a)
a<-table.row.start(a)
a<-table.element(a, 'F-TEST (DF denominator)',1,TRUE)
a<-table.element(a, mysum$fstatistic[3])
a<-table.row.end(a)
a<-table.row.start(a)
a<-table.element(a, 'p-value',1,TRUE)
a<-table.element(a, 1-pf(mysum$fstatistic[1],mysum$fstatistic[2],mysum$fstatistic[3]))
a<-table.row.end(a)
a<-table.row.start(a)
a<-table.element(a, 'Multiple Linear Regression - Residual Statistics', 2, TRUE)
a<-table.row.end(a)
a<-table.row.start(a)
a<-table.element(a, 'Residual Standard Deviation',1,TRUE)
a<-table.element(a, mysum$sigma)
a<-table.row.end(a)
a<-table.row.start(a)
a<-table.element(a, 'Sum Squared Residuals',1,TRUE)
a<-table.element(a, sum(myerror*myerror))
a<-table.row.end(a)
a<-table.end(a)
table.save(a,file='mytable3.tab')
a<-table.start()
a<-table.row.start(a)
a<-table.element(a, 'Multiple Linear Regression - Actuals, Interpolation, and Residuals', 4, TRUE)
a<-table.row.end(a)
a<-table.row.start(a)
a<-table.element(a, 'Time or Index', 1, TRUE)
a<-table.element(a, 'Actuals', 1, TRUE)
a<-table.element(a, 'Interpolation
Forecast', 1, TRUE)
a<-table.element(a, 'Residuals
Prediction Error', 1, TRUE)
a<-table.row.end(a)
for (i in 1:n) {
a<-table.row.start(a)
a<-table.element(a,i, 1, TRUE)
a<-table.element(a,x[i])
a<-table.element(a,x[i]-mysum$resid[i])
a<-table.element(a,mysum$resid[i])
a<-table.row.end(a)
}
a<-table.end(a)
table.save(a,file='mytable4.tab')
if (n > n25) {
a<-table.start()
a<-table.row.start(a)
a<-table.element(a,'Goldfeld-Quandt test for Heteroskedasticity',4,TRUE)
a<-table.row.end(a)
a<-table.row.start(a)
a<-table.element(a,'p-values',header=TRUE)
a<-table.element(a,'Alternative Hypothesis',3,header=TRUE)
a<-table.row.end(a)
a<-table.row.start(a)
a<-table.element(a,'breakpoint index',header=TRUE)
a<-table.element(a,'greater',header=TRUE)
a<-table.element(a,'2-sided',header=TRUE)
a<-table.element(a,'less',header=TRUE)
a<-table.row.end(a)
for (mypoint in kp3:nmkm3) {
a<-table.row.start(a)
a<-table.element(a,mypoint,header=TRUE)
a<-table.element(a,gqarr[mypoint-kp3+1,1])
a<-table.element(a,gqarr[mypoint-kp3+1,2])
a<-table.element(a,gqarr[mypoint-kp3+1,3])
a<-table.row.end(a)
}
a<-table.end(a)
table.save(a,file='mytable5.tab')
a<-table.start()
a<-table.row.start(a)
a<-table.element(a,'Meta Analysis of Goldfeld-Quandt test for Heteroskedasticity',4,TRUE)
a<-table.row.end(a)
a<-table.row.start(a)
a<-table.element(a,'Description',header=TRUE)
a<-table.element(a,'# significant tests',header=TRUE)
a<-table.element(a,'% significant tests',header=TRUE)
a<-table.element(a,'OK/NOK',header=TRUE)
a<-table.row.end(a)
a<-table.row.start(a)
a<-table.element(a,'1% type I error level',header=TRUE)
a<-table.element(a,numsignificant1)
a<-table.element(a,numsignificant1/numgqtests)
if (numsignificant1/numgqtests < 0.01) dum <- 'OK' else dum <- 'NOK'
a<-table.element(a,dum)
a<-table.row.end(a)
a<-table.row.start(a)
a<-table.element(a,'5% type I error level',header=TRUE)
a<-table.element(a,numsignificant5)
a<-table.element(a,numsignificant5/numgqtests)
if (numsignificant5/numgqtests < 0.05) dum <- 'OK' else dum <- 'NOK'
a<-table.element(a,dum)
a<-table.row.end(a)
a<-table.row.start(a)
a<-table.element(a,'10% type I error level',header=TRUE)
a<-table.element(a,numsignificant10)
a<-table.element(a,numsignificant10/numgqtests)
if (numsignificant10/numgqtests < 0.1) dum <- 'OK' else dum <- 'NOK'
a<-table.element(a,dum)
a<-table.row.end(a)
a<-table.end(a)
table.save(a,file='mytable6.tab')
}