| Multiple Linear Regression - Estimated Regression Equation |
| LKI[t] = -32.3607428109776 + 1.57163858977850CPI[t] -18.3733655297165Q1[t] -12.3285261175605Q2[t] -14.5529109634028Q3[t] + e[t] |
| Multiple Linear Regression - Ordinary Least Squares | |||||
| Variable | Parameter | S.D. | T-STAT H0: parameter = 0 | 2-tail p-value | 1-tail p-value |
| (Intercept) | -32.3607428109776 | 3.330902 | -9.7153 | 0 | 0 |
| CPI | 1.57163858977850 | 0.034001 | 46.2233 | 0 | 0 |
| Q1 | -18.3733655297165 | 0.742379 | -24.7493 | 0 | 0 |
| Q2 | -12.3285261175605 | 0.741369 | -16.6294 | 0 | 0 |
| Q3 | -14.5529109634028 | 0.741071 | -19.6377 | 0 | 0 |
| Multiple Linear Regression - Regression Statistics | |
| Multiple R | 0.9914725479775 |
| R-squared | 0.983017813392995 |
| Adjusted R-squared | 0.981685877188525 |
| F-TEST (value) | 738.036709335835 |
| F-TEST (DF numerator) | 4 |
| F-TEST (DF denominator) | 51 |
| p-value | 0 |
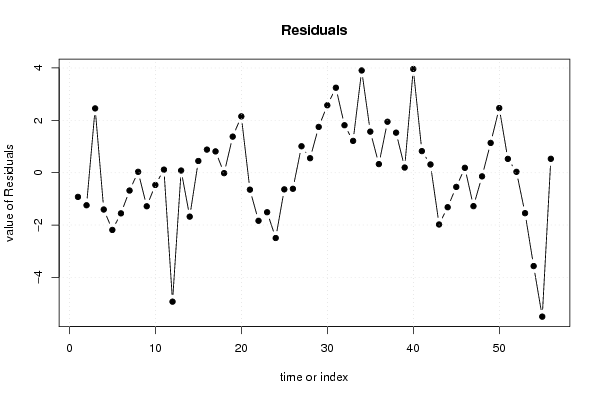
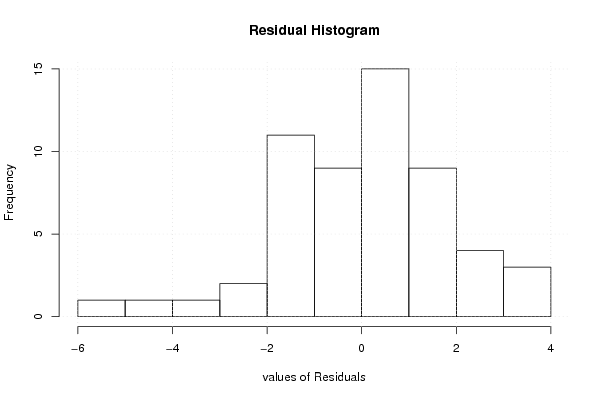
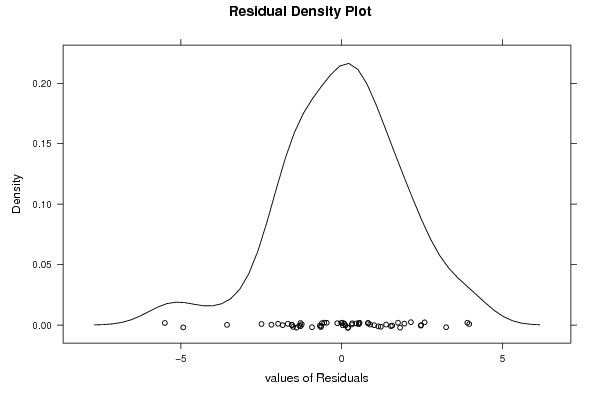
| Multiple Linear Regression - Residual Statistics | |
| Residual Standard Deviation | 1.96066508658799 |
| Sum Squared Residuals | 196.054586670019 |
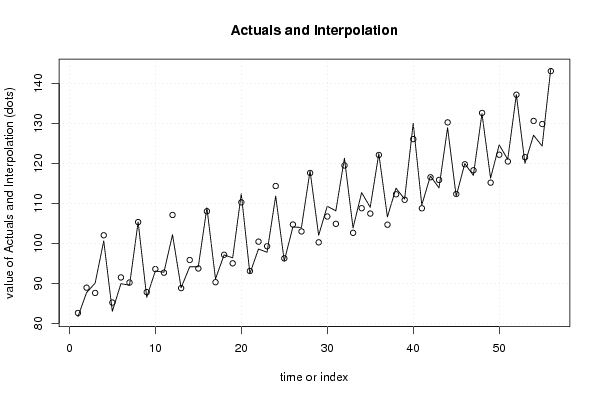
| Multiple Linear Regression - Actuals, Interpolation, and Residuals | |||
| Time or Index | Actuals | Interpolation Forecast | Residuals Prediction Error |
| 1 | 81.71 | 82.6351423879086 | -0.925142387908629 |
| 2 | 87.703 | 88.9471603603273 | -1.24416036032729 |
| 3 | 90.09 | 87.6343258965565 | 2.45567410344347 |
| 4 | 100.639 | 102.045789386879 | -1.40678938687924 |
| 5 | 83.042 | 85.2283460610435 | -2.18634606104345 |
| 6 | 89.956 | 91.5089312616662 | -1.55293126166622 |
| 7 | 89.561 | 90.2432459555888 | -0.682245955588831 |
| 8 | 105.38 | 105.346230425414 | 0.0337695745859021 |
| 9 | 86.554 | 87.8372661200758 | -1.28326612007576 |
| 10 | 93.131 | 93.5992105860716 | -0.468210586071625 |
| 11 | 92.812 | 92.6950021556433 | 0.116997844356707 |
| 12 | 102.195 | 107.122182031864 | -4.92718203186379 |
| 13 | 88.925 | 88.843114817534 | 0.0818851824660004 |
| 14 | 94.184 | 95.8623701553527 | -1.67837015535268 |
| 15 | 94.196 | 93.7480000107949 | 0.447999989205114 |
| 16 | 108.932 | 108.049448799833 | 0.882551200166897 |
| 17 | 91.134 | 90.3204550919258 | 0.813544908074221 |
| 18 | 97.149 | 97.1668301848688 | -0.0178301848688226 |
| 19 | 96.415 | 95.0367436544132 | 1.37825634558677 |
| 20 | 112.432 | 110.281175597319 | 2.15082440268143 |
| 21 | 92.47 | 93.1179717817315 | -0.647971781731503 |
| 22 | 98.61410515 | 100.451554837506 | -1.83744968750586 |
| 23 | 97.80117197 | 99.3116006186108 | -1.51042864861077 |
| 24 | 111.8560178 | 114.351719544845 | -2.49570174484485 |
| 25 | 95.63981455 | 96.2769653471863 | -0.637150797186286 |
| 26 | 104.1120262 | 104.726411801703 | -0.614385601703362 |
| 27 | 104.0148224 | 103.004951304590 | 1.00987109540978 |
| 28 | 118.1743476 | 117.620727811584 | 0.553619788415862 |
| 29 | 102.033431 | 100.284643751121 | 1.74878724887855 |
| 30 | 109.3138852 | 106.738109196620 | 2.57577600338016 |
| 31 | 108.1523649 | 104.906633998222 | 3.24573090177780 |
| 32 | 121.30381 | 119.490977733421 | 1.81283226657945 |
| 33 | 103.8725146 | 102.657818021687 | 1.21469657831305 |
| 34 | 112.7185207 | 108.812672135127 | 3.90584856487253 |
| 35 | 109.0381253 | 107.468404899561 | 1.56972040043885 |
| 36 | 122.4434864 | 122.115614178351 | 0.327872221649359 |
| 37 | 106.6325686 | 104.685231802501 | 1.94733679749878 |
| 38 | 113.8153852 | 112.285993418538 | 1.52939178146207 |
| 39 | 111.1071252 | 110.910293411176 | 0.196831788823947 |
| 40 | 130.039536 | 126.076143424592 | 3.96339257540756 |
| 41 | 109.6121057 | 108.787208521823 | 0.824897178176908 |
| 42 | 116.8592117 | 116.545133996838 | 0.314077703162339 |
| 43 | 113.8982545 | 115.876671354876 | -1.9784168548761 |
| 44 | 128.9375926 | 130.256702073403 | -1.31910947340324 |
| 45 | 111.8120023 | 112.354828120620 | -0.542825820620266 |
| 46 | 119.9689463 | 119.782709491781 | 0.186236808218633 |
| 47 | 117.018539 | 118.296994783135 | -1.27845578313498 |
| 48 | 132.4743387 | 132.614159958071 | -0.139821258070968 |
| 49 | 116.3369106 | 115.199493968119 | 1.13741663188065 |
| 50 | 124.6405636 | 122.171600148245 | 2.46896345175532 |
| 51 | 121.025249 | 120.497288808825 | 0.527960191175139 |
| 52 | 137.2054829 | 137.171911868429 | 0.0335710315713785 |
| 53 | 120.0187687 | 121.564630256722 | -1.54586155672225 |
| 54 | 127.0443429 | 130.611299375355 | -3.56695647535519 |
| 55 | 124.349043 | 129.848538418007 | -5.49949541800691 |
| 56 | 143.6114438 | 143.081272965996 | 0.530170834004248 |
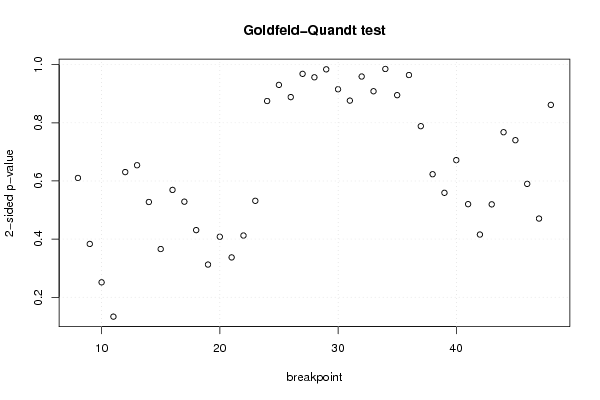
| Goldfeld-Quandt test for Heteroskedasticity | |||
| p-values | Alternative Hypothesis | ||
| breakpoint index | greater | 2-sided | less |
| 8 | 0.305157613555767 | 0.610315227111534 | 0.694842386444233 |
| 9 | 0.191719941010000 | 0.383439882020001 | 0.80828005899 |
| 10 | 0.125717890437361 | 0.251435780874722 | 0.874282109562639 |
| 11 | 0.0666892610062383 | 0.133378522012477 | 0.933310738993762 |
| 12 | 0.315264280731397 | 0.630528561462794 | 0.684735719268603 |
| 13 | 0.327069617066943 | 0.654139234133887 | 0.672930382933057 |
| 14 | 0.263838828709626 | 0.527677657419251 | 0.736161171290374 |
| 15 | 0.182930657380934 | 0.365861314761869 | 0.817069342619066 |
| 16 | 0.284627898779412 | 0.569255797558824 | 0.715372101220588 |
| 17 | 0.264382403211655 | 0.52876480642331 | 0.735617596788345 |
| 18 | 0.215487218955776 | 0.430974437911552 | 0.784512781044224 |
| 19 | 0.156262590379952 | 0.312525180759905 | 0.843737409620048 |
| 20 | 0.204045780688484 | 0.408091561376969 | 0.795954219311516 |
| 21 | 0.168580431141209 | 0.337160862282417 | 0.831419568858791 |
| 22 | 0.206186361317141 | 0.412372722634282 | 0.793813638682859 |
| 23 | 0.265878764058872 | 0.531757528117745 | 0.734121235941128 |
| 24 | 0.437482965073149 | 0.874965930146298 | 0.562517034926851 |
| 25 | 0.465172222380253 | 0.930344444760507 | 0.534827777619747 |
| 26 | 0.55579562519426 | 0.88840874961148 | 0.44420437480574 |
| 27 | 0.48420326057337 | 0.96840652114674 | 0.51579673942663 |
| 28 | 0.521748807249711 | 0.956502385500578 | 0.478251192750289 |
| 29 | 0.508033750613352 | 0.983932498773297 | 0.491966249386648 |
| 30 | 0.542289328312775 | 0.91542134337445 | 0.457710671687225 |
| 31 | 0.5618438196614 | 0.8763123606772 | 0.4381561803386 |
| 32 | 0.520414824525526 | 0.959170350948947 | 0.479585175474474 |
| 33 | 0.45426705348261 | 0.90853410696522 | 0.545732946517389 |
| 34 | 0.50738349486717 | 0.98523301026566 | 0.49261650513283 |
| 35 | 0.447533996849481 | 0.895067993698962 | 0.552466003150519 |
| 36 | 0.482149363452546 | 0.964298726905091 | 0.517850636547454 |
| 37 | 0.394217845416259 | 0.788435690832518 | 0.605782154583741 |
| 38 | 0.311589265189982 | 0.623178530379964 | 0.688410734810018 |
| 39 | 0.279627966912255 | 0.559255933824509 | 0.720372033087745 |
| 40 | 0.335851734189755 | 0.67170346837951 | 0.664148265810245 |
| 41 | 0.260162209758528 | 0.520324419517057 | 0.739837790241471 |
| 42 | 0.207856014285557 | 0.415712028571113 | 0.792143985714443 |
| 43 | 0.259805901221165 | 0.519611802442329 | 0.740194098778835 |
| 44 | 0.38384153092534 | 0.76768306185068 | 0.61615846907466 |
| 45 | 0.370118610670573 | 0.740237221341146 | 0.629881389329427 |
| 46 | 0.294966373006054 | 0.589932746012108 | 0.705033626993946 |
| 47 | 0.235357997746692 | 0.470715995493385 | 0.764642002253308 |
| 48 | 0.43077420652749 | 0.86154841305498 | 0.56922579347251 |
| Meta Analysis of Goldfeld-Quandt test for Heteroskedasticity | |||
| Description | # significant tests | % significant tests | OK/NOK |
| 1% type I error level | 0 | 0 | OK |
| 5% type I error level | 0 | 0 | OK |
| 10% type I error level | 0 | 0 | OK |