Free Statistics

of Irreproducible Research!

Author's title

Author*The author of this computation has been verified*
R Software Modulerwasp_multipleregression.wasp
Title produced by softwareMultiple Regression
Date of computationFri, 24 Dec 2010 13:28:49 +0000
Cite this page as followsStatistical Computations at FreeStatistics.org, Office for Research Development and Education, URL https://freestatistics.org/blog/index.php?v=date/2010/Dec/24/t1293197225mwanlz3njiqst8m.htm/, Retrieved Tue, 30 Apr 2024 06:20:25 +0000
Statistical Computations at FreeStatistics.org, Office for Research Development and Education, URL https://freestatistics.org/blog/index.php?pk=114921, Retrieved Tue, 30 Apr 2024 06:20:25 +0000
QR Codes:

Original text written by user:
IsPrivate?No (this computation is public)
User-defined keywords
Estimated Impact145
Family? (F = Feedback message, R = changed R code, M = changed R Module, P = changed Parameters, D = changed Data)
-     [Multiple Regression] [Q1 The Seatbeltlaw] [2007-11-14 19:27:43] [8cd6641b921d30ebe00b648d1481bba0]
- RM D  [Multiple Regression] [Seatbelt] [2009-11-12 14:10:54] [b98453cac15ba1066b407e146608df68]
-    D    [Multiple Regression] [ws 8 auitoregressie] [2010-11-29 18:31:52] [bd591a1ebb67d263a02e7adae3fa1a4d]
-   PD        [Multiple Regression] [autoregressie] [2010-12-24 13:28:49] [09489ba95453d3f5c9e6f2eaeda915af] [Current]
Feedback Forum

Post a new message
Dataseries X:
98.1	102.8	104.7	95.9	94.6
113.9	98.1	102.8	104.7	95.9
80.9	113.9	98.1	102.8	104.7
95.7	80.9	113.9	98.1	102.8
113.2	95.7	80.9	113.9	98.1
105.9	113.2	95.7	80.9	113.9
108.8	105.9	113.2	95.7	80.9
102.3	108.8	105.9	113.2	95.7
99	102.3	108.8	105.9	113.2
100.7	99	102.3	108.8	105.9
115.5	100.7	99	102.3	108.8
100.7	115.5	100.7	99	102.3
109.9	100.7	115.5	100.7	99
114.6	109.9	100.7	115.5	100.7
85.4	114.6	109.9	100.7	115.5
100.5	85.4	114.6	109.9	100.7
114.8	100.5	85.4	114.6	109.9
116.5	114.8	100.5	85.4	114.6
112.9	116.5	114.8	100.5	85.4
102	112.9	116.5	114.8	100.5
106	102	112.9	116.5	114.8
105.3	106	102	112.9	116.5
118.8	105.3	106	102	112.9
106.1	118.8	105.3	106	102
109.3	106.1	118.8	105.3	106
117.2	109.3	106.1	118.8	105.3
92.5	117.2	109.3	106.1	118.8
104.2	92.5	117.2	109.3	106.1
112.5	104.2	92.5	117.2	109.3
122.4	112.5	104.2	92.5	117.2
113.3	122.4	112.5	104.2	92.5
100	113.3	122.4	112.5	104.2
110.7	100	113.3	122.4	112.5
112.8	110.7	100	113.3	122.4
109.8	112.8	110.7	100	113.3
117.3	109.8	112.8	110.7	100
109.1	117.3	109.8	112.8	110.7
115.9	109.1	117.3	109.8	112.8
96	115.9	109.1	117.3	109.8
99.8	96	115.9	109.1	117.3
116.8	99.8	96	115.9	109.1
115.7	116.8	99.8	96	115.9
99.4	115.7	116.8	99.8	96
94.3	99.4	115.7	116.8	99.8
91	94.3	99.4	115.7	116.8
93.2	91	94.3	99.4	115.7
103.1	93.2	91	94.3	99.4
94.1	103.1	93.2	91	94.3
91.8	94.1	103.1	93.2	91
102.7	91.8	94.1	103.1	93.2
82.6	102.7	91.8	94.1	103.1
89.1	82.6	102.7	91.8	94.1
104.5	89.1	82.6	102.7	91.8
105.1	104.5	89.1	82.6	102.7
95.1	105.1	104.5	89.1	82.6
88.7	95.1	105.1	104.5	89.1
86.3	88.7	95.1	105.1	104.5
91.8	86.3	88.7	95.1	105.1
111.5	91.8	86.3	88.7	95.1
99.7	111.5	91.8	86.3	88.7
97.5	99.7	111.5	91.8	86.3
111.7	97.5	99.7	111.5	91.8
86.2	111.7	97.5	99.7	111.5
95.4	86.2	111.7	97.5	99.7


Summary of computational transaction
Raw Inputview raw input (R code)
Raw Outputview raw output of R engine
Computing time5 seconds
R Server'RServer@AstonUniversity' @ vre.aston.ac.uk

\begin{tabular}{lllllllll}
\hline
Summary of computational transaction \tabularnewline
Raw Input & view raw input (R code)  \tabularnewline
Raw Output & view raw output of R engine  \tabularnewline
Computing time & 5 seconds \tabularnewline
R Server & 'RServer@AstonUniversity' @ vre.aston.ac.uk \tabularnewline
\hline
\end{tabular}
%Source: https://freestatistics.org/blog/index.php?pk=114921&T=0

[TABLE]
[ROW][C]Summary of computational transaction[/C][/ROW]
[ROW][C]Raw Input[/C][C]view raw input (R code) [/C][/ROW]
[ROW][C]Raw Output[/C][C]view raw output of R engine [/C][/ROW]
[ROW][C]Computing time[/C][C]5 seconds[/C][/ROW]
[ROW][C]R Server[/C][C]'RServer@AstonUniversity' @ vre.aston.ac.uk[/C][/ROW]
[/TABLE]
Source: https://freestatistics.org/blog/index.php?pk=114921&T=0

Globally Unique Identifier (entire table): ba.freestatistics.org/blog/index.php?pk=114921&T=0

As an alternative you can also use a QR Code:  

The GUIDs for individual cells are displayed in the table below:

Summary of computational transaction
Raw Inputview raw input (R code)
Raw Outputview raw output of R engine
Computing time5 seconds
R Server'RServer@AstonUniversity' @ vre.aston.ac.uk


Multiple Linear Regression - Estimated Regression Equation
y[t] = + 60.5979205836162 + 0.27766008955589y1[t] -0.0968386935292209y2[t] + 0.223192273494244y3[t] + 0.00965031680418547y4[t] + e[t]

\begin{tabular}{lllllllll}
\hline
Multiple Linear Regression - Estimated Regression Equation \tabularnewline
y[t] =  +  60.5979205836162 +  0.27766008955589y1[t] -0.0968386935292209y2[t] +  0.223192273494244y3[t] +  0.00965031680418547y4[t]  + e[t] \tabularnewline
\hline
\end{tabular}
%Source: https://freestatistics.org/blog/index.php?pk=114921&T=1

[TABLE]
[ROW][C]Multiple Linear Regression - Estimated Regression Equation[/C][/ROW]
[ROW][C]y[t] =  +  60.5979205836162 +  0.27766008955589y1[t] -0.0968386935292209y2[t] +  0.223192273494244y3[t] +  0.00965031680418547y4[t]  + e[t][/C][/ROW]
[/TABLE]
Source: https://freestatistics.org/blog/index.php?pk=114921&T=1

Globally Unique Identifier (entire table): ba.freestatistics.org/blog/index.php?pk=114921&T=1

As an alternative you can also use a QR Code:  

The GUIDs for individual cells are displayed in the table below:

Multiple Linear Regression - Estimated Regression Equation
y[t] = + 60.5979205836162 + 0.27766008955589y1[t] -0.0968386935292209y2[t] + 0.223192273494244y3[t] + 0.00965031680418547y4[t] + e[t]


Multiple Linear Regression - Ordinary Least Squares
VariableParameterS.D.T-STATH0: parameter = 02-tail p-value1-tail p-value
(Intercept)60.597920583616220.8856042.90140.0052140.002607
y10.277660089555890.1301952.13260.0371250.018563
y2-0.09683869352922090.136263-0.71070.4800870.240043
y30.2231922734942440.1381481.61560.1115150.055758
y40.009650316804185470.1349560.07150.9432360.471618

\begin{tabular}{lllllllll}
\hline
Multiple Linear Regression - Ordinary Least Squares \tabularnewline
Variable & Parameter & S.D. & T-STATH0: parameter = 0 & 2-tail p-value & 1-tail p-value \tabularnewline
(Intercept) & 60.5979205836162 & 20.885604 & 2.9014 & 0.005214 & 0.002607 \tabularnewline
y1 & 0.27766008955589 & 0.130195 & 2.1326 & 0.037125 & 0.018563 \tabularnewline
y2 & -0.0968386935292209 & 0.136263 & -0.7107 & 0.480087 & 0.240043 \tabularnewline
y3 & 0.223192273494244 & 0.138148 & 1.6156 & 0.111515 & 0.055758 \tabularnewline
y4 & 0.00965031680418547 & 0.134956 & 0.0715 & 0.943236 & 0.471618 \tabularnewline
\hline
\end{tabular}
%Source: https://freestatistics.org/blog/index.php?pk=114921&T=2

[TABLE]
[ROW][C]Multiple Linear Regression - Ordinary Least Squares[/C][/ROW]
[ROW][C]Variable[/C][C]Parameter[/C][C]S.D.[/C][C]T-STATH0: parameter = 0[/C][C]2-tail p-value[/C][C]1-tail p-value[/C][/ROW]
[ROW][C](Intercept)[/C][C]60.5979205836162[/C][C]20.885604[/C][C]2.9014[/C][C]0.005214[/C][C]0.002607[/C][/ROW]
[ROW][C]y1[/C][C]0.27766008955589[/C][C]0.130195[/C][C]2.1326[/C][C]0.037125[/C][C]0.018563[/C][/ROW]
[ROW][C]y2[/C][C]-0.0968386935292209[/C][C]0.136263[/C][C]-0.7107[/C][C]0.480087[/C][C]0.240043[/C][/ROW]
[ROW][C]y3[/C][C]0.223192273494244[/C][C]0.138148[/C][C]1.6156[/C][C]0.111515[/C][C]0.055758[/C][/ROW]
[ROW][C]y4[/C][C]0.00965031680418547[/C][C]0.134956[/C][C]0.0715[/C][C]0.943236[/C][C]0.471618[/C][/ROW]
[/TABLE]
Source: https://freestatistics.org/blog/index.php?pk=114921&T=2

Globally Unique Identifier (entire table): ba.freestatistics.org/blog/index.php?pk=114921&T=2

As an alternative you can also use a QR Code:  

The GUIDs for individual cells are displayed in the table below:

Multiple Linear Regression - Ordinary Least Squares
VariableParameterS.D.T-STATH0: parameter = 02-tail p-value1-tail p-value
(Intercept)60.597920583616220.8856042.90140.0052140.002607
y10.277660089555890.1301952.13260.0371250.018563
y2-0.09683869352922090.136263-0.71070.4800870.240043
y30.2231922734942440.1381481.61560.1115150.055758
y40.009650316804185470.1349560.07150.9432360.471618


Multiple Linear Regression - Regression Statistics
Multiple R0.340153663156316
R-squared0.115704514558661
Adjusted R-squared0.0557522782575528
F-TEST (value)1.92994493112049
F-TEST (DF numerator)4
F-TEST (DF denominator)59
p-value0.117323585280604
Multiple Linear Regression - Residual Statistics
Residual Standard Deviation9.8710825815571
Sum Squared Residuals5748.85800858327

\begin{tabular}{lllllllll}
\hline
Multiple Linear Regression - Regression Statistics \tabularnewline
Multiple R & 0.340153663156316 \tabularnewline
R-squared & 0.115704514558661 \tabularnewline
Adjusted R-squared & 0.0557522782575528 \tabularnewline
F-TEST (value) & 1.92994493112049 \tabularnewline
F-TEST (DF numerator) & 4 \tabularnewline
F-TEST (DF denominator) & 59 \tabularnewline
p-value & 0.117323585280604 \tabularnewline
Multiple Linear Regression - Residual Statistics \tabularnewline
Residual Standard Deviation & 9.8710825815571 \tabularnewline
Sum Squared Residuals & 5748.85800858327 \tabularnewline
\hline
\end{tabular}
%Source: https://freestatistics.org/blog/index.php?pk=114921&T=3

[TABLE]
[ROW][C]Multiple Linear Regression - Regression Statistics[/C][/ROW]
[ROW][C]Multiple R[/C][C]0.340153663156316[/C][/ROW]
[ROW][C]R-squared[/C][C]0.115704514558661[/C][/ROW]
[ROW][C]Adjusted R-squared[/C][C]0.0557522782575528[/C][/ROW]
[ROW][C]F-TEST (value)[/C][C]1.92994493112049[/C][/ROW]
[ROW][C]F-TEST (DF numerator)[/C][C]4[/C][/ROW]
[ROW][C]F-TEST (DF denominator)[/C][C]59[/C][/ROW]
[ROW][C]p-value[/C][C]0.117323585280604[/C][/ROW]
[ROW][C]Multiple Linear Regression - Residual Statistics[/C][/ROW]
[ROW][C]Residual Standard Deviation[/C][C]9.8710825815571[/C][/ROW]
[ROW][C]Sum Squared Residuals[/C][C]5748.85800858327[/C][/ROW]
[/TABLE]
Source: https://freestatistics.org/blog/index.php?pk=114921&T=3

Globally Unique Identifier (entire table): ba.freestatistics.org/blog/index.php?pk=114921&T=3

As an alternative you can also use a QR Code:  

The GUIDs for individual cells are displayed in the table below:

Multiple Linear Regression - Regression Statistics
Multiple R0.340153663156316
R-squared0.115704514558661
Adjusted R-squared0.0557522782575528
F-TEST (value)1.92994493112049
F-TEST (DF numerator)4
F-TEST (DF denominator)59
p-value0.117323585280604
Multiple Linear Regression - Residual Statistics
Residual Standard Deviation9.8710825815571
Sum Squared Residuals5748.85800858327


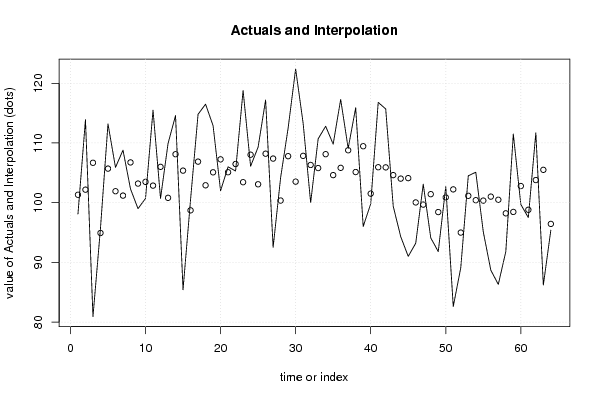
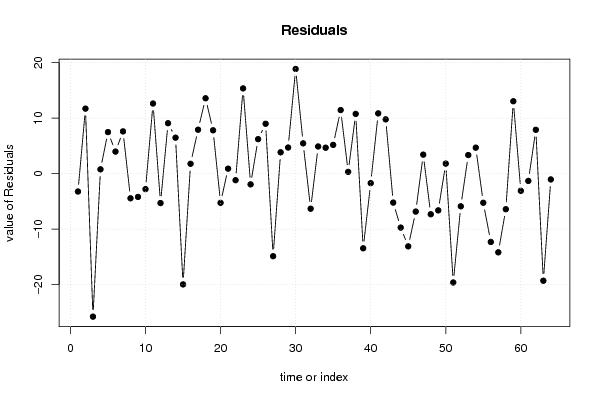
Multiple Linear Regression - Actuals, Interpolation, and Residuals
Time or IndexActualsInterpolationForecastResidualsPrediction Error
198.1101.319425575226-3.21942557522621
2113.9102.17505409061411.7249459093861
380.9106.678082833422-25.778082833422
495.794.9179092329650.78209076703493
5113.2105.7040368770867.49596312291408
6105.9101.9170057602783.9829942397224
7108.8101.1801951629357.61980483706507
8102.3106.741021360262-4.44102136026155
999103.194975514479-4.19497551447878
10100.7103.484959007347-2.78495900734703
11115.5102.85378498925812.646215010742
12100.7105.999266973927-5.29926697392731
13109.9100.8042658037549.09573419624593
14114.6108.1116024781836.48839752181733
1585.4105.365267959614-19.9652679596136
16100.598.71299571243941.78700428756058
17114.8106.8711395158087.92886048419194
18116.5102.90755662711413.5924433728862
19112.9105.0831995409727.81680045902818
20102107.256366734282-5.25636673428184
21106105.0959174500680.904082549932102
22105.3106.475012921748-1.17501292174781
23118.8103.42575916335915.3742408366405
24106.1108.029538098646-1.9295380986458
25109.3103.0782992744126.22170072558772
26117.2108.2030034392228.9969965607784
2792.5107.382371730899-14.8823717308992
28104.2100.3507980917563.84920190824368
29112.5107.785436844114.71456315589008
30122.4103.52039122057718.8796087794229
31113.3107.8384517257075.46154827429279
32100106.318446421421-6.31844642142051
33110.7105.7965004785114.90349952148915
34112.8108.1199065082614.68009349173868
35109.8104.6105435551745.18945644482551
36117.3105.83401014298811.4659898570118
37109.1108.7789390593880.321060940612258
38115.9105.12652496836610.7734750316337
3996109.45368196508-13.4536819650803
4099.8101.511943800298-1.71194380029795
41116.8105.93271700380810.8672829961916
42115.7105.909047402589.79095259741955
4399.4104.613452848947-5.21345284894706
4494.3104.025055805326-9.72505580532626
4591104.106003937945-13.106003937945
4693.2100.034953572969-6.8349535729688
47103.199.66979269990933.43020730009068
4894.1101.419831342516-7.319831342516
4991.898.4213644268072-6.62136442680722
50102.7100.8851286671541.81487133284612
5182.6102.221160313344-19.6211603133435
5289.194.9844556735272-5.88445567352721
53104.5101.1463040480153.35369595198453
54105.1100.4118416751684.68815832483245
5595.1100.3439002585-5.24390025849954
5688.7101.009084217862-12.3090842178617
5786.3100.482976822877-14.1829768228772
5891.898.2102277016701-6.41022770167014
59111.598.444837340292713.0551626597074
6099.7102.7847048062-3.08470480619999
6197.598.8049902308031-1.30499023080314
62111.7103.7867991476857.91320085231538
6386.2105.499059958953-19.2990599589529
6495.496.438721487186-1.03872148718605

\begin{tabular}{lllllllll}
\hline
Multiple Linear Regression - Actuals, Interpolation, and Residuals \tabularnewline
Time or Index & Actuals & InterpolationForecast & ResidualsPrediction Error \tabularnewline
1 & 98.1 & 101.319425575226 & -3.21942557522621 \tabularnewline
2 & 113.9 & 102.175054090614 & 11.7249459093861 \tabularnewline
3 & 80.9 & 106.678082833422 & -25.778082833422 \tabularnewline
4 & 95.7 & 94.917909232965 & 0.78209076703493 \tabularnewline
5 & 113.2 & 105.704036877086 & 7.49596312291408 \tabularnewline
6 & 105.9 & 101.917005760278 & 3.9829942397224 \tabularnewline
7 & 108.8 & 101.180195162935 & 7.61980483706507 \tabularnewline
8 & 102.3 & 106.741021360262 & -4.44102136026155 \tabularnewline
9 & 99 & 103.194975514479 & -4.19497551447878 \tabularnewline
10 & 100.7 & 103.484959007347 & -2.78495900734703 \tabularnewline
11 & 115.5 & 102.853784989258 & 12.646215010742 \tabularnewline
12 & 100.7 & 105.999266973927 & -5.29926697392731 \tabularnewline
13 & 109.9 & 100.804265803754 & 9.09573419624593 \tabularnewline
14 & 114.6 & 108.111602478183 & 6.48839752181733 \tabularnewline
15 & 85.4 & 105.365267959614 & -19.9652679596136 \tabularnewline
16 & 100.5 & 98.7129957124394 & 1.78700428756058 \tabularnewline
17 & 114.8 & 106.871139515808 & 7.92886048419194 \tabularnewline
18 & 116.5 & 102.907556627114 & 13.5924433728862 \tabularnewline
19 & 112.9 & 105.083199540972 & 7.81680045902818 \tabularnewline
20 & 102 & 107.256366734282 & -5.25636673428184 \tabularnewline
21 & 106 & 105.095917450068 & 0.904082549932102 \tabularnewline
22 & 105.3 & 106.475012921748 & -1.17501292174781 \tabularnewline
23 & 118.8 & 103.425759163359 & 15.3742408366405 \tabularnewline
24 & 106.1 & 108.029538098646 & -1.9295380986458 \tabularnewline
25 & 109.3 & 103.078299274412 & 6.22170072558772 \tabularnewline
26 & 117.2 & 108.203003439222 & 8.9969965607784 \tabularnewline
27 & 92.5 & 107.382371730899 & -14.8823717308992 \tabularnewline
28 & 104.2 & 100.350798091756 & 3.84920190824368 \tabularnewline
29 & 112.5 & 107.78543684411 & 4.71456315589008 \tabularnewline
30 & 122.4 & 103.520391220577 & 18.8796087794229 \tabularnewline
31 & 113.3 & 107.838451725707 & 5.46154827429279 \tabularnewline
32 & 100 & 106.318446421421 & -6.31844642142051 \tabularnewline
33 & 110.7 & 105.796500478511 & 4.90349952148915 \tabularnewline
34 & 112.8 & 108.119906508261 & 4.68009349173868 \tabularnewline
35 & 109.8 & 104.610543555174 & 5.18945644482551 \tabularnewline
36 & 117.3 & 105.834010142988 & 11.4659898570118 \tabularnewline
37 & 109.1 & 108.778939059388 & 0.321060940612258 \tabularnewline
38 & 115.9 & 105.126524968366 & 10.7734750316337 \tabularnewline
39 & 96 & 109.45368196508 & -13.4536819650803 \tabularnewline
40 & 99.8 & 101.511943800298 & -1.71194380029795 \tabularnewline
41 & 116.8 & 105.932717003808 & 10.8672829961916 \tabularnewline
42 & 115.7 & 105.90904740258 & 9.79095259741955 \tabularnewline
43 & 99.4 & 104.613452848947 & -5.21345284894706 \tabularnewline
44 & 94.3 & 104.025055805326 & -9.72505580532626 \tabularnewline
45 & 91 & 104.106003937945 & -13.106003937945 \tabularnewline
46 & 93.2 & 100.034953572969 & -6.8349535729688 \tabularnewline
47 & 103.1 & 99.6697926999093 & 3.43020730009068 \tabularnewline
48 & 94.1 & 101.419831342516 & -7.319831342516 \tabularnewline
49 & 91.8 & 98.4213644268072 & -6.62136442680722 \tabularnewline
50 & 102.7 & 100.885128667154 & 1.81487133284612 \tabularnewline
51 & 82.6 & 102.221160313344 & -19.6211603133435 \tabularnewline
52 & 89.1 & 94.9844556735272 & -5.88445567352721 \tabularnewline
53 & 104.5 & 101.146304048015 & 3.35369595198453 \tabularnewline
54 & 105.1 & 100.411841675168 & 4.68815832483245 \tabularnewline
55 & 95.1 & 100.3439002585 & -5.24390025849954 \tabularnewline
56 & 88.7 & 101.009084217862 & -12.3090842178617 \tabularnewline
57 & 86.3 & 100.482976822877 & -14.1829768228772 \tabularnewline
58 & 91.8 & 98.2102277016701 & -6.41022770167014 \tabularnewline
59 & 111.5 & 98.4448373402927 & 13.0551626597074 \tabularnewline
60 & 99.7 & 102.7847048062 & -3.08470480619999 \tabularnewline
61 & 97.5 & 98.8049902308031 & -1.30499023080314 \tabularnewline
62 & 111.7 & 103.786799147685 & 7.91320085231538 \tabularnewline
63 & 86.2 & 105.499059958953 & -19.2990599589529 \tabularnewline
64 & 95.4 & 96.438721487186 & -1.03872148718605 \tabularnewline
\hline
\end{tabular}
%Source: https://freestatistics.org/blog/index.php?pk=114921&T=4

[TABLE]
[ROW][C]Multiple Linear Regression - Actuals, Interpolation, and Residuals[/C][/ROW]
[ROW][C]Time or Index[/C][C]Actuals[/C][C]InterpolationForecast[/C][C]ResidualsPrediction Error[/C][/ROW]
[ROW][C]1[/C][C]98.1[/C][C]101.319425575226[/C][C]-3.21942557522621[/C][/ROW]
[ROW][C]2[/C][C]113.9[/C][C]102.175054090614[/C][C]11.7249459093861[/C][/ROW]
[ROW][C]3[/C][C]80.9[/C][C]106.678082833422[/C][C]-25.778082833422[/C][/ROW]
[ROW][C]4[/C][C]95.7[/C][C]94.917909232965[/C][C]0.78209076703493[/C][/ROW]
[ROW][C]5[/C][C]113.2[/C][C]105.704036877086[/C][C]7.49596312291408[/C][/ROW]
[ROW][C]6[/C][C]105.9[/C][C]101.917005760278[/C][C]3.9829942397224[/C][/ROW]
[ROW][C]7[/C][C]108.8[/C][C]101.180195162935[/C][C]7.61980483706507[/C][/ROW]
[ROW][C]8[/C][C]102.3[/C][C]106.741021360262[/C][C]-4.44102136026155[/C][/ROW]
[ROW][C]9[/C][C]99[/C][C]103.194975514479[/C][C]-4.19497551447878[/C][/ROW]
[ROW][C]10[/C][C]100.7[/C][C]103.484959007347[/C][C]-2.78495900734703[/C][/ROW]
[ROW][C]11[/C][C]115.5[/C][C]102.853784989258[/C][C]12.646215010742[/C][/ROW]
[ROW][C]12[/C][C]100.7[/C][C]105.999266973927[/C][C]-5.29926697392731[/C][/ROW]
[ROW][C]13[/C][C]109.9[/C][C]100.804265803754[/C][C]9.09573419624593[/C][/ROW]
[ROW][C]14[/C][C]114.6[/C][C]108.111602478183[/C][C]6.48839752181733[/C][/ROW]
[ROW][C]15[/C][C]85.4[/C][C]105.365267959614[/C][C]-19.9652679596136[/C][/ROW]
[ROW][C]16[/C][C]100.5[/C][C]98.7129957124394[/C][C]1.78700428756058[/C][/ROW]
[ROW][C]17[/C][C]114.8[/C][C]106.871139515808[/C][C]7.92886048419194[/C][/ROW]
[ROW][C]18[/C][C]116.5[/C][C]102.907556627114[/C][C]13.5924433728862[/C][/ROW]
[ROW][C]19[/C][C]112.9[/C][C]105.083199540972[/C][C]7.81680045902818[/C][/ROW]
[ROW][C]20[/C][C]102[/C][C]107.256366734282[/C][C]-5.25636673428184[/C][/ROW]
[ROW][C]21[/C][C]106[/C][C]105.095917450068[/C][C]0.904082549932102[/C][/ROW]
[ROW][C]22[/C][C]105.3[/C][C]106.475012921748[/C][C]-1.17501292174781[/C][/ROW]
[ROW][C]23[/C][C]118.8[/C][C]103.425759163359[/C][C]15.3742408366405[/C][/ROW]
[ROW][C]24[/C][C]106.1[/C][C]108.029538098646[/C][C]-1.9295380986458[/C][/ROW]
[ROW][C]25[/C][C]109.3[/C][C]103.078299274412[/C][C]6.22170072558772[/C][/ROW]
[ROW][C]26[/C][C]117.2[/C][C]108.203003439222[/C][C]8.9969965607784[/C][/ROW]
[ROW][C]27[/C][C]92.5[/C][C]107.382371730899[/C][C]-14.8823717308992[/C][/ROW]
[ROW][C]28[/C][C]104.2[/C][C]100.350798091756[/C][C]3.84920190824368[/C][/ROW]
[ROW][C]29[/C][C]112.5[/C][C]107.78543684411[/C][C]4.71456315589008[/C][/ROW]
[ROW][C]30[/C][C]122.4[/C][C]103.520391220577[/C][C]18.8796087794229[/C][/ROW]
[ROW][C]31[/C][C]113.3[/C][C]107.838451725707[/C][C]5.46154827429279[/C][/ROW]
[ROW][C]32[/C][C]100[/C][C]106.318446421421[/C][C]-6.31844642142051[/C][/ROW]
[ROW][C]33[/C][C]110.7[/C][C]105.796500478511[/C][C]4.90349952148915[/C][/ROW]
[ROW][C]34[/C][C]112.8[/C][C]108.119906508261[/C][C]4.68009349173868[/C][/ROW]
[ROW][C]35[/C][C]109.8[/C][C]104.610543555174[/C][C]5.18945644482551[/C][/ROW]
[ROW][C]36[/C][C]117.3[/C][C]105.834010142988[/C][C]11.4659898570118[/C][/ROW]
[ROW][C]37[/C][C]109.1[/C][C]108.778939059388[/C][C]0.321060940612258[/C][/ROW]
[ROW][C]38[/C][C]115.9[/C][C]105.126524968366[/C][C]10.7734750316337[/C][/ROW]
[ROW][C]39[/C][C]96[/C][C]109.45368196508[/C][C]-13.4536819650803[/C][/ROW]
[ROW][C]40[/C][C]99.8[/C][C]101.511943800298[/C][C]-1.71194380029795[/C][/ROW]
[ROW][C]41[/C][C]116.8[/C][C]105.932717003808[/C][C]10.8672829961916[/C][/ROW]
[ROW][C]42[/C][C]115.7[/C][C]105.90904740258[/C][C]9.79095259741955[/C][/ROW]
[ROW][C]43[/C][C]99.4[/C][C]104.613452848947[/C][C]-5.21345284894706[/C][/ROW]
[ROW][C]44[/C][C]94.3[/C][C]104.025055805326[/C][C]-9.72505580532626[/C][/ROW]
[ROW][C]45[/C][C]91[/C][C]104.106003937945[/C][C]-13.106003937945[/C][/ROW]
[ROW][C]46[/C][C]93.2[/C][C]100.034953572969[/C][C]-6.8349535729688[/C][/ROW]
[ROW][C]47[/C][C]103.1[/C][C]99.6697926999093[/C][C]3.43020730009068[/C][/ROW]
[ROW][C]48[/C][C]94.1[/C][C]101.419831342516[/C][C]-7.319831342516[/C][/ROW]
[ROW][C]49[/C][C]91.8[/C][C]98.4213644268072[/C][C]-6.62136442680722[/C][/ROW]
[ROW][C]50[/C][C]102.7[/C][C]100.885128667154[/C][C]1.81487133284612[/C][/ROW]
[ROW][C]51[/C][C]82.6[/C][C]102.221160313344[/C][C]-19.6211603133435[/C][/ROW]
[ROW][C]52[/C][C]89.1[/C][C]94.9844556735272[/C][C]-5.88445567352721[/C][/ROW]
[ROW][C]53[/C][C]104.5[/C][C]101.146304048015[/C][C]3.35369595198453[/C][/ROW]
[ROW][C]54[/C][C]105.1[/C][C]100.411841675168[/C][C]4.68815832483245[/C][/ROW]
[ROW][C]55[/C][C]95.1[/C][C]100.3439002585[/C][C]-5.24390025849954[/C][/ROW]
[ROW][C]56[/C][C]88.7[/C][C]101.009084217862[/C][C]-12.3090842178617[/C][/ROW]
[ROW][C]57[/C][C]86.3[/C][C]100.482976822877[/C][C]-14.1829768228772[/C][/ROW]
[ROW][C]58[/C][C]91.8[/C][C]98.2102277016701[/C][C]-6.41022770167014[/C][/ROW]
[ROW][C]59[/C][C]111.5[/C][C]98.4448373402927[/C][C]13.0551626597074[/C][/ROW]
[ROW][C]60[/C][C]99.7[/C][C]102.7847048062[/C][C]-3.08470480619999[/C][/ROW]
[ROW][C]61[/C][C]97.5[/C][C]98.8049902308031[/C][C]-1.30499023080314[/C][/ROW]
[ROW][C]62[/C][C]111.7[/C][C]103.786799147685[/C][C]7.91320085231538[/C][/ROW]
[ROW][C]63[/C][C]86.2[/C][C]105.499059958953[/C][C]-19.2990599589529[/C][/ROW]
[ROW][C]64[/C][C]95.4[/C][C]96.438721487186[/C][C]-1.03872148718605[/C][/ROW]
[/TABLE]
Source: https://freestatistics.org/blog/index.php?pk=114921&T=4

Globally Unique Identifier (entire table): ba.freestatistics.org/blog/index.php?pk=114921&T=4

As an alternative you can also use a QR Code:  

The GUIDs for individual cells are displayed in the table below:

Multiple Linear Regression - Actuals, Interpolation, and Residuals
Time or IndexActualsInterpolationForecastResidualsPrediction Error
198.1101.319425575226-3.21942557522621
2113.9102.17505409061411.7249459093861
380.9106.678082833422-25.778082833422
495.794.9179092329650.78209076703493
5113.2105.7040368770867.49596312291408
6105.9101.9170057602783.9829942397224
7108.8101.1801951629357.61980483706507
8102.3106.741021360262-4.44102136026155
999103.194975514479-4.19497551447878
10100.7103.484959007347-2.78495900734703
11115.5102.85378498925812.646215010742
12100.7105.999266973927-5.29926697392731
13109.9100.8042658037549.09573419624593
14114.6108.1116024781836.48839752181733
1585.4105.365267959614-19.9652679596136
16100.598.71299571243941.78700428756058
17114.8106.8711395158087.92886048419194
18116.5102.90755662711413.5924433728862
19112.9105.0831995409727.81680045902818
20102107.256366734282-5.25636673428184
21106105.0959174500680.904082549932102
22105.3106.475012921748-1.17501292174781
23118.8103.42575916335915.3742408366405
24106.1108.029538098646-1.9295380986458
25109.3103.0782992744126.22170072558772
26117.2108.2030034392228.9969965607784
2792.5107.382371730899-14.8823717308992
28104.2100.3507980917563.84920190824368
29112.5107.785436844114.71456315589008
30122.4103.52039122057718.8796087794229
31113.3107.8384517257075.46154827429279
32100106.318446421421-6.31844642142051
33110.7105.7965004785114.90349952148915
34112.8108.1199065082614.68009349173868
35109.8104.6105435551745.18945644482551
36117.3105.83401014298811.4659898570118
37109.1108.7789390593880.321060940612258
38115.9105.12652496836610.7734750316337
3996109.45368196508-13.4536819650803
4099.8101.511943800298-1.71194380029795
41116.8105.93271700380810.8672829961916
42115.7105.909047402589.79095259741955
4399.4104.613452848947-5.21345284894706
4494.3104.025055805326-9.72505580532626
4591104.106003937945-13.106003937945
4693.2100.034953572969-6.8349535729688
47103.199.66979269990933.43020730009068
4894.1101.419831342516-7.319831342516
4991.898.4213644268072-6.62136442680722
50102.7100.8851286671541.81487133284612
5182.6102.221160313344-19.6211603133435
5289.194.9844556735272-5.88445567352721
53104.5101.1463040480153.35369595198453
54105.1100.4118416751684.68815832483245
5595.1100.3439002585-5.24390025849954
5688.7101.009084217862-12.3090842178617
5786.3100.482976822877-14.1829768228772
5891.898.2102277016701-6.41022770167014
59111.598.444837340292713.0551626597074
6099.7102.7847048062-3.08470480619999
6197.598.8049902308031-1.30499023080314
62111.7103.7867991476857.91320085231538
6386.2105.499059958953-19.2990599589529
6495.496.438721487186-1.03872148718605


Goldfeld-Quandt test for Heteroskedasticity
p-valuesAlternative Hypothesis
breakpoint indexgreater2-sidedless
80.829914805195940.340170389608120.17008519480406
90.7980404429839340.4039191140321310.201959557016066
100.6869967231930650.6260065536138690.313003276806935
110.7578005650838790.4843988698322420.242199434916121
120.6612943325907110.6774113348185780.338705667409289
130.6540172505093730.6919654989812530.345982749490627
140.6633095004359140.6733809991281720.336690499564086
150.7051270699480460.5897458601039080.294872930051954
160.6280531238465230.7438937523069540.371946876153477
170.5752312698556980.8495374602886050.424768730144302
180.6965387052075610.6069225895848780.303461294792439
190.6834852452468390.6330295095063230.316514754753162
200.6181175508394150.763764898321170.381882449160585
210.5793534739459140.8412930521081730.420646526054086
220.5024398885241760.9951202229516470.497560111475824
230.6270073837676450.745985232464710.372992616232355
240.5501704681706040.8996590636587930.449829531829396
250.5159112935033910.9681774129932190.484088706496609
260.5223645131996220.9552709736007550.477635486800378
270.5733126749487860.8533746501024280.426687325051214
280.510195383666590.979609232666820.48980461633341
290.4467127306129080.8934254612258150.553287269387092
300.6454124244083680.7091751511832630.354587575591632
310.6030700584994360.7938598830011280.396929941500564
320.5395235045118140.9209529909763730.460476495488186
330.4975065069199470.9950130138398950.502493493080053
340.4486620317428910.8973240634857810.55133796825711
350.4048315242364070.8096630484728140.595168475763593
360.4632408699275060.9264817398550120.536759130072494
370.3963171192243670.7926342384487340.603682880775633
380.5173244545965690.9653510908068610.482675545403431
390.5080107686070090.9839784627859830.491989231392991
400.4691969845446060.9383939690892130.530803015455394
410.5709774163735080.8580451672529830.429022583626492
420.8133168204880180.3733663590239640.186683179511982
430.8089815175044650.382036964991070.191018482495535
440.7833602959355480.4332794081289040.216639704064452
450.7710710969885740.4578578060228510.228928903011426
460.7475405914910660.5049188170178670.252459408508934
470.699007463525730.601985072948540.30099253647427
480.6570659600557830.6858680798884340.342934039944217
490.5997674570166620.8004650859666770.400232542983338
500.5044079320551550.991184135889690.495592067944845
510.6346663073387150.730667385322570.365333692661285
520.581682824397320.836634351205360.41831717560268
530.4653304905467690.9306609810935380.534669509453231
540.4271235445145920.8542470890291850.572876455485408
550.3380769575622470.6761539151244930.661923042437753
560.4692556934207740.9385113868415480.530744306579226

\begin{tabular}{lllllllll}
\hline
Goldfeld-Quandt test for Heteroskedasticity \tabularnewline
p-values & Alternative Hypothesis \tabularnewline
breakpoint index & greater & 2-sided & less \tabularnewline
8 & 0.82991480519594 & 0.34017038960812 & 0.17008519480406 \tabularnewline
9 & 0.798040442983934 & 0.403919114032131 & 0.201959557016066 \tabularnewline
10 & 0.686996723193065 & 0.626006553613869 & 0.313003276806935 \tabularnewline
11 & 0.757800565083879 & 0.484398869832242 & 0.242199434916121 \tabularnewline
12 & 0.661294332590711 & 0.677411334818578 & 0.338705667409289 \tabularnewline
13 & 0.654017250509373 & 0.691965498981253 & 0.345982749490627 \tabularnewline
14 & 0.663309500435914 & 0.673380999128172 & 0.336690499564086 \tabularnewline
15 & 0.705127069948046 & 0.589745860103908 & 0.294872930051954 \tabularnewline
16 & 0.628053123846523 & 0.743893752306954 & 0.371946876153477 \tabularnewline
17 & 0.575231269855698 & 0.849537460288605 & 0.424768730144302 \tabularnewline
18 & 0.696538705207561 & 0.606922589584878 & 0.303461294792439 \tabularnewline
19 & 0.683485245246839 & 0.633029509506323 & 0.316514754753162 \tabularnewline
20 & 0.618117550839415 & 0.76376489832117 & 0.381882449160585 \tabularnewline
21 & 0.579353473945914 & 0.841293052108173 & 0.420646526054086 \tabularnewline
22 & 0.502439888524176 & 0.995120222951647 & 0.497560111475824 \tabularnewline
23 & 0.627007383767645 & 0.74598523246471 & 0.372992616232355 \tabularnewline
24 & 0.550170468170604 & 0.899659063658793 & 0.449829531829396 \tabularnewline
25 & 0.515911293503391 & 0.968177412993219 & 0.484088706496609 \tabularnewline
26 & 0.522364513199622 & 0.955270973600755 & 0.477635486800378 \tabularnewline
27 & 0.573312674948786 & 0.853374650102428 & 0.426687325051214 \tabularnewline
28 & 0.51019538366659 & 0.97960923266682 & 0.48980461633341 \tabularnewline
29 & 0.446712730612908 & 0.893425461225815 & 0.553287269387092 \tabularnewline
30 & 0.645412424408368 & 0.709175151183263 & 0.354587575591632 \tabularnewline
31 & 0.603070058499436 & 0.793859883001128 & 0.396929941500564 \tabularnewline
32 & 0.539523504511814 & 0.920952990976373 & 0.460476495488186 \tabularnewline
33 & 0.497506506919947 & 0.995013013839895 & 0.502493493080053 \tabularnewline
34 & 0.448662031742891 & 0.897324063485781 & 0.55133796825711 \tabularnewline
35 & 0.404831524236407 & 0.809663048472814 & 0.595168475763593 \tabularnewline
36 & 0.463240869927506 & 0.926481739855012 & 0.536759130072494 \tabularnewline
37 & 0.396317119224367 & 0.792634238448734 & 0.603682880775633 \tabularnewline
38 & 0.517324454596569 & 0.965351090806861 & 0.482675545403431 \tabularnewline
39 & 0.508010768607009 & 0.983978462785983 & 0.491989231392991 \tabularnewline
40 & 0.469196984544606 & 0.938393969089213 & 0.530803015455394 \tabularnewline
41 & 0.570977416373508 & 0.858045167252983 & 0.429022583626492 \tabularnewline
42 & 0.813316820488018 & 0.373366359023964 & 0.186683179511982 \tabularnewline
43 & 0.808981517504465 & 0.38203696499107 & 0.191018482495535 \tabularnewline
44 & 0.783360295935548 & 0.433279408128904 & 0.216639704064452 \tabularnewline
45 & 0.771071096988574 & 0.457857806022851 & 0.228928903011426 \tabularnewline
46 & 0.747540591491066 & 0.504918817017867 & 0.252459408508934 \tabularnewline
47 & 0.69900746352573 & 0.60198507294854 & 0.30099253647427 \tabularnewline
48 & 0.657065960055783 & 0.685868079888434 & 0.342934039944217 \tabularnewline
49 & 0.599767457016662 & 0.800465085966677 & 0.400232542983338 \tabularnewline
50 & 0.504407932055155 & 0.99118413588969 & 0.495592067944845 \tabularnewline
51 & 0.634666307338715 & 0.73066738532257 & 0.365333692661285 \tabularnewline
52 & 0.58168282439732 & 0.83663435120536 & 0.41831717560268 \tabularnewline
53 & 0.465330490546769 & 0.930660981093538 & 0.534669509453231 \tabularnewline
54 & 0.427123544514592 & 0.854247089029185 & 0.572876455485408 \tabularnewline
55 & 0.338076957562247 & 0.676153915124493 & 0.661923042437753 \tabularnewline
56 & 0.469255693420774 & 0.938511386841548 & 0.530744306579226 \tabularnewline
\hline
\end{tabular}
%Source: https://freestatistics.org/blog/index.php?pk=114921&T=5

[TABLE]
[ROW][C]Goldfeld-Quandt test for Heteroskedasticity[/C][/ROW]
[ROW][C]p-values[/C][C]Alternative Hypothesis[/C][/ROW]
[ROW][C]breakpoint index[/C][C]greater[/C][C]2-sided[/C][C]less[/C][/ROW]
[ROW][C]8[/C][C]0.82991480519594[/C][C]0.34017038960812[/C][C]0.17008519480406[/C][/ROW]
[ROW][C]9[/C][C]0.798040442983934[/C][C]0.403919114032131[/C][C]0.201959557016066[/C][/ROW]
[ROW][C]10[/C][C]0.686996723193065[/C][C]0.626006553613869[/C][C]0.313003276806935[/C][/ROW]
[ROW][C]11[/C][C]0.757800565083879[/C][C]0.484398869832242[/C][C]0.242199434916121[/C][/ROW]
[ROW][C]12[/C][C]0.661294332590711[/C][C]0.677411334818578[/C][C]0.338705667409289[/C][/ROW]
[ROW][C]13[/C][C]0.654017250509373[/C][C]0.691965498981253[/C][C]0.345982749490627[/C][/ROW]
[ROW][C]14[/C][C]0.663309500435914[/C][C]0.673380999128172[/C][C]0.336690499564086[/C][/ROW]
[ROW][C]15[/C][C]0.705127069948046[/C][C]0.589745860103908[/C][C]0.294872930051954[/C][/ROW]
[ROW][C]16[/C][C]0.628053123846523[/C][C]0.743893752306954[/C][C]0.371946876153477[/C][/ROW]
[ROW][C]17[/C][C]0.575231269855698[/C][C]0.849537460288605[/C][C]0.424768730144302[/C][/ROW]
[ROW][C]18[/C][C]0.696538705207561[/C][C]0.606922589584878[/C][C]0.303461294792439[/C][/ROW]
[ROW][C]19[/C][C]0.683485245246839[/C][C]0.633029509506323[/C][C]0.316514754753162[/C][/ROW]
[ROW][C]20[/C][C]0.618117550839415[/C][C]0.76376489832117[/C][C]0.381882449160585[/C][/ROW]
[ROW][C]21[/C][C]0.579353473945914[/C][C]0.841293052108173[/C][C]0.420646526054086[/C][/ROW]
[ROW][C]22[/C][C]0.502439888524176[/C][C]0.995120222951647[/C][C]0.497560111475824[/C][/ROW]
[ROW][C]23[/C][C]0.627007383767645[/C][C]0.74598523246471[/C][C]0.372992616232355[/C][/ROW]
[ROW][C]24[/C][C]0.550170468170604[/C][C]0.899659063658793[/C][C]0.449829531829396[/C][/ROW]
[ROW][C]25[/C][C]0.515911293503391[/C][C]0.968177412993219[/C][C]0.484088706496609[/C][/ROW]
[ROW][C]26[/C][C]0.522364513199622[/C][C]0.955270973600755[/C][C]0.477635486800378[/C][/ROW]
[ROW][C]27[/C][C]0.573312674948786[/C][C]0.853374650102428[/C][C]0.426687325051214[/C][/ROW]
[ROW][C]28[/C][C]0.51019538366659[/C][C]0.97960923266682[/C][C]0.48980461633341[/C][/ROW]
[ROW][C]29[/C][C]0.446712730612908[/C][C]0.893425461225815[/C][C]0.553287269387092[/C][/ROW]
[ROW][C]30[/C][C]0.645412424408368[/C][C]0.709175151183263[/C][C]0.354587575591632[/C][/ROW]
[ROW][C]31[/C][C]0.603070058499436[/C][C]0.793859883001128[/C][C]0.396929941500564[/C][/ROW]
[ROW][C]32[/C][C]0.539523504511814[/C][C]0.920952990976373[/C][C]0.460476495488186[/C][/ROW]
[ROW][C]33[/C][C]0.497506506919947[/C][C]0.995013013839895[/C][C]0.502493493080053[/C][/ROW]
[ROW][C]34[/C][C]0.448662031742891[/C][C]0.897324063485781[/C][C]0.55133796825711[/C][/ROW]
[ROW][C]35[/C][C]0.404831524236407[/C][C]0.809663048472814[/C][C]0.595168475763593[/C][/ROW]
[ROW][C]36[/C][C]0.463240869927506[/C][C]0.926481739855012[/C][C]0.536759130072494[/C][/ROW]
[ROW][C]37[/C][C]0.396317119224367[/C][C]0.792634238448734[/C][C]0.603682880775633[/C][/ROW]
[ROW][C]38[/C][C]0.517324454596569[/C][C]0.965351090806861[/C][C]0.482675545403431[/C][/ROW]
[ROW][C]39[/C][C]0.508010768607009[/C][C]0.983978462785983[/C][C]0.491989231392991[/C][/ROW]
[ROW][C]40[/C][C]0.469196984544606[/C][C]0.938393969089213[/C][C]0.530803015455394[/C][/ROW]
[ROW][C]41[/C][C]0.570977416373508[/C][C]0.858045167252983[/C][C]0.429022583626492[/C][/ROW]
[ROW][C]42[/C][C]0.813316820488018[/C][C]0.373366359023964[/C][C]0.186683179511982[/C][/ROW]
[ROW][C]43[/C][C]0.808981517504465[/C][C]0.38203696499107[/C][C]0.191018482495535[/C][/ROW]
[ROW][C]44[/C][C]0.783360295935548[/C][C]0.433279408128904[/C][C]0.216639704064452[/C][/ROW]
[ROW][C]45[/C][C]0.771071096988574[/C][C]0.457857806022851[/C][C]0.228928903011426[/C][/ROW]
[ROW][C]46[/C][C]0.747540591491066[/C][C]0.504918817017867[/C][C]0.252459408508934[/C][/ROW]
[ROW][C]47[/C][C]0.69900746352573[/C][C]0.60198507294854[/C][C]0.30099253647427[/C][/ROW]
[ROW][C]48[/C][C]0.657065960055783[/C][C]0.685868079888434[/C][C]0.342934039944217[/C][/ROW]
[ROW][C]49[/C][C]0.599767457016662[/C][C]0.800465085966677[/C][C]0.400232542983338[/C][/ROW]
[ROW][C]50[/C][C]0.504407932055155[/C][C]0.99118413588969[/C][C]0.495592067944845[/C][/ROW]
[ROW][C]51[/C][C]0.634666307338715[/C][C]0.73066738532257[/C][C]0.365333692661285[/C][/ROW]
[ROW][C]52[/C][C]0.58168282439732[/C][C]0.83663435120536[/C][C]0.41831717560268[/C][/ROW]
[ROW][C]53[/C][C]0.465330490546769[/C][C]0.930660981093538[/C][C]0.534669509453231[/C][/ROW]
[ROW][C]54[/C][C]0.427123544514592[/C][C]0.854247089029185[/C][C]0.572876455485408[/C][/ROW]
[ROW][C]55[/C][C]0.338076957562247[/C][C]0.676153915124493[/C][C]0.661923042437753[/C][/ROW]
[ROW][C]56[/C][C]0.469255693420774[/C][C]0.938511386841548[/C][C]0.530744306579226[/C][/ROW]
[/TABLE]
Source: https://freestatistics.org/blog/index.php?pk=114921&T=5

Globally Unique Identifier (entire table): ba.freestatistics.org/blog/index.php?pk=114921&T=5

As an alternative you can also use a QR Code:  

The GUIDs for individual cells are displayed in the table below:

Goldfeld-Quandt test for Heteroskedasticity
p-valuesAlternative Hypothesis
breakpoint indexgreater2-sidedless
80.829914805195940.340170389608120.17008519480406
90.7980404429839340.4039191140321310.201959557016066
100.6869967231930650.6260065536138690.313003276806935
110.7578005650838790.4843988698322420.242199434916121
120.6612943325907110.6774113348185780.338705667409289
130.6540172505093730.6919654989812530.345982749490627
140.6633095004359140.6733809991281720.336690499564086
150.7051270699480460.5897458601039080.294872930051954
160.6280531238465230.7438937523069540.371946876153477
170.5752312698556980.8495374602886050.424768730144302
180.6965387052075610.6069225895848780.303461294792439
190.6834852452468390.6330295095063230.316514754753162
200.6181175508394150.763764898321170.381882449160585
210.5793534739459140.8412930521081730.420646526054086
220.5024398885241760.9951202229516470.497560111475824
230.6270073837676450.745985232464710.372992616232355
240.5501704681706040.8996590636587930.449829531829396
250.5159112935033910.9681774129932190.484088706496609
260.5223645131996220.9552709736007550.477635486800378
270.5733126749487860.8533746501024280.426687325051214
280.510195383666590.979609232666820.48980461633341
290.4467127306129080.8934254612258150.553287269387092
300.6454124244083680.7091751511832630.354587575591632
310.6030700584994360.7938598830011280.396929941500564
320.5395235045118140.9209529909763730.460476495488186
330.4975065069199470.9950130138398950.502493493080053
340.4486620317428910.8973240634857810.55133796825711
350.4048315242364070.8096630484728140.595168475763593
360.4632408699275060.9264817398550120.536759130072494
370.3963171192243670.7926342384487340.603682880775633
380.5173244545965690.9653510908068610.482675545403431
390.5080107686070090.9839784627859830.491989231392991
400.4691969845446060.9383939690892130.530803015455394
410.5709774163735080.8580451672529830.429022583626492
420.8133168204880180.3733663590239640.186683179511982
430.8089815175044650.382036964991070.191018482495535
440.7833602959355480.4332794081289040.216639704064452
450.7710710969885740.4578578060228510.228928903011426
460.7475405914910660.5049188170178670.252459408508934
470.699007463525730.601985072948540.30099253647427
480.6570659600557830.6858680798884340.342934039944217
490.5997674570166620.8004650859666770.400232542983338
500.5044079320551550.991184135889690.495592067944845
510.6346663073387150.730667385322570.365333692661285
520.581682824397320.836634351205360.41831717560268
530.4653304905467690.9306609810935380.534669509453231
540.4271235445145920.8542470890291850.572876455485408
550.3380769575622470.6761539151244930.661923042437753
560.4692556934207740.9385113868415480.530744306579226


Meta Analysis of Goldfeld-Quandt test for Heteroskedasticity
Description# significant tests% significant testsOK/NOK
1% type I error level00OK
5% type I error level00OK
10% type I error level00OK

\begin{tabular}{lllllllll}
\hline
Meta Analysis of Goldfeld-Quandt test for Heteroskedasticity \tabularnewline
Description & # significant tests & % significant tests & OK/NOK \tabularnewline
1% type I error level & 0 & 0 & OK \tabularnewline
5% type I error level & 0 & 0 & OK \tabularnewline
10% type I error level & 0 & 0 & OK \tabularnewline
\hline
\end{tabular}
%Source: https://freestatistics.org/blog/index.php?pk=114921&T=6

[TABLE]
[ROW][C]Meta Analysis of Goldfeld-Quandt test for Heteroskedasticity[/C][/ROW]
[ROW][C]Description[/C][C]# significant tests[/C][C]% significant tests[/C][C]OK/NOK[/C][/ROW]
[ROW][C]1% type I error level[/C][C]0[/C][C]0[/C][C]OK[/C][/ROW]
[ROW][C]5% type I error level[/C][C]0[/C][C]0[/C][C]OK[/C][/ROW]
[ROW][C]10% type I error level[/C][C]0[/C][C]0[/C][C]OK[/C][/ROW]
[/TABLE]
Source: https://freestatistics.org/blog/index.php?pk=114921&T=6

Globally Unique Identifier (entire table): ba.freestatistics.org/blog/index.php?pk=114921&T=6

As an alternative you can also use a QR Code:  

The GUIDs for individual cells are displayed in the table below:

Meta Analysis of Goldfeld-Quandt test for Heteroskedasticity
Description# significant tests% significant testsOK/NOK
1% type I error level00OK
5% type I error level00OK
10% type I error level00OK


Parameters (Session):
par1 = 1 ; par2 = Do not include Seasonal Dummies ; par3 = No Linear Trend ;
Parameters (R input):
par1 = 1 ; par2 = Do not include Seasonal Dummies ; par3 = No Linear Trend ;
R code (references can be found in the software module):
library(lattice)
library(lmtest)
n25 <- 25 #minimum number of obs. for Goldfeld-Quandt test
par1 <- as.numeric(par1)
x <- t(y)
k <- length(x[1,])
n <- length(x[,1])
x1 <- cbind(x[,par1], x[,1:k!=par1])
mycolnames <- c(colnames(x)[par1], colnames(x)[1:k!=par1])
colnames(x1) <- mycolnames #colnames(x)[par1]
x <- x1
if (par3 == 'First Differences'){
x2 <- array(0, dim=c(n-1,k), dimnames=list(1:(n-1), paste('(1-B)',colnames(x),sep='')))
for (i in 1:n-1) {
for (j in 1:k) {
x2[i,j] <- x[i+1,j] - x[i,j]
}
}
x <- x2
}
if (par2 == 'Include Monthly Dummies'){
x2 <- array(0, dim=c(n,11), dimnames=list(1:n, paste('M', seq(1:11), sep ='')))
for (i in 1:11){
x2[seq(i,n,12),i] <- 1
}
x <- cbind(x, x2)
}
if (par2 == 'Include Quarterly Dummies'){
x2 <- array(0, dim=c(n,3), dimnames=list(1:n, paste('Q', seq(1:3), sep ='')))
for (i in 1:3){
x2[seq(i,n,4),i] <- 1
}
x <- cbind(x, x2)
}
k <- length(x[1,])
if (par3 == 'Linear Trend'){
x <- cbind(x, c(1:n))
colnames(x)[k+1] <- 't'
}
x
k <- length(x[1,])
df <- as.data.frame(x)
(mylm <- lm(df))
(mysum <- summary(mylm))
if (n > n25) {
kp3 <- k + 3
nmkm3 <- n - k - 3
gqarr <- array(NA, dim=c(nmkm3-kp3+1,3))
numgqtests <- 0
numsignificant1 <- 0
numsignificant5 <- 0
numsignificant10 <- 0
for (mypoint in kp3:nmkm3) {
j <- 0
numgqtests <- numgqtests + 1
for (myalt in c('greater', 'two.sided', 'less')) {
j <- j + 1
gqarr[mypoint-kp3+1,j] <- gqtest(mylm, point=mypoint, alternative=myalt)$p.value
}
if (gqarr[mypoint-kp3+1,2] < 0.01) numsignificant1 <- numsignificant1 + 1
if (gqarr[mypoint-kp3+1,2] < 0.05) numsignificant5 <- numsignificant5 + 1
if (gqarr[mypoint-kp3+1,2] < 0.10) numsignificant10 <- numsignificant10 + 1
}
gqarr
}
bitmap(file='test0.png')
plot(x[,1], type='l', main='Actuals and Interpolation', ylab='value of Actuals and Interpolation (dots)', xlab='time or index')
points(x[,1]-mysum$resid)
grid()
dev.off()
bitmap(file='test1.png')
plot(mysum$resid, type='b', pch=19, main='Residuals', ylab='value of Residuals', xlab='time or index')
grid()
dev.off()
bitmap(file='test2.png')
hist(mysum$resid, main='Residual Histogram', xlab='values of Residuals')
grid()
dev.off()
bitmap(file='test3.png')
densityplot(~mysum$resid,col='black',main='Residual Density Plot', xlab='values of Residuals')
dev.off()
bitmap(file='test4.png')
qqnorm(mysum$resid, main='Residual Normal Q-Q Plot')
qqline(mysum$resid)
grid()
dev.off()
(myerror <- as.ts(mysum$resid))
bitmap(file='test5.png')
dum <- cbind(lag(myerror,k=1),myerror)
dum
dum1 <- dum[2:length(myerror),]
dum1
z <- as.data.frame(dum1)
z
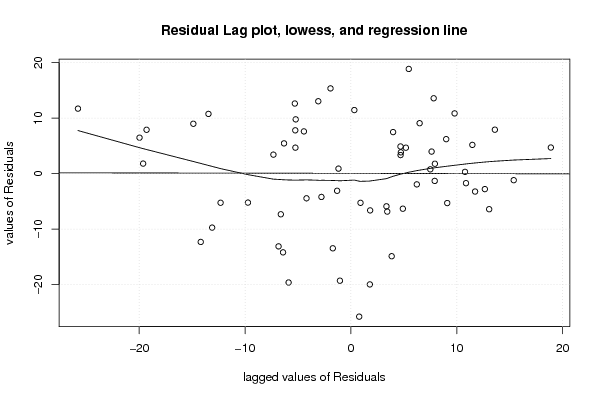
plot(z,main=paste('Residual Lag plot, lowess, and regression line'), ylab='values of Residuals', xlab='lagged values of Residuals')
lines(lowess(z))
abline(lm(z))
grid()
dev.off()
bitmap(file='test6.png')
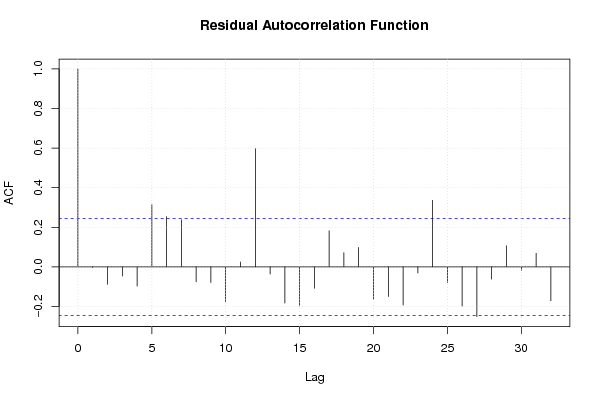
acf(mysum$resid, lag.max=length(mysum$resid)/2, main='Residual Autocorrelation Function')
grid()
dev.off()
bitmap(file='test7.png')
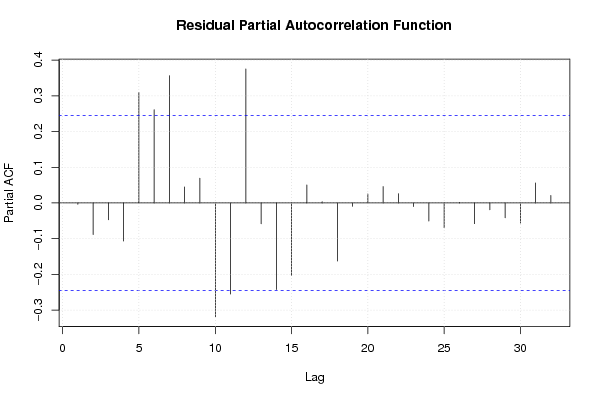
pacf(mysum$resid, lag.max=length(mysum$resid)/2, main='Residual Partial Autocorrelation Function')
grid()
dev.off()
bitmap(file='test8.png')
opar <- par(mfrow = c(2,2), oma = c(0, 0, 1.1, 0))
plot(mylm, las = 1, sub='Residual Diagnostics')
par(opar)
dev.off()
if (n > n25) {
bitmap(file='test9.png')
plot(kp3:nmkm3,gqarr[,2], main='Goldfeld-Quandt test',ylab='2-sided p-value',xlab='breakpoint')
grid()
dev.off()
}
load(file='createtable')
a<-table.start()
a<-table.row.start(a)
a<-table.element(a, 'Multiple Linear Regression - Estimated Regression Equation', 1, TRUE)
a<-table.row.end(a)
myeq <- colnames(x)[1]
myeq <- paste(myeq, '[t] = ', sep='')
for (i in 1:k){
if (mysum$coefficients[i,1] > 0) myeq <- paste(myeq, '+', '')
myeq <- paste(myeq, mysum$coefficients[i,1], sep=' ')
if (rownames(mysum$coefficients)[i] != '(Intercept)') {
myeq <- paste(myeq, rownames(mysum$coefficients)[i], sep='')
if (rownames(mysum$coefficients)[i] != 't') myeq <- paste(myeq, '[t]', sep='')
}
}
myeq <- paste(myeq, ' + e[t]')
a<-table.row.start(a)
a<-table.element(a, myeq)
a<-table.row.end(a)
a<-table.end(a)
table.save(a,file='mytable1.tab')
a<-table.start()
a<-table.row.start(a)
a<-table.element(a,hyperlink('ols1.htm','Multiple Linear Regression - Ordinary Least Squares',''), 6, TRUE)
a<-table.row.end(a)
a<-table.row.start(a)
a<-table.element(a,'Variable',header=TRUE)
a<-table.element(a,'Parameter',header=TRUE)
a<-table.element(a,'S.D.',header=TRUE)
a<-table.element(a,'T-STAT
H0: parameter = 0',header=TRUE)
a<-table.element(a,'2-tail p-value',header=TRUE)
a<-table.element(a,'1-tail p-value',header=TRUE)
a<-table.row.end(a)
for (i in 1:k){
a<-table.row.start(a)
a<-table.element(a,rownames(mysum$coefficients)[i],header=TRUE)
a<-table.element(a,mysum$coefficients[i,1])
a<-table.element(a, round(mysum$coefficients[i,2],6))
a<-table.element(a, round(mysum$coefficients[i,3],4))
a<-table.element(a, round(mysum$coefficients[i,4],6))
a<-table.element(a, round(mysum$coefficients[i,4]/2,6))
a<-table.row.end(a)
}
a<-table.end(a)
table.save(a,file='mytable2.tab')
a<-table.start()
a<-table.row.start(a)
a<-table.element(a, 'Multiple Linear Regression - Regression Statistics', 2, TRUE)
a<-table.row.end(a)
a<-table.row.start(a)
a<-table.element(a, 'Multiple R',1,TRUE)
a<-table.element(a, sqrt(mysum$r.squared))
a<-table.row.end(a)
a<-table.row.start(a)
a<-table.element(a, 'R-squared',1,TRUE)
a<-table.element(a, mysum$r.squared)
a<-table.row.end(a)
a<-table.row.start(a)
a<-table.element(a, 'Adjusted R-squared',1,TRUE)
a<-table.element(a, mysum$adj.r.squared)
a<-table.row.end(a)
a<-table.row.start(a)
a<-table.element(a, 'F-TEST (value)',1,TRUE)
a<-table.element(a, mysum$fstatistic[1])
a<-table.row.end(a)
a<-table.row.start(a)
a<-table.element(a, 'F-TEST (DF numerator)',1,TRUE)
a<-table.element(a, mysum$fstatistic[2])
a<-table.row.end(a)
a<-table.row.start(a)
a<-table.element(a, 'F-TEST (DF denominator)',1,TRUE)
a<-table.element(a, mysum$fstatistic[3])
a<-table.row.end(a)
a<-table.row.start(a)
a<-table.element(a, 'p-value',1,TRUE)
a<-table.element(a, 1-pf(mysum$fstatistic[1],mysum$fstatistic[2],mysum$fstatistic[3]))
a<-table.row.end(a)
a<-table.row.start(a)
a<-table.element(a, 'Multiple Linear Regression - Residual Statistics', 2, TRUE)
a<-table.row.end(a)
a<-table.row.start(a)
a<-table.element(a, 'Residual Standard Deviation',1,TRUE)
a<-table.element(a, mysum$sigma)
a<-table.row.end(a)
a<-table.row.start(a)
a<-table.element(a, 'Sum Squared Residuals',1,TRUE)
a<-table.element(a, sum(myerror*myerror))
a<-table.row.end(a)
a<-table.end(a)
table.save(a,file='mytable3.tab')
a<-table.start()
a<-table.row.start(a)
a<-table.element(a, 'Multiple Linear Regression - Actuals, Interpolation, and Residuals', 4, TRUE)
a<-table.row.end(a)
a<-table.row.start(a)
a<-table.element(a, 'Time or Index', 1, TRUE)
a<-table.element(a, 'Actuals', 1, TRUE)
a<-table.element(a, 'Interpolation
Forecast', 1, TRUE)
a<-table.element(a, 'Residuals
Prediction Error', 1, TRUE)
a<-table.row.end(a)
for (i in 1:n) {
a<-table.row.start(a)
a<-table.element(a,i, 1, TRUE)
a<-table.element(a,x[i])
a<-table.element(a,x[i]-mysum$resid[i])
a<-table.element(a,mysum$resid[i])
a<-table.row.end(a)
}
a<-table.end(a)
table.save(a,file='mytable4.tab')
if (n > n25) {
a<-table.start()
a<-table.row.start(a)
a<-table.element(a,'Goldfeld-Quandt test for Heteroskedasticity',4,TRUE)
a<-table.row.end(a)
a<-table.row.start(a)
a<-table.element(a,'p-values',header=TRUE)
a<-table.element(a,'Alternative Hypothesis',3,header=TRUE)
a<-table.row.end(a)
a<-table.row.start(a)
a<-table.element(a,'breakpoint index',header=TRUE)
a<-table.element(a,'greater',header=TRUE)
a<-table.element(a,'2-sided',header=TRUE)
a<-table.element(a,'less',header=TRUE)
a<-table.row.end(a)
for (mypoint in kp3:nmkm3) {
a<-table.row.start(a)
a<-table.element(a,mypoint,header=TRUE)
a<-table.element(a,gqarr[mypoint-kp3+1,1])
a<-table.element(a,gqarr[mypoint-kp3+1,2])
a<-table.element(a,gqarr[mypoint-kp3+1,3])
a<-table.row.end(a)
}
a<-table.end(a)
table.save(a,file='mytable5.tab')
a<-table.start()
a<-table.row.start(a)
a<-table.element(a,'Meta Analysis of Goldfeld-Quandt test for Heteroskedasticity',4,TRUE)
a<-table.row.end(a)
a<-table.row.start(a)
a<-table.element(a,'Description',header=TRUE)
a<-table.element(a,'# significant tests',header=TRUE)
a<-table.element(a,'% significant tests',header=TRUE)
a<-table.element(a,'OK/NOK',header=TRUE)
a<-table.row.end(a)
a<-table.row.start(a)
a<-table.element(a,'1% type I error level',header=TRUE)
a<-table.element(a,numsignificant1)
a<-table.element(a,numsignificant1/numgqtests)
if (numsignificant1/numgqtests < 0.01) dum <- 'OK' else dum <- 'NOK'
a<-table.element(a,dum)
a<-table.row.end(a)
a<-table.row.start(a)
a<-table.element(a,'5% type I error level',header=TRUE)
a<-table.element(a,numsignificant5)
a<-table.element(a,numsignificant5/numgqtests)
if (numsignificant5/numgqtests < 0.05) dum <- 'OK' else dum <- 'NOK'
a<-table.element(a,dum)
a<-table.row.end(a)
a<-table.row.start(a)
a<-table.element(a,'10% type I error level',header=TRUE)
a<-table.element(a,numsignificant10)
a<-table.element(a,numsignificant10/numgqtests)
if (numsignificant10/numgqtests < 0.1) dum <- 'OK' else dum <- 'NOK'
a<-table.element(a,dum)
a<-table.row.end(a)
a<-table.end(a)
table.save(a,file='mytable6.tab')
}