| Tabulation of Results | |||
| CAT_STRESS x CAT_ETEN | |||
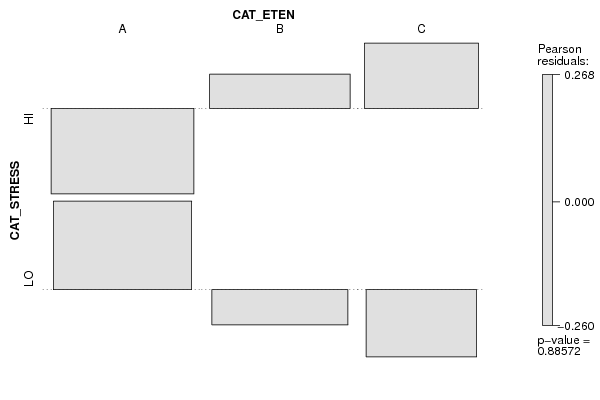
| A | B | C | HI | 30 | 31 | 21 | LO | 31 | 28 | 18 |
| Tabulation of Expected Results | |||
| CAT_STRESS x CAT_ETEN | |||
| A | B | C | HI | 31.46 | 30.43 | 20.11 | LO | 29.54 | 28.57 | 18.89 |
| Statistical Results | |
| Pearson's Chi-squared test | |
| Chi Square Statistic | 0.24 |
| Degrees of Freedom | 2 |
| P value | 0.89 |