| Multiple Linear Regression - Estimated Regression Equation |
| inflatie[t] = + 4.35891569656023 -1.24880250097788e-06beurswaarde[t] + 1.08573074824315e-05werkloosheid[t] -0.00277272710599615failliet[t] + e[t] |
| Multiple Linear Regression - Ordinary Least Squares | |||||
| Variable | Parameter | S.D. | T-STAT H0: parameter = 0 | 2-tail p-value | 1-tail p-value |
| (Intercept) | 4.35891569656023 | 0.490685 | 8.8833 | 0 | 0 |
| beurswaarde | -1.24880250097788e-06 | 0 | -2.7034 | 0.00907 | 0.004535 |
| werkloosheid | 1.08573074824315e-05 | 0.001406 | 0.0077 | 0.993864 | 0.496932 |
| failliet | -0.00277272710599615 | 0.000733 | -3.7808 | 0.000382 | 0.000191 |
| Multiple Linear Regression - Regression Statistics | |
| Multiple R | 0.61098302178297 |
| R-squared | 0.373300252907049 |
| Adjusted R-squared | 0.339727052169926 |
| F-TEST (value) | 11.1189950529288 |
| F-TEST (DF numerator) | 3 |
| F-TEST (DF denominator) | 56 |
| p-value | 7.89864764538795e-06 |
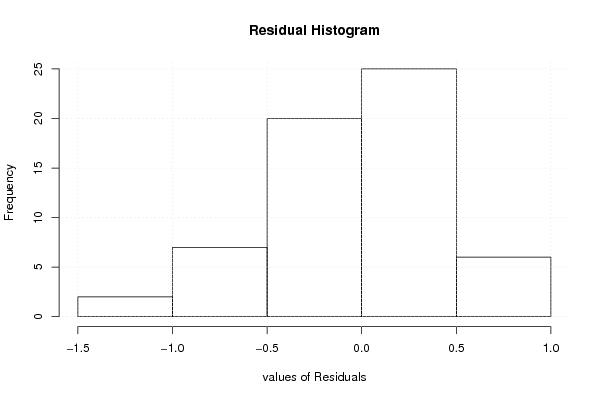
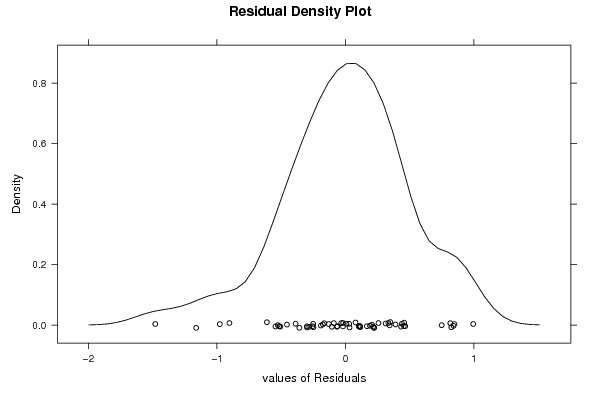
| Multiple Linear Regression - Residual Statistics | |
| Residual Standard Deviation | 0.503152512180858 |
| Sum Squared Residuals | 14.1770972287789 |
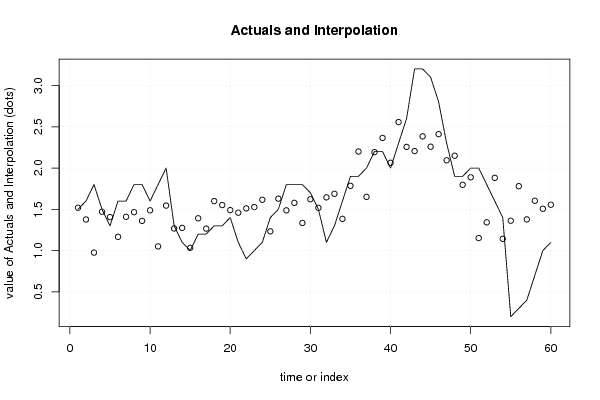
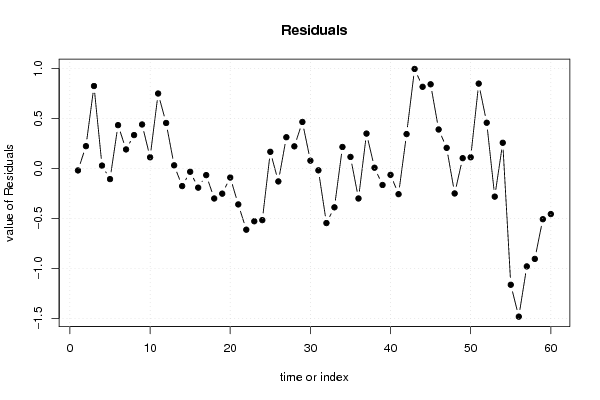
| Multiple Linear Regression - Actuals, Interpolation, and Residuals | |||
| Time or Index | Actuals | Interpolation Forecast | Residuals Prediction Error |
| 1 | 1.5 | 1.51921019516525 | -0.0192101951652503 |
| 2 | 1.6 | 1.37657734573353 | 0.223422654266465 |
| 3 | 1.8 | 0.975741539413358 | 0.824258460586642 |
| 4 | 1.5 | 1.47086421151832 | 0.0291357884816838 |
| 5 | 1.3 | 1.40576554839410 | -0.105765548394098 |
| 6 | 1.6 | 1.16662453237954 | 0.433375467620458 |
| 7 | 1.6 | 1.40939837672902 | 0.190601623270977 |
| 8 | 1.8 | 1.46578663876289 | 0.334213361237106 |
| 9 | 1.8 | 1.36005904828778 | 0.439940951712223 |
| 10 | 1.6 | 1.48796690127490 | 0.112033098725104 |
| 11 | 1.8 | 1.05071545146793 | 0.749284548532075 |
| 12 | 2 | 1.54510479887746 | 0.454895201122535 |
| 13 | 1.3 | 1.26829241266575 | 0.0317075873342502 |
| 14 | 1.1 | 1.27556903087156 | -0.175569030871559 |
| 15 | 1 | 1.03257509054417 | -0.0325750905441687 |
| 16 | 1.2 | 1.39130684033976 | -0.191306840339765 |
| 17 | 1.2 | 1.26608057851872 | -0.0660805785187162 |
| 18 | 1.3 | 1.59962905831145 | -0.299629058311449 |
| 19 | 1.3 | 1.55122614383232 | -0.251226143832315 |
| 20 | 1.4 | 1.49022863177324 | -0.0902286317732372 |
| 21 | 1.1 | 1.45888755786188 | -0.358887557861882 |
| 22 | 0.9 | 1.51145738075974 | -0.611457380759741 |
| 23 | 1 | 1.52720363819079 | -0.527203638190792 |
| 24 | 1.1 | 1.61572151414190 | -0.515721514141895 |
| 25 | 1.4 | 1.23323590642137 | 0.166764093578627 |
| 26 | 1.5 | 1.62917885604129 | -0.129178856041292 |
| 27 | 1.8 | 1.48763297522225 | 0.312367024777754 |
| 28 | 1.8 | 1.57854660844663 | 0.221453391553366 |
| 29 | 1.8 | 1.33467632157462 | 0.465323678425378 |
| 30 | 1.7 | 1.62165676331598 | 0.0783432366840166 |
| 31 | 1.5 | 1.51828027752732 | -0.0182802775273244 |
| 32 | 1.1 | 1.64498147932327 | -0.544981479323275 |
| 33 | 1.3 | 1.68800818867469 | -0.38800818867469 |
| 34 | 1.6 | 1.38479709721611 | 0.215202902783891 |
| 35 | 1.9 | 1.78425699473423 | 0.115743005265773 |
| 36 | 1.9 | 2.19957665736489 | -0.29957665736489 |
| 37 | 2 | 1.65103072098814 | 0.348969279011856 |
| 38 | 2.2 | 2.19210254526739 | 0.00789745473261452 |
| 39 | 2.2 | 2.36455520773171 | -0.164555207731707 |
| 40 | 2 | 2.06345870743817 | -0.0634587074381653 |
| 41 | 2.3 | 2.55649460996868 | -0.256494609968684 |
| 42 | 2.6 | 2.25601076854391 | 0.343989231456093 |
| 43 | 3.2 | 2.20524345747048 | 0.994756542529524 |
| 44 | 3.2 | 2.38373458198197 | 0.81626541801803 |
| 45 | 3.1 | 2.25844052471765 | 0.841559475282353 |
| 46 | 2.8 | 2.41022405448625 | 0.38977594551375 |
| 47 | 2.3 | 2.0938377838053 | 0.206162216194701 |
| 48 | 1.9 | 2.14940748005772 | -0.249407480057721 |
| 49 | 1.9 | 1.79685308581721 | 0.103146914182791 |
| 50 | 2 | 1.8877792591953 | 0.112220740804699 |
| 51 | 2 | 1.15174451447268 | 0.848255485527316 |
| 52 | 1.8 | 1.34275829222177 | 0.457241707778227 |
| 53 | 1.6 | 1.88105017423335 | -0.281050174233347 |
| 54 | 1.4 | 1.14293612727970 | 0.257063872720297 |
| 55 | 0.2 | 1.36175984076092 | -1.16175984076092 |
| 56 | 0.3 | 1.78030504386925 | -1.48030504386925 |
| 57 | 0.4 | 1.37824343121475 | -0.978243431214752 |
| 58 | 0.7 | 1.60325211064546 | -0.90325211064546 |
| 59 | 1 | 1.50664408229786 | -0.506644082297864 |
| 60 | 1.1 | 1.55531300385636 | -0.455313003856362 |
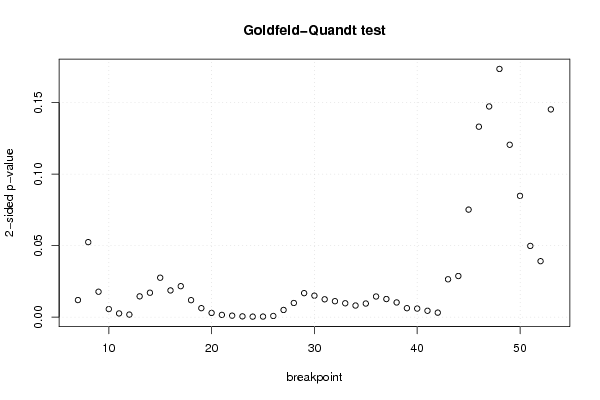
| Goldfeld-Quandt test for Heteroskedasticity | |||
| p-values | Alternative Hypothesis | ||
| breakpoint index | greater | 2-sided | less |
| 7 | 0.00593480620108487 | 0.0118696124021697 | 0.994065193798915 |
| 8 | 0.026199816137618 | 0.052399632275236 | 0.973800183862382 |
| 9 | 0.008842169520049 | 0.017684339040098 | 0.99115783047995 |
| 10 | 0.00277045068352916 | 0.00554090136705831 | 0.99722954931647 |
| 11 | 0.00124841927522679 | 0.00249683855045358 | 0.998751580724773 |
| 12 | 0.000840800305516568 | 0.00168160061103314 | 0.999159199694483 |
| 13 | 0.00722858026937127 | 0.0144571605387425 | 0.992771419730629 |
| 14 | 0.00849066562683718 | 0.0169813312536744 | 0.991509334373163 |
| 15 | 0.0137473826774069 | 0.0274947653548138 | 0.986252617322593 |
| 16 | 0.00930310344131337 | 0.0186062068826267 | 0.990696896558687 |
| 17 | 0.0107879574703232 | 0.0215759149406465 | 0.989212042529677 |
| 18 | 0.00589551671868799 | 0.0117910334373760 | 0.994104483281312 |
| 19 | 0.00309012456908617 | 0.00618024913817234 | 0.996909875430914 |
| 20 | 0.00142754452992982 | 0.00285508905985965 | 0.99857245547007 |
| 21 | 0.000730310427390314 | 0.00146062085478063 | 0.99926968957261 |
| 22 | 0.000468881933397531 | 0.000937763866795062 | 0.999531118066602 |
| 23 | 0.000227758291824409 | 0.000455516583648817 | 0.999772241708176 |
| 24 | 0.000120680714106821 | 0.000241361428213642 | 0.999879319285893 |
| 25 | 0.000150237494828878 | 0.000300474989657757 | 0.999849762505171 |
| 26 | 0.000355090918231983 | 0.000710181836463966 | 0.999644909081768 |
| 27 | 0.00246347098795560 | 0.00492694197591119 | 0.997536529012044 |
| 28 | 0.00490170921490538 | 0.00980341842981076 | 0.995098290785095 |
| 29 | 0.00835029871856296 | 0.0167005974371259 | 0.991649701281437 |
| 30 | 0.00746519336294888 | 0.0149303867258978 | 0.992534806637051 |
| 31 | 0.00619813032028444 | 0.0123962606405689 | 0.993801869679716 |
| 32 | 0.0055331155276128 | 0.0110662310552256 | 0.994466884472387 |
| 33 | 0.00480665521841378 | 0.00961331043682757 | 0.995193344781586 |
| 34 | 0.00401528018759582 | 0.00803056037519164 | 0.995984719812404 |
| 35 | 0.00471331428517476 | 0.00942662857034951 | 0.995286685714825 |
| 36 | 0.00717403037166518 | 0.0143480607433304 | 0.992825969628335 |
| 37 | 0.00628973917807802 | 0.0125794783561560 | 0.993710260821922 |
| 38 | 0.00509430088626126 | 0.0101886017725225 | 0.994905699113739 |
| 39 | 0.0030848164336854 | 0.0061696328673708 | 0.996915183566315 |
| 40 | 0.00294513452615564 | 0.00589026905231128 | 0.997054865473844 |
| 41 | 0.00218331958646158 | 0.00436663917292316 | 0.997816680413538 |
| 42 | 0.0015229677806907 | 0.0030459355613814 | 0.99847703221931 |
| 43 | 0.0132028518466318 | 0.0264057036932635 | 0.986797148153368 |
| 44 | 0.0143472289655099 | 0.0286944579310198 | 0.98565277103449 |
| 45 | 0.0375817455756027 | 0.0751634911512054 | 0.962418254424397 |
| 46 | 0.0666011221565276 | 0.133202244313055 | 0.933398877843472 |
| 47 | 0.0736946609068492 | 0.147389321813698 | 0.92630533909315 |
| 48 | 0.0868201853472538 | 0.173640370694508 | 0.913179814652746 |
| 49 | 0.0602862508245389 | 0.120572501649078 | 0.939713749175461 |
| 50 | 0.0423979375236004 | 0.0847958750472008 | 0.9576020624764 |
| 51 | 0.0248768924971189 | 0.0497537849942379 | 0.975123107502881 |
| 52 | 0.0195417243328471 | 0.0390834486656943 | 0.980458275667153 |
| 53 | 0.072660553163273 | 0.145321106326546 | 0.927339446836727 |
| Meta Analysis of Goldfeld-Quandt test for Heteroskedasticity | |||
| Description | # significant tests | % significant tests | OK/NOK |
| 1% type I error level | 20 | 0.425531914893617 | NOK |
| 5% type I error level | 39 | 0.829787234042553 | NOK |
| 10% type I error level | 42 | 0.893617021276596 | NOK |