Free Statistics

of Irreproducible Research!

Author's title

Author*The author of this computation has been verified*
R Software Modulerwasp_arimabackwardselection.wasp
Title produced by softwareARIMA Backward Selection
Date of computationFri, 24 Dec 2010 13:01:28 +0000
Cite this page as followsStatistical Computations at FreeStatistics.org, Office for Research Development and Education, URL https://freestatistics.org/blog/index.php?v=date/2010/Dec/24/t12931960039qu8ua4sukwjvro.htm/, Retrieved Tue, 30 Apr 2024 00:22:56 +0000
Statistical Computations at FreeStatistics.org, Office for Research Development and Education, URL https://freestatistics.org/blog/index.php?pk=114896, Retrieved Tue, 30 Apr 2024 00:22:56 +0000
QR Codes:

Original text written by user:
IsPrivate?No (this computation is public)
User-defined keywords
Estimated Impact103
Family? (F = Feedback message, R = changed R code, M = changed R Module, P = changed Parameters, D = changed Data)
-     [Univariate Data Series] [data set] [2008-12-01 19:54:57] [b98453cac15ba1066b407e146608df68]
- RMP   [Standard Deviation-Mean Plot] [Unemployment] [2010-11-29 10:34:47] [b98453cac15ba1066b407e146608df68]
- RMP     [ARIMA Backward Selection] [Unemployment] [2010-11-29 17:10:28] [b98453cac15ba1066b407e146608df68]
-   PD        [ARIMA Backward Selection] [ARIMA Backward Se...] [2010-12-24 13:01:28] [cda497ce08bc921f0aec22acd67c882b] [Current]
Feedback Forum

Post a new message
Dataseries X:
12008
9169
8788
8417
8247
8197
8236
8253
7733
8366
8626
8863
10102
8463
9114
8563
8872
8301
8301
8278
7736
7973
8268
9476
11100
8962
9173
8738
8459
8078
8411
8291
7810
8616
8312
9692
9911
8915
9452
9112
8472
8230
8384
8625
8221
8649
8625
10443
10357
8586
8892
8329
8101
7922
8120
7838
7735
8406
8209
9451
10041
9411
10405
8467
8464
8102
7627
7513
7510
8291
8064
9383


Summary of computational transaction
Raw Inputview raw input (R code)
Raw Outputview raw output of R engine
Computing time22 seconds
R Server'Gwilym Jenkins' @ 72.249.127.135

\begin{tabular}{lllllllll}
\hline
Summary of computational transaction \tabularnewline
Raw Input & view raw input (R code)  \tabularnewline
Raw Output & view raw output of R engine  \tabularnewline
Computing time & 22 seconds \tabularnewline
R Server & 'Gwilym Jenkins' @ 72.249.127.135 \tabularnewline
\hline
\end{tabular}
%Source: https://freestatistics.org/blog/index.php?pk=114896&T=0

[TABLE]
[ROW][C]Summary of computational transaction[/C][/ROW]
[ROW][C]Raw Input[/C][C]view raw input (R code) [/C][/ROW]
[ROW][C]Raw Output[/C][C]view raw output of R engine [/C][/ROW]
[ROW][C]Computing time[/C][C]22 seconds[/C][/ROW]
[ROW][C]R Server[/C][C]'Gwilym Jenkins' @ 72.249.127.135[/C][/ROW]
[/TABLE]
Source: https://freestatistics.org/blog/index.php?pk=114896&T=0

Globally Unique Identifier (entire table): ba.freestatistics.org/blog/index.php?pk=114896&T=0

As an alternative you can also use a QR Code:  

The GUIDs for individual cells are displayed in the table below:

Summary of computational transaction
Raw Inputview raw input (R code)
Raw Outputview raw output of R engine
Computing time22 seconds
R Server'Gwilym Jenkins' @ 72.249.127.135


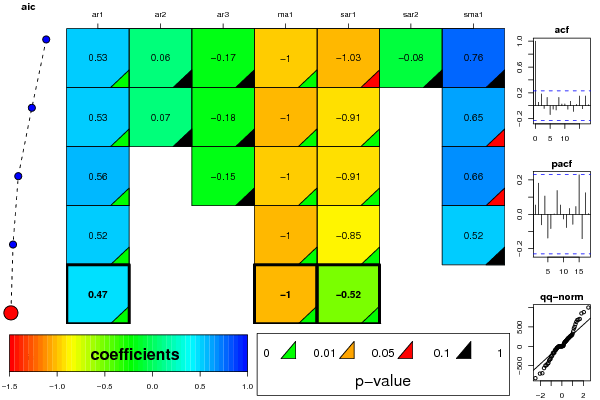
ARIMA Parameter Estimation and Backward Selection
Iterationar1ar2ar3ma1sar1sar2sma1
Estimates ( 1 )0.53460.0592-0.1674-1-1.0316-0.08020.7583
(p-val)(5e-04 )(0.7176 )(0.2622 )(0 )(0.0509 )(0.8161 )(0.2287 )
Estimates ( 2 )0.53410.066-0.1762-1-0.914500.6477
(p-val)(5e-04 )(0.681 )(0.2222 )(0 )(0 )(NA )(0.0681 )
Estimates ( 3 )0.55670-0.1536-1-0.912500.657
(p-val)(1e-04 )(NA )(0.2458 )(0 )(0 )(NA )(0.0764 )
Estimates ( 4 )0.515600-1-0.850100.5176
(p-val)(3e-04 )(NA )(NA )(0 )(0 )(NA )(0.142 )
Estimates ( 5 )0.473800-1-0.51700
(p-val)(7e-04 )(NA )(NA )(0 )(1e-04 )(NA )(NA )
Estimates ( 6 )NANANANANANANA
(p-val)(NA )(NA )(NA )(NA )(NA )(NA )(NA )
Estimates ( 7 )NANANANANANANA
(p-val)(NA )(NA )(NA )(NA )(NA )(NA )(NA )
Estimates ( 8 )NANANANANANANA
(p-val)(NA )(NA )(NA )(NA )(NA )(NA )(NA )
Estimates ( 9 )NANANANANANANA
(p-val)(NA )(NA )(NA )(NA )(NA )(NA )(NA )
Estimates ( 10 )NANANANANANANA
(p-val)(NA )(NA )(NA )(NA )(NA )(NA )(NA )
Estimates ( 11 )NANANANANANANA
(p-val)(NA )(NA )(NA )(NA )(NA )(NA )(NA )
Estimates ( 12 )NANANANANANANA
(p-val)(NA )(NA )(NA )(NA )(NA )(NA )(NA )
Estimates ( 13 )NANANANANANANA
(p-val)(NA )(NA )(NA )(NA )(NA )(NA )(NA )

\begin{tabular}{lllllllll}
\hline
ARIMA Parameter Estimation and Backward Selection \tabularnewline
Iteration & ar1 & ar2 & ar3 & ma1 & sar1 & sar2 & sma1 \tabularnewline
Estimates ( 1 ) & 0.5346 & 0.0592 & -0.1674 & -1 & -1.0316 & -0.0802 & 0.7583 \tabularnewline
(p-val) & (5e-04 ) & (0.7176 ) & (0.2622 ) & (0 ) & (0.0509 ) & (0.8161 ) & (0.2287 ) \tabularnewline
Estimates ( 2 ) & 0.5341 & 0.066 & -0.1762 & -1 & -0.9145 & 0 & 0.6477 \tabularnewline
(p-val) & (5e-04 ) & (0.681 ) & (0.2222 ) & (0 ) & (0 ) & (NA ) & (0.0681 ) \tabularnewline
Estimates ( 3 ) & 0.5567 & 0 & -0.1536 & -1 & -0.9125 & 0 & 0.657 \tabularnewline
(p-val) & (1e-04 ) & (NA ) & (0.2458 ) & (0 ) & (0 ) & (NA ) & (0.0764 ) \tabularnewline
Estimates ( 4 ) & 0.5156 & 0 & 0 & -1 & -0.8501 & 0 & 0.5176 \tabularnewline
(p-val) & (3e-04 ) & (NA ) & (NA ) & (0 ) & (0 ) & (NA ) & (0.142 ) \tabularnewline
Estimates ( 5 ) & 0.4738 & 0 & 0 & -1 & -0.517 & 0 & 0 \tabularnewline
(p-val) & (7e-04 ) & (NA ) & (NA ) & (0 ) & (1e-04 ) & (NA ) & (NA ) \tabularnewline
Estimates ( 6 ) & NA & NA & NA & NA & NA & NA & NA \tabularnewline
(p-val) & (NA ) & (NA ) & (NA ) & (NA ) & (NA ) & (NA ) & (NA ) \tabularnewline
Estimates ( 7 ) & NA & NA & NA & NA & NA & NA & NA \tabularnewline
(p-val) & (NA ) & (NA ) & (NA ) & (NA ) & (NA ) & (NA ) & (NA ) \tabularnewline
Estimates ( 8 ) & NA & NA & NA & NA & NA & NA & NA \tabularnewline
(p-val) & (NA ) & (NA ) & (NA ) & (NA ) & (NA ) & (NA ) & (NA ) \tabularnewline
Estimates ( 9 ) & NA & NA & NA & NA & NA & NA & NA \tabularnewline
(p-val) & (NA ) & (NA ) & (NA ) & (NA ) & (NA ) & (NA ) & (NA ) \tabularnewline
Estimates ( 10 ) & NA & NA & NA & NA & NA & NA & NA \tabularnewline
(p-val) & (NA ) & (NA ) & (NA ) & (NA ) & (NA ) & (NA ) & (NA ) \tabularnewline
Estimates ( 11 ) & NA & NA & NA & NA & NA & NA & NA \tabularnewline
(p-val) & (NA ) & (NA ) & (NA ) & (NA ) & (NA ) & (NA ) & (NA ) \tabularnewline
Estimates ( 12 ) & NA & NA & NA & NA & NA & NA & NA \tabularnewline
(p-val) & (NA ) & (NA ) & (NA ) & (NA ) & (NA ) & (NA ) & (NA ) \tabularnewline
Estimates ( 13 ) & NA & NA & NA & NA & NA & NA & NA \tabularnewline
(p-val) & (NA ) & (NA ) & (NA ) & (NA ) & (NA ) & (NA ) & (NA ) \tabularnewline
\hline
\end{tabular}
%Source: https://freestatistics.org/blog/index.php?pk=114896&T=1

[TABLE]
[ROW][C]ARIMA Parameter Estimation and Backward Selection[/C][/ROW]
[ROW][C]Iteration[/C][C]ar1[/C][C]ar2[/C][C]ar3[/C][C]ma1[/C][C]sar1[/C][C]sar2[/C][C]sma1[/C][/ROW]
[ROW][C]Estimates ( 1 )[/C][C]0.5346[/C][C]0.0592[/C][C]-0.1674[/C][C]-1[/C][C]-1.0316[/C][C]-0.0802[/C][C]0.7583[/C][/ROW]
[ROW][C](p-val)[/C][C](5e-04 )[/C][C](0.7176 )[/C][C](0.2622 )[/C][C](0 )[/C][C](0.0509 )[/C][C](0.8161 )[/C][C](0.2287 )[/C][/ROW]
[ROW][C]Estimates ( 2 )[/C][C]0.5341[/C][C]0.066[/C][C]-0.1762[/C][C]-1[/C][C]-0.9145[/C][C]0[/C][C]0.6477[/C][/ROW]
[ROW][C](p-val)[/C][C](5e-04 )[/C][C](0.681 )[/C][C](0.2222 )[/C][C](0 )[/C][C](0 )[/C][C](NA )[/C][C](0.0681 )[/C][/ROW]
[ROW][C]Estimates ( 3 )[/C][C]0.5567[/C][C]0[/C][C]-0.1536[/C][C]-1[/C][C]-0.9125[/C][C]0[/C][C]0.657[/C][/ROW]
[ROW][C](p-val)[/C][C](1e-04 )[/C][C](NA )[/C][C](0.2458 )[/C][C](0 )[/C][C](0 )[/C][C](NA )[/C][C](0.0764 )[/C][/ROW]
[ROW][C]Estimates ( 4 )[/C][C]0.5156[/C][C]0[/C][C]0[/C][C]-1[/C][C]-0.8501[/C][C]0[/C][C]0.5176[/C][/ROW]
[ROW][C](p-val)[/C][C](3e-04 )[/C][C](NA )[/C][C](NA )[/C][C](0 )[/C][C](0 )[/C][C](NA )[/C][C](0.142 )[/C][/ROW]
[ROW][C]Estimates ( 5 )[/C][C]0.4738[/C][C]0[/C][C]0[/C][C]-1[/C][C]-0.517[/C][C]0[/C][C]0[/C][/ROW]
[ROW][C](p-val)[/C][C](7e-04 )[/C][C](NA )[/C][C](NA )[/C][C](0 )[/C][C](1e-04 )[/C][C](NA )[/C][C](NA )[/C][/ROW]
[ROW][C]Estimates ( 6 )[/C][C]NA[/C][C]NA[/C][C]NA[/C][C]NA[/C][C]NA[/C][C]NA[/C][C]NA[/C][/ROW]
[ROW][C](p-val)[/C][C](NA )[/C][C](NA )[/C][C](NA )[/C][C](NA )[/C][C](NA )[/C][C](NA )[/C][C](NA )[/C][/ROW]
[ROW][C]Estimates ( 7 )[/C][C]NA[/C][C]NA[/C][C]NA[/C][C]NA[/C][C]NA[/C][C]NA[/C][C]NA[/C][/ROW]
[ROW][C](p-val)[/C][C](NA )[/C][C](NA )[/C][C](NA )[/C][C](NA )[/C][C](NA )[/C][C](NA )[/C][C](NA )[/C][/ROW]
[ROW][C]Estimates ( 8 )[/C][C]NA[/C][C]NA[/C][C]NA[/C][C]NA[/C][C]NA[/C][C]NA[/C][C]NA[/C][/ROW]
[ROW][C](p-val)[/C][C](NA )[/C][C](NA )[/C][C](NA )[/C][C](NA )[/C][C](NA )[/C][C](NA )[/C][C](NA )[/C][/ROW]
[ROW][C]Estimates ( 9 )[/C][C]NA[/C][C]NA[/C][C]NA[/C][C]NA[/C][C]NA[/C][C]NA[/C][C]NA[/C][/ROW]
[ROW][C](p-val)[/C][C](NA )[/C][C](NA )[/C][C](NA )[/C][C](NA )[/C][C](NA )[/C][C](NA )[/C][C](NA )[/C][/ROW]
[ROW][C]Estimates ( 10 )[/C][C]NA[/C][C]NA[/C][C]NA[/C][C]NA[/C][C]NA[/C][C]NA[/C][C]NA[/C][/ROW]
[ROW][C](p-val)[/C][C](NA )[/C][C](NA )[/C][C](NA )[/C][C](NA )[/C][C](NA )[/C][C](NA )[/C][C](NA )[/C][/ROW]
[ROW][C]Estimates ( 11 )[/C][C]NA[/C][C]NA[/C][C]NA[/C][C]NA[/C][C]NA[/C][C]NA[/C][C]NA[/C][/ROW]
[ROW][C](p-val)[/C][C](NA )[/C][C](NA )[/C][C](NA )[/C][C](NA )[/C][C](NA )[/C][C](NA )[/C][C](NA )[/C][/ROW]
[ROW][C]Estimates ( 12 )[/C][C]NA[/C][C]NA[/C][C]NA[/C][C]NA[/C][C]NA[/C][C]NA[/C][C]NA[/C][/ROW]
[ROW][C](p-val)[/C][C](NA )[/C][C](NA )[/C][C](NA )[/C][C](NA )[/C][C](NA )[/C][C](NA )[/C][C](NA )[/C][/ROW]
[ROW][C]Estimates ( 13 )[/C][C]NA[/C][C]NA[/C][C]NA[/C][C]NA[/C][C]NA[/C][C]NA[/C][C]NA[/C][/ROW]
[ROW][C](p-val)[/C][C](NA )[/C][C](NA )[/C][C](NA )[/C][C](NA )[/C][C](NA )[/C][C](NA )[/C][C](NA )[/C][/ROW]
[/TABLE]
Source: https://freestatistics.org/blog/index.php?pk=114896&T=1

Globally Unique Identifier (entire table): ba.freestatistics.org/blog/index.php?pk=114896&T=1

As an alternative you can also use a QR Code:  

The GUIDs for individual cells are displayed in the table below:

ARIMA Parameter Estimation and Backward Selection
Iterationar1ar2ar3ma1sar1sar2sma1
Estimates ( 1 )0.53460.0592-0.1674-1-1.0316-0.08020.7583
(p-val)(5e-04 )(0.7176 )(0.2622 )(0 )(0.0509 )(0.8161 )(0.2287 )
Estimates ( 2 )0.53410.066-0.1762-1-0.914500.6477
(p-val)(5e-04 )(0.681 )(0.2222 )(0 )(0 )(NA )(0.0681 )
Estimates ( 3 )0.55670-0.1536-1-0.912500.657
(p-val)(1e-04 )(NA )(0.2458 )(0 )(0 )(NA )(0.0764 )
Estimates ( 4 )0.515600-1-0.850100.5176
(p-val)(3e-04 )(NA )(NA )(0 )(0 )(NA )(0.142 )
Estimates ( 5 )0.473800-1-0.51700
(p-val)(7e-04 )(NA )(NA )(0 )(1e-04 )(NA )(NA )
Estimates ( 6 )NANANANANANANA
(p-val)(NA )(NA )(NA )(NA )(NA )(NA )(NA )
Estimates ( 7 )NANANANANANANA
(p-val)(NA )(NA )(NA )(NA )(NA )(NA )(NA )
Estimates ( 8 )NANANANANANANA
(p-val)(NA )(NA )(NA )(NA )(NA )(NA )(NA )
Estimates ( 9 )NANANANANANANA
(p-val)(NA )(NA )(NA )(NA )(NA )(NA )(NA )
Estimates ( 10 )NANANANANANANA
(p-val)(NA )(NA )(NA )(NA )(NA )(NA )(NA )
Estimates ( 11 )NANANANANANANA
(p-val)(NA )(NA )(NA )(NA )(NA )(NA )(NA )
Estimates ( 12 )NANANANANANANA
(p-val)(NA )(NA )(NA )(NA )(NA )(NA )(NA )
Estimates ( 13 )NANANANANANANA
(p-val)(NA )(NA )(NA )(NA )(NA )(NA )(NA )


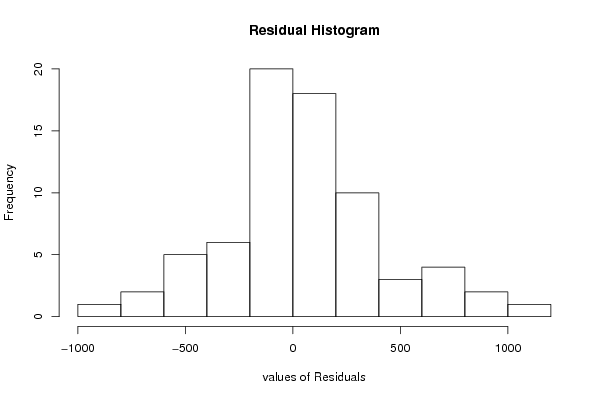
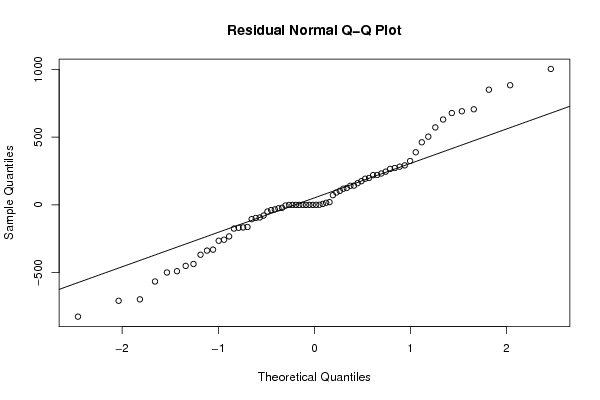
Estimated ARIMA Residuals
Value
-38.280585724911
883.125488601703
1003.03330116253
271.904407345996
677.755570153788
-21.7980045286806
159.935518659290
119.185484208708
91.0060565547699
-257.060785380386
-96.7241006117712
571.695482654745
220.534689961848
231.627704806113
219.75346827961
198.599597291856
-162.891877823679
-33.1497972189062
291.435494308852
15.4765279943252
124.580479316824
461.872880402987
-264.653968529987
691.075456668285
-697.154219614204
503.232458493765
71.87662664503
281.911849388512
-489.032016494618
193.076676888894
-25.2498303155063
323.896824876893
244.967277163432
103.610230114690
174.913113597548
388.326012528079
-707.55216303312
-337.295890353841
-168.827439144446
-436.186854161779
141.893443168281
-78.8848565398545
-166.345604080807
-498.627613769595
20.2462607785724
-174.847738087275
-105.246318313975
-449.981265811037
630.00102038713
705.330604290795
850.019600046071
-824.730104188337
265.346922705391
-48.914946832813
-565.095182576349
-330.293800830595
-93.106348999614
141.070839694021
-232.553838557796
-367.935768298412

\begin{tabular}{lllllllll}
\hline
Estimated ARIMA Residuals \tabularnewline
Value \tabularnewline
-38.280585724911 \tabularnewline
883.125488601703 \tabularnewline
1003.03330116253 \tabularnewline
271.904407345996 \tabularnewline
677.755570153788 \tabularnewline
-21.7980045286806 \tabularnewline
159.935518659290 \tabularnewline
119.185484208708 \tabularnewline
91.0060565547699 \tabularnewline
-257.060785380386 \tabularnewline
-96.7241006117712 \tabularnewline
571.695482654745 \tabularnewline
220.534689961848 \tabularnewline
231.627704806113 \tabularnewline
219.75346827961 \tabularnewline
198.599597291856 \tabularnewline
-162.891877823679 \tabularnewline
-33.1497972189062 \tabularnewline
291.435494308852 \tabularnewline
15.4765279943252 \tabularnewline
124.580479316824 \tabularnewline
461.872880402987 \tabularnewline
-264.653968529987 \tabularnewline
691.075456668285 \tabularnewline
-697.154219614204 \tabularnewline
503.232458493765 \tabularnewline
71.87662664503 \tabularnewline
281.911849388512 \tabularnewline
-489.032016494618 \tabularnewline
193.076676888894 \tabularnewline
-25.2498303155063 \tabularnewline
323.896824876893 \tabularnewline
244.967277163432 \tabularnewline
103.610230114690 \tabularnewline
174.913113597548 \tabularnewline
388.326012528079 \tabularnewline
-707.55216303312 \tabularnewline
-337.295890353841 \tabularnewline
-168.827439144446 \tabularnewline
-436.186854161779 \tabularnewline
141.893443168281 \tabularnewline
-78.8848565398545 \tabularnewline
-166.345604080807 \tabularnewline
-498.627613769595 \tabularnewline
20.2462607785724 \tabularnewline
-174.847738087275 \tabularnewline
-105.246318313975 \tabularnewline
-449.981265811037 \tabularnewline
630.00102038713 \tabularnewline
705.330604290795 \tabularnewline
850.019600046071 \tabularnewline
-824.730104188337 \tabularnewline
265.346922705391 \tabularnewline
-48.914946832813 \tabularnewline
-565.095182576349 \tabularnewline
-330.293800830595 \tabularnewline
-93.106348999614 \tabularnewline
141.070839694021 \tabularnewline
-232.553838557796 \tabularnewline
-367.935768298412 \tabularnewline
\hline
\end{tabular}
%Source: https://freestatistics.org/blog/index.php?pk=114896&T=2

[TABLE]
[ROW][C]Estimated ARIMA Residuals[/C][/ROW]
[ROW][C]Value[/C][/ROW]
[ROW][C]-38.280585724911[/C][/ROW]
[ROW][C]883.125488601703[/C][/ROW]
[ROW][C]1003.03330116253[/C][/ROW]
[ROW][C]271.904407345996[/C][/ROW]
[ROW][C]677.755570153788[/C][/ROW]
[ROW][C]-21.7980045286806[/C][/ROW]
[ROW][C]159.935518659290[/C][/ROW]
[ROW][C]119.185484208708[/C][/ROW]
[ROW][C]91.0060565547699[/C][/ROW]
[ROW][C]-257.060785380386[/C][/ROW]
[ROW][C]-96.7241006117712[/C][/ROW]
[ROW][C]571.695482654745[/C][/ROW]
[ROW][C]220.534689961848[/C][/ROW]
[ROW][C]231.627704806113[/C][/ROW]
[ROW][C]219.75346827961[/C][/ROW]
[ROW][C]198.599597291856[/C][/ROW]
[ROW][C]-162.891877823679[/C][/ROW]
[ROW][C]-33.1497972189062[/C][/ROW]
[ROW][C]291.435494308852[/C][/ROW]
[ROW][C]15.4765279943252[/C][/ROW]
[ROW][C]124.580479316824[/C][/ROW]
[ROW][C]461.872880402987[/C][/ROW]
[ROW][C]-264.653968529987[/C][/ROW]
[ROW][C]691.075456668285[/C][/ROW]
[ROW][C]-697.154219614204[/C][/ROW]
[ROW][C]503.232458493765[/C][/ROW]
[ROW][C]71.87662664503[/C][/ROW]
[ROW][C]281.911849388512[/C][/ROW]
[ROW][C]-489.032016494618[/C][/ROW]
[ROW][C]193.076676888894[/C][/ROW]
[ROW][C]-25.2498303155063[/C][/ROW]
[ROW][C]323.896824876893[/C][/ROW]
[ROW][C]244.967277163432[/C][/ROW]
[ROW][C]103.610230114690[/C][/ROW]
[ROW][C]174.913113597548[/C][/ROW]
[ROW][C]388.326012528079[/C][/ROW]
[ROW][C]-707.55216303312[/C][/ROW]
[ROW][C]-337.295890353841[/C][/ROW]
[ROW][C]-168.827439144446[/C][/ROW]
[ROW][C]-436.186854161779[/C][/ROW]
[ROW][C]141.893443168281[/C][/ROW]
[ROW][C]-78.8848565398545[/C][/ROW]
[ROW][C]-166.345604080807[/C][/ROW]
[ROW][C]-498.627613769595[/C][/ROW]
[ROW][C]20.2462607785724[/C][/ROW]
[ROW][C]-174.847738087275[/C][/ROW]
[ROW][C]-105.246318313975[/C][/ROW]
[ROW][C]-449.981265811037[/C][/ROW]
[ROW][C]630.00102038713[/C][/ROW]
[ROW][C]705.330604290795[/C][/ROW]
[ROW][C]850.019600046071[/C][/ROW]
[ROW][C]-824.730104188337[/C][/ROW]
[ROW][C]265.346922705391[/C][/ROW]
[ROW][C]-48.914946832813[/C][/ROW]
[ROW][C]-565.095182576349[/C][/ROW]
[ROW][C]-330.293800830595[/C][/ROW]
[ROW][C]-93.106348999614[/C][/ROW]
[ROW][C]141.070839694021[/C][/ROW]
[ROW][C]-232.553838557796[/C][/ROW]
[ROW][C]-367.935768298412[/C][/ROW]
[/TABLE]
Source: https://freestatistics.org/blog/index.php?pk=114896&T=2

Globally Unique Identifier (entire table): ba.freestatistics.org/blog/index.php?pk=114896&T=2

As an alternative you can also use a QR Code:  

The GUIDs for individual cells are displayed in the table below:

Estimated ARIMA Residuals
Value
-38.280585724911
883.125488601703
1003.03330116253
271.904407345996
677.755570153788
-21.7980045286806
159.935518659290
119.185484208708
91.0060565547699
-257.060785380386
-96.7241006117712
571.695482654745
220.534689961848
231.627704806113
219.75346827961
198.599597291856
-162.891877823679
-33.1497972189062
291.435494308852
15.4765279943252
124.580479316824
461.872880402987
-264.653968529987
691.075456668285
-697.154219614204
503.232458493765
71.87662664503
281.911849388512
-489.032016494618
193.076676888894
-25.2498303155063
323.896824876893
244.967277163432
103.610230114690
174.913113597548
388.326012528079
-707.55216303312
-337.295890353841
-168.827439144446
-436.186854161779
141.893443168281
-78.8848565398545
-166.345604080807
-498.627613769595
20.2462607785724
-174.847738087275
-105.246318313975
-449.981265811037
630.00102038713
705.330604290795
850.019600046071
-824.730104188337
265.346922705391
-48.914946832813
-565.095182576349
-330.293800830595
-93.106348999614
141.070839694021
-232.553838557796
-367.935768298412


Parameters (Session):
par1 = FALSE ; par2 = 1 ; par3 = 1 ; par4 = 1 ; par5 = 12 ; par6 = 3 ; par7 = 1 ; par8 = 2 ; par9 = 1 ;
Parameters (R input):
par1 = FALSE ; par2 = 1 ; par3 = 1 ; par4 = 1 ; par5 = 12 ; par6 = 3 ; par7 = 1 ; par8 = 2 ; par9 = 1 ;
R code (references can be found in the software module):
library(lattice)
if (par1 == 'TRUE') par1 <- TRUE
if (par1 == 'FALSE') par1 <- FALSE
par2 <- as.numeric(par2) #Box-Cox lambda transformation parameter
par3 <- as.numeric(par3) #degree of non-seasonal differencing
par4 <- as.numeric(par4) #degree of seasonal differencing
par5 <- as.numeric(par5) #seasonal period
par6 <- as.numeric(par6) #degree (p) of the non-seasonal AR(p) polynomial
par7 <- as.numeric(par7) #degree (q) of the non-seasonal MA(q) polynomial
par8 <- as.numeric(par8) #degree (P) of the seasonal AR(P) polynomial
par9 <- as.numeric(par9) #degree (Q) of the seasonal MA(Q) polynomial
armaGR <- function(arima.out, names, n){
try1 <- arima.out$coef
try2 <- sqrt(diag(arima.out$var.coef))
try.data.frame <- data.frame(matrix(NA,ncol=4,nrow=length(names)))
dimnames(try.data.frame) <- list(names,c('coef','std','tstat','pv'))
try.data.frame[,1] <- try1
for(i in 1:length(try2)) try.data.frame[which(rownames(try.data.frame)==names(try2)[i]),2] <- try2[i]
try.data.frame[,3] <- try.data.frame[,1] / try.data.frame[,2]
try.data.frame[,4] <- round((1-pt(abs(try.data.frame[,3]),df=n-(length(try2)+1)))*2,5)
vector <- rep(NA,length(names))
vector[is.na(try.data.frame[,4])] <- 0
maxi <- which.max(try.data.frame[,4])
continue <- max(try.data.frame[,4],na.rm=TRUE) > .05
vector[maxi] <- 0
list(summary=try.data.frame,next.vector=vector,continue=continue)
}
arimaSelect <- function(series, order=c(13,0,0), seasonal=list(order=c(2,0,0),period=12), include.mean=F){
nrc <- order[1]+order[3]+seasonal$order[1]+seasonal$order[3]
coeff <- matrix(NA, nrow=nrc*2, ncol=nrc)
pval <- matrix(NA, nrow=nrc*2, ncol=nrc)
mylist <- rep(list(NULL), nrc)
names <- NULL
if(order[1] > 0) names <- paste('ar',1:order[1],sep='')
if(order[3] > 0) names <- c( names , paste('ma',1:order[3],sep='') )
if(seasonal$order[1] > 0) names <- c(names, paste('sar',1:seasonal$order[1],sep=''))
if(seasonal$order[3] > 0) names <- c(names, paste('sma',1:seasonal$order[3],sep=''))
arima.out <- arima(series, order=order, seasonal=seasonal, include.mean=include.mean, method='ML')
mylist[[1]] <- arima.out
last.arma <- armaGR(arima.out, names, length(series))
mystop <- FALSE
i <- 1
coeff[i,] <- last.arma[[1]][,1]
pval [i,] <- last.arma[[1]][,4]
i <- 2
aic <- arima.out$aic
while(!mystop){
mylist[[i]] <- arima.out
arima.out <- arima(series, order=order, seasonal=seasonal, include.mean=include.mean, method='ML', fixed=last.arma$next.vector)
aic <- c(aic, arima.out$aic)
last.arma <- armaGR(arima.out, names, length(series))
mystop <- !last.arma$continue
coeff[i,] <- last.arma[[1]][,1]
pval [i,] <- last.arma[[1]][,4]
i <- i+1
}
list(coeff, pval, mylist, aic=aic)
}
arimaSelectplot <- function(arimaSelect.out,noms,choix){
noms <- names(arimaSelect.out[[3]][[1]]$coef)
coeff <- arimaSelect.out[[1]]
k <- min(which(is.na(coeff[,1])))-1
coeff <- coeff[1:k,]
pval <- arimaSelect.out[[2]][1:k,]
aic <- arimaSelect.out$aic[1:k]
coeff[coeff==0] <- NA
n <- ncol(coeff)
if(missing(choix)) choix <- k
layout(matrix(c(1,1,1,2,
3,3,3,2,
3,3,3,4,
5,6,7,7),nr=4),
widths=c(10,35,45,15),
heights=c(30,30,15,15))
couleurs <- rainbow(75)[1:50]#(50)
ticks <- pretty(coeff)
par(mar=c(1,1,3,1))
plot(aic,k:1-.5,type='o',pch=21,bg='blue',cex=2,axes=F,lty=2,xpd=NA)
points(aic[choix],k-choix+.5,pch=21,cex=4,bg=2,xpd=NA)
title('aic',line=2)
par(mar=c(3,0,0,0))
plot(0,axes=F,xlab='',ylab='',xlim=range(ticks),ylim=c(.1,1))
rect(xleft = min(ticks) + (0:49)/50*(max(ticks)-min(ticks)),
xright = min(ticks) + (1:50)/50*(max(ticks)-min(ticks)),
ytop = rep(1,50),
ybottom= rep(0,50),col=couleurs,border=NA)
axis(1,ticks)
rect(xleft=min(ticks),xright=max(ticks),ytop=1,ybottom=0)
text(mean(coeff,na.rm=T),.5,'coefficients',cex=2,font=2)
par(mar=c(1,1,3,1))
image(1:n,1:k,t(coeff[k:1,]),axes=F,col=couleurs,zlim=range(ticks))
for(i in 1:n) for(j in 1:k) if(!is.na(coeff[j,i])) {
if(pval[j,i]<.01) symb = 'green'
else if( (pval[j,i]<.05) & (pval[j,i]>=.01)) symb = 'orange'
else if( (pval[j,i]<.1) & (pval[j,i]>=.05)) symb = 'red'
else symb = 'black'
polygon(c(i+.5 ,i+.2 ,i+.5 ,i+.5),
c(k-j+0.5,k-j+0.5,k-j+0.8,k-j+0.5),
col=symb)
if(j==choix) {
rect(xleft=i-.5,
xright=i+.5,
ybottom=k-j+1.5,
ytop=k-j+.5,
lwd=4)
text(i,
k-j+1,
round(coeff[j,i],2),
cex=1.2,
font=2)
}
else{
rect(xleft=i-.5,xright=i+.5,ybottom=k-j+1.5,ytop=k-j+.5)
text(i,k-j+1,round(coeff[j,i],2),cex=1.2,font=1)
}
}
axis(3,1:n,noms)
par(mar=c(0.5,0,0,0.5))
plot(0,axes=F,xlab='',ylab='',type='n',xlim=c(0,8),ylim=c(-.2,.8))
cols <- c('green','orange','red','black')
niv <- c('0','0.01','0.05','0.1')
for(i in 0:3){
polygon(c(1+2*i ,1+2*i ,1+2*i-.5 ,1+2*i),
c(.4 ,.7 , .4 , .4),
col=cols[i+1])
text(2*i,0.5,niv[i+1],cex=1.5)
}
text(8,.5,1,cex=1.5)
text(4,0,'p-value',cex=2)
box()
residus <- arimaSelect.out[[3]][[choix]]$res
par(mar=c(1,2,4,1))
acf(residus,main='')
title('acf',line=.5)
par(mar=c(1,2,4,1))
pacf(residus,main='')
title('pacf',line=.5)
par(mar=c(2,2,4,1))
qqnorm(residus,main='')
title('qq-norm',line=.5)
qqline(residus)
residus
}
if (par2 == 0) x <- log(x)
if (par2 != 0) x <- x^par2
(selection <- arimaSelect(x, order=c(par6,par3,par7), seasonal=list(order=c(par8,par4,par9), period=par5)))
bitmap(file='test1.png')
resid <- arimaSelectplot(selection)
dev.off()
resid
bitmap(file='test2.png')
acf(resid,length(resid)/2, main='Residual Autocorrelation Function')
dev.off()
bitmap(file='test3.png')
pacf(resid,length(resid)/2, main='Residual Partial Autocorrelation Function')
dev.off()
bitmap(file='test4.png')
cpgram(resid, main='Residual Cumulative Periodogram')
dev.off()
bitmap(file='test5.png')
hist(resid, main='Residual Histogram', xlab='values of Residuals')
dev.off()
bitmap(file='test6.png')
densityplot(~resid,col='black',main='Residual Density Plot', xlab='values of Residuals')
dev.off()
bitmap(file='test7.png')
qqnorm(resid, main='Residual Normal Q-Q Plot')
qqline(resid)
dev.off()
ncols <- length(selection[[1]][1,])
nrows <- length(selection[[2]][,1])-1
load(file='createtable')
a<-table.start()
a<-table.row.start(a)
a<-table.element(a,'ARIMA Parameter Estimation and Backward Selection', ncols+1,TRUE)
a<-table.row.end(a)
a<-table.row.start(a)
a<-table.element(a,'Iteration', header=TRUE)
for (i in 1:ncols) {
a<-table.element(a,names(selection[[3]][[1]]$coef)[i],header=TRUE)
}
a<-table.row.end(a)
for (j in 1:nrows) {
a<-table.row.start(a)
mydum <- 'Estimates ('
mydum <- paste(mydum,j)
mydum <- paste(mydum,')')
a<-table.element(a,mydum, header=TRUE)
for (i in 1:ncols) {
a<-table.element(a,round(selection[[1]][j,i],4))
}
a<-table.row.end(a)
a<-table.row.start(a)
a<-table.element(a,'(p-val)', header=TRUE)
for (i in 1:ncols) {
mydum <- '('
mydum <- paste(mydum,round(selection[[2]][j,i],4),sep='')
mydum <- paste(mydum,')')
a<-table.element(a,mydum)
}
a<-table.row.end(a)
}
a<-table.end(a)
table.save(a,file='mytable.tab')
a<-table.start()
a<-table.row.start(a)
a<-table.element(a,'Estimated ARIMA Residuals', 1,TRUE)
a<-table.row.end(a)
a<-table.row.start(a)
a<-table.element(a,'Value', 1,TRUE)
a<-table.row.end(a)
for (i in (par4*par5+par3):length(resid)) {
a<-table.row.start(a)
a<-table.element(a,resid[i])
a<-table.row.end(a)
}
a<-table.end(a)
table.save(a,file='mytable1.tab')