Free Statistics

of Irreproducible Research!

Author's title

Author*The author of this computation has been verified*
R Software Modulerwasp_spectrum.wasp
Title produced by softwareSpectral Analysis
Date of computationFri, 24 Dec 2010 13:06:50 +0000
Cite this page as followsStatistical Computations at FreeStatistics.org, Office for Research Development and Education, URL https://freestatistics.org/blog/index.php?v=date/2010/Dec/24/t1293195947j9s1ddalyrii2tr.htm/, Retrieved Tue, 30 Apr 2024 05:00:55 +0000
Statistical Computations at FreeStatistics.org, Office for Research Development and Education, URL https://freestatistics.org/blog/index.php?pk=114892, Retrieved Tue, 30 Apr 2024 05:00:55 +0000
QR Codes:

Original text written by user:
IsPrivate?No (this computation is public)
User-defined keywords
Estimated Impact124
Family? (F = Feedback message, R = changed R code, M = changed R Module, P = changed Parameters, D = changed Data)
-       [Spectral Analysis] [LKI Spectraal] [2010-12-24 13:06:50] [b6992a7b26e556359948e164e4227eba] [Current]
-         [Spectral Analysis] [Loonkost Index - ...] [2011-01-25 15:33:12] [49685effa955daf04c1708d99b86c41a]
Feedback Forum

Post a new message
Dataseries X:
81.71
87.703
90.09
100.639
83.042
89.956
89.561
105.38
86.554
93.131
92.812
102.195
88.925
94.184
94.196
108.932
91.134
97.149
96.415
112.432
92.47
98.61410515
97.80117197
111.8560178
95.63981455
104.1120262
104.0148224
118.1743476
102.033431
109.3138852
108.1523649
121.30381
103.8725146
112.7185207
109.0381253
122.4434864
106.6325686
113.8153852
111.1071252
130.039536
109.6121057
116.8592117
113.8982545
128.9375926
111.8120023
119.9689463
117.018539
132.4743387
116.3369106
124.6405636
121.025249
137.2054829
120.0187687
127.0443429
124.349043
143.6114438


Summary of computational transaction
Raw Inputview raw input (R code)
Raw Outputview raw output of R engine
Computing time1 seconds
R Server'Sir Ronald Aylmer Fisher' @ 193.190.124.24

\begin{tabular}{lllllllll}
\hline
Summary of computational transaction \tabularnewline
Raw Input & view raw input (R code)  \tabularnewline
Raw Output & view raw output of R engine  \tabularnewline
Computing time & 1 seconds \tabularnewline
R Server & 'Sir Ronald Aylmer Fisher' @ 193.190.124.24 \tabularnewline
\hline
\end{tabular}
%Source: https://freestatistics.org/blog/index.php?pk=114892&T=0

[TABLE]
[ROW][C]Summary of computational transaction[/C][/ROW]
[ROW][C]Raw Input[/C][C]view raw input (R code) [/C][/ROW]
[ROW][C]Raw Output[/C][C]view raw output of R engine [/C][/ROW]
[ROW][C]Computing time[/C][C]1 seconds[/C][/ROW]
[ROW][C]R Server[/C][C]'Sir Ronald Aylmer Fisher' @ 193.190.124.24[/C][/ROW]
[/TABLE]
Source: https://freestatistics.org/blog/index.php?pk=114892&T=0

Globally Unique Identifier (entire table): ba.freestatistics.org/blog/index.php?pk=114892&T=0

As an alternative you can also use a QR Code:  

The GUIDs for individual cells are displayed in the table below:

Summary of computational transaction
Raw Inputview raw input (R code)
Raw Outputview raw output of R engine
Computing time1 seconds
R Server'Sir Ronald Aylmer Fisher' @ 193.190.124.24


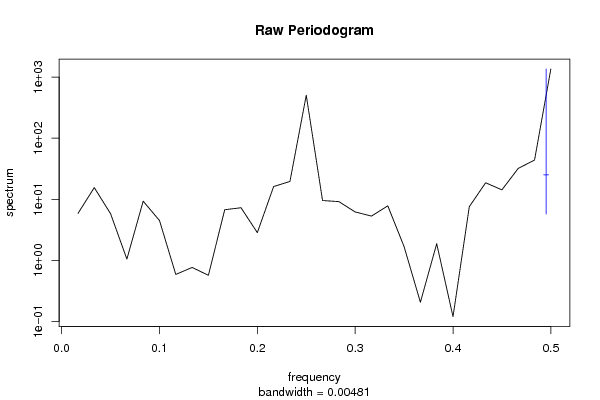
Raw Periodogram
ParameterValue
Box-Cox transformation parameter (lambda)1
Degree of non-seasonal differencing (d)0
Degree of seasonal differencing (D)0
Seasonal Period (s)4
Frequency (Period)Spectrum
0.0167 (60)5.852254
0.0333 (30)15.518101
0.05 (20)5.805349
0.0667 (15)1.046251
0.0833 (12)9.304812
0.1 (10)4.483948
0.1167 (8.5714)0.586431
0.1333 (7.5)0.76307
0.15 (6.6667)0.568305
0.1667 (6)6.736905
0.1833 (5.4545)7.260284
0.2 (5)2.83872
0.2167 (4.6154)16.15869
0.2333 (4.2857)19.578557
0.25 (4)506.165687
0.2667 (3.75)9.527145
0.2833 (3.5294)9.150432
0.3 (3.3333)6.192709
0.3167 (3.1579)5.301266
0.3333 (3)7.797172
0.35 (2.8571)1.673783
0.3667 (2.7273)0.20544
0.3833 (2.6087)1.869775
0.4 (2.5)0.11931
0.4167 (2.4)7.561547
0.4333 (2.3077)18.620025
0.45 (2.2222)14.260311
0.4667 (2.1429)32.06438
0.4833 (2.069)43.821037
0.5 (2)1364.356774

\begin{tabular}{lllllllll}
\hline
Raw Periodogram \tabularnewline
Parameter & Value \tabularnewline
Box-Cox transformation parameter (lambda) & 1 \tabularnewline
Degree of non-seasonal differencing (d) & 0 \tabularnewline
Degree of seasonal differencing (D) & 0 \tabularnewline
Seasonal Period (s) & 4 \tabularnewline
Frequency (Period) & Spectrum \tabularnewline
0.0167 (60) & 5.852254 \tabularnewline
0.0333 (30) & 15.518101 \tabularnewline
0.05 (20) & 5.805349 \tabularnewline
0.0667 (15) & 1.046251 \tabularnewline
0.0833 (12) & 9.304812 \tabularnewline
0.1 (10) & 4.483948 \tabularnewline
0.1167 (8.5714) & 0.586431 \tabularnewline
0.1333 (7.5) & 0.76307 \tabularnewline
0.15 (6.6667) & 0.568305 \tabularnewline
0.1667 (6) & 6.736905 \tabularnewline
0.1833 (5.4545) & 7.260284 \tabularnewline
0.2 (5) & 2.83872 \tabularnewline
0.2167 (4.6154) & 16.15869 \tabularnewline
0.2333 (4.2857) & 19.578557 \tabularnewline
0.25 (4) & 506.165687 \tabularnewline
0.2667 (3.75) & 9.527145 \tabularnewline
0.2833 (3.5294) & 9.150432 \tabularnewline
0.3 (3.3333) & 6.192709 \tabularnewline
0.3167 (3.1579) & 5.301266 \tabularnewline
0.3333 (3) & 7.797172 \tabularnewline
0.35 (2.8571) & 1.673783 \tabularnewline
0.3667 (2.7273) & 0.20544 \tabularnewline
0.3833 (2.6087) & 1.869775 \tabularnewline
0.4 (2.5) & 0.11931 \tabularnewline
0.4167 (2.4) & 7.561547 \tabularnewline
0.4333 (2.3077) & 18.620025 \tabularnewline
0.45 (2.2222) & 14.260311 \tabularnewline
0.4667 (2.1429) & 32.06438 \tabularnewline
0.4833 (2.069) & 43.821037 \tabularnewline
0.5 (2) & 1364.356774 \tabularnewline
\hline
\end{tabular}
%Source: https://freestatistics.org/blog/index.php?pk=114892&T=1

[TABLE]
[ROW][C]Raw Periodogram[/C][/ROW]
[ROW][C]Parameter[/C][C]Value[/C][/ROW]
[ROW][C]Box-Cox transformation parameter (lambda)[/C][C]1[/C][/ROW]
[ROW][C]Degree of non-seasonal differencing (d)[/C][C]0[/C][/ROW]
[ROW][C]Degree of seasonal differencing (D)[/C][C]0[/C][/ROW]
[ROW][C]Seasonal Period (s)[/C][C]4[/C][/ROW]
[ROW][C]Frequency (Period)[/C][C]Spectrum[/C][/ROW]
[ROW][C]0.0167 (60)[/C][C]5.852254[/C][/ROW]
[ROW][C]0.0333 (30)[/C][C]15.518101[/C][/ROW]
[ROW][C]0.05 (20)[/C][C]5.805349[/C][/ROW]
[ROW][C]0.0667 (15)[/C][C]1.046251[/C][/ROW]
[ROW][C]0.0833 (12)[/C][C]9.304812[/C][/ROW]
[ROW][C]0.1 (10)[/C][C]4.483948[/C][/ROW]
[ROW][C]0.1167 (8.5714)[/C][C]0.586431[/C][/ROW]
[ROW][C]0.1333 (7.5)[/C][C]0.76307[/C][/ROW]
[ROW][C]0.15 (6.6667)[/C][C]0.568305[/C][/ROW]
[ROW][C]0.1667 (6)[/C][C]6.736905[/C][/ROW]
[ROW][C]0.1833 (5.4545)[/C][C]7.260284[/C][/ROW]
[ROW][C]0.2 (5)[/C][C]2.83872[/C][/ROW]
[ROW][C]0.2167 (4.6154)[/C][C]16.15869[/C][/ROW]
[ROW][C]0.2333 (4.2857)[/C][C]19.578557[/C][/ROW]
[ROW][C]0.25 (4)[/C][C]506.165687[/C][/ROW]
[ROW][C]0.2667 (3.75)[/C][C]9.527145[/C][/ROW]
[ROW][C]0.2833 (3.5294)[/C][C]9.150432[/C][/ROW]
[ROW][C]0.3 (3.3333)[/C][C]6.192709[/C][/ROW]
[ROW][C]0.3167 (3.1579)[/C][C]5.301266[/C][/ROW]
[ROW][C]0.3333 (3)[/C][C]7.797172[/C][/ROW]
[ROW][C]0.35 (2.8571)[/C][C]1.673783[/C][/ROW]
[ROW][C]0.3667 (2.7273)[/C][C]0.20544[/C][/ROW]
[ROW][C]0.3833 (2.6087)[/C][C]1.869775[/C][/ROW]
[ROW][C]0.4 (2.5)[/C][C]0.11931[/C][/ROW]
[ROW][C]0.4167 (2.4)[/C][C]7.561547[/C][/ROW]
[ROW][C]0.4333 (2.3077)[/C][C]18.620025[/C][/ROW]
[ROW][C]0.45 (2.2222)[/C][C]14.260311[/C][/ROW]
[ROW][C]0.4667 (2.1429)[/C][C]32.06438[/C][/ROW]
[ROW][C]0.4833 (2.069)[/C][C]43.821037[/C][/ROW]
[ROW][C]0.5 (2)[/C][C]1364.356774[/C][/ROW]
[/TABLE]
Source: https://freestatistics.org/blog/index.php?pk=114892&T=1

Globally Unique Identifier (entire table): ba.freestatistics.org/blog/index.php?pk=114892&T=1

As an alternative you can also use a QR Code:  

The GUIDs for individual cells are displayed in the table below:

Raw Periodogram
ParameterValue
Box-Cox transformation parameter (lambda)1
Degree of non-seasonal differencing (d)0
Degree of seasonal differencing (D)0
Seasonal Period (s)4
Frequency (Period)Spectrum
0.0167 (60)5.852254
0.0333 (30)15.518101
0.05 (20)5.805349
0.0667 (15)1.046251
0.0833 (12)9.304812
0.1 (10)4.483948
0.1167 (8.5714)0.586431
0.1333 (7.5)0.76307
0.15 (6.6667)0.568305
0.1667 (6)6.736905
0.1833 (5.4545)7.260284
0.2 (5)2.83872
0.2167 (4.6154)16.15869
0.2333 (4.2857)19.578557
0.25 (4)506.165687
0.2667 (3.75)9.527145
0.2833 (3.5294)9.150432
0.3 (3.3333)6.192709
0.3167 (3.1579)5.301266
0.3333 (3)7.797172
0.35 (2.8571)1.673783
0.3667 (2.7273)0.20544
0.3833 (2.6087)1.869775
0.4 (2.5)0.11931
0.4167 (2.4)7.561547
0.4333 (2.3077)18.620025
0.45 (2.2222)14.260311
0.4667 (2.1429)32.06438
0.4833 (2.069)43.821037
0.5 (2)1364.356774


Parameters (Session):
par1 = 1 ; par2 = 0 ; par3 = 0 ; par4 = 4 ;
Parameters (R input):
par1 = 1 ; par2 = 0 ; par3 = 0 ; par4 = 4 ;
R code (references can be found in the software module):
par1 <- as.numeric(par1)
par2 <- as.numeric(par2)
par3 <- as.numeric(par3)
par4 <- as.numeric(par4)
if (par1 == 0) {
x <- log(x)
} else {
x <- (x ^ par1 - 1) / par1
}
if (par2 > 0) x <- diff(x,lag=1,difference=par2)
if (par3 > 0) x <- diff(x,lag=par4,difference=par3)
bitmap(file='test1.png')
r <- spectrum(x,main='Raw Periodogram')
dev.off()
bitmap(file='test2.png')
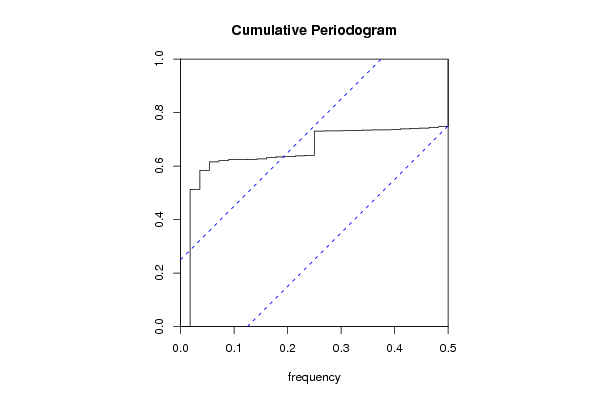
cpgram(x,main='Cumulative Periodogram')
dev.off()
load(file='createtable')
a<-table.start()
a<-table.row.start(a)
a<-table.element(a,'Raw Periodogram',2,TRUE)
a<-table.row.end(a)
a<-table.row.start(a)
a<-table.element(a,'Parameter',header=TRUE)
a<-table.element(a,'Value',header=TRUE)
a<-table.row.end(a)
a<-table.row.start(a)
a<-table.element(a,'Box-Cox transformation parameter (lambda)',header=TRUE)
a<-table.element(a,par1)
a<-table.row.end(a)
a<-table.row.start(a)
a<-table.element(a,'Degree of non-seasonal differencing (d)',header=TRUE)
a<-table.element(a,par2)
a<-table.row.end(a)
a<-table.row.start(a)
a<-table.element(a,'Degree of seasonal differencing (D)',header=TRUE)
a<-table.element(a,par3)
a<-table.row.end(a)
a<-table.row.start(a)
a<-table.element(a,'Seasonal Period (s)',header=TRUE)
a<-table.element(a,par4)
a<-table.row.end(a)
a<-table.row.start(a)
a<-table.element(a,'Frequency (Period)',header=TRUE)
a<-table.element(a,'Spectrum',header=TRUE)
a<-table.row.end(a)
for (i in 1:length(r$freq)) {
a<-table.row.start(a)
mylab <- round(r$freq[i],4)
mylab <- paste(mylab,' (',sep='')
mylab <- paste(mylab,round(1/r$freq[i],4),sep='')
mylab <- paste(mylab,')',sep='')
a<-table.element(a,mylab,header=TRUE)
a<-table.element(a,round(r$spec[i],6))
a<-table.row.end(a)
}
a<-table.end(a)
table.save(a,file='mytable.tab')