Free Statistics
of Irreproducible Research!
Description of Statistical Computation | ||||||||||||||||||||||||||||||
|---|---|---|---|---|---|---|---|---|---|---|---|---|---|---|---|---|---|---|---|---|---|---|---|---|---|---|---|---|---|---|
| Author's title | ||||||||||||||||||||||||||||||
| Author | *The author of this computation has been verified* | |||||||||||||||||||||||||||||
| R Software Module | rwasp_varia1.wasp | |||||||||||||||||||||||||||||
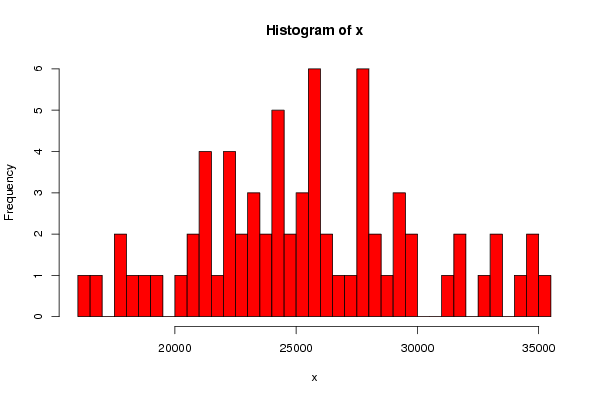
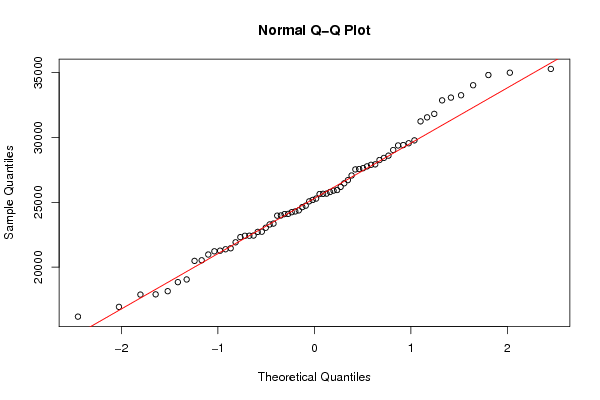
| Title produced by software | Histogram and QQplot | |||||||||||||||||||||||||||||
| Date of computation | Fri, 24 Dec 2010 12:57:52 +0000 | |||||||||||||||||||||||||||||
| Cite this page as follows | Statistical Computations at FreeStatistics.org, Office for Research Development and Education, URL https://freestatistics.org/blog/index.php?v=date/2010/Dec/24/t1293195347cagzdb90d24v11b.htm/, Retrieved Tue, 30 Apr 2024 06:12:48 +0000 | |||||||||||||||||||||||||||||
| Statistical Computations at FreeStatistics.org, Office for Research Development and Education, URL https://freestatistics.org/blog/index.php?pk=114883, Retrieved Tue, 30 Apr 2024 06:12:48 +0000 | ||||||||||||||||||||||||||||||
| QR Codes: | ||||||||||||||||||||||||||||||
|
| ||||||||||||||||||||||||||||||
| Original text written by user: | ||||||||||||||||||||||||||||||
| IsPrivate? | No (this computation is public) | |||||||||||||||||||||||||||||
| User-defined keywords | ||||||||||||||||||||||||||||||
| Estimated Impact | 139 | |||||||||||||||||||||||||||||
Tree of Dependent Computations | ||||||||||||||||||||||||||||||
| Family? (F = Feedback message, R = changed R code, M = changed R Module, P = changed Parameters, D = changed Data) | ||||||||||||||||||||||||||||||
| - [Histogram and QQplot] [] [2010-12-24 12:57:52] [afde384c4f4b6cc066f673fee2b73b52] [Current] | ||||||||||||||||||||||||||||||
| Feedback Forum | ||||||||||||||||||||||||||||||
Post a new message | ||||||||||||||||||||||||||||||
Dataset | ||||||||||||||||||||||||||||||
| Dataseries X: | ||||||||||||||||||||||||||||||
17885.8 16937.6 16184.9 18148.5 19053.2 20976.7 21272.7 22421.3 23294.5 24382.9 22426.1 20486.0 21382.5 17905.4 20531.3 21459.1 22317.6 23989.7 24632.0 26713.3 27570.6 29388.6 27775.1 24109. 25640.6 23038.9 22723.0 24241.5 25290.6 27071.0 28601.2 28424.5 29419.0 31555.4 29780.7 25656.6 26193.0 24095.9 22440.2 25951.7 27634.5 27930.6 31247.3 31823.7 33078.7 34032.4 28265.0 25079.5 24743.5 18845.5 21224.7 21920.6 22734.1 23972.8 25671.1 25798.1 27893.9 29557.8 27541.7 26470.1 25185.1 23363.8 24300.2 25905.7 29036.8 32866.5 33260.0 35288.5 34999.2 34820.2 | ||||||||||||||||||||||||||||||
Tables (Output of Computation) | ||||||||||||||||||||||||||||||
| ||||||||||||||||||||||||||||||
Figures (Output of Computation) | ||||||||||||||||||||||||||||||
Input Parameters & R Code | ||||||||||||||||||||||||||||||
| Parameters (Session): | ||||||||||||||||||||||||||||||
| par1 = 30 ; | ||||||||||||||||||||||||||||||
| Parameters (R input): | ||||||||||||||||||||||||||||||
| par1 = 30 ; | ||||||||||||||||||||||||||||||
| R code (references can be found in the software module): | ||||||||||||||||||||||||||||||
bitmap(file='test1.png') | ||||||||||||||||||||||||||||||