Free Statistics

of Irreproducible Research!

Author's title

Author*The author of this computation has been verified*
R Software Modulerwasp_arimaforecasting.wasp
Title produced by softwareARIMA Forecasting
Date of computationFri, 24 Dec 2010 12:55:35 +0000
Cite this page as followsStatistical Computations at FreeStatistics.org, Office for Research Development and Education, URL https://freestatistics.org/blog/index.php?v=date/2010/Dec/24/t1293195335a7hxdwkpse1cfsk.htm/, Retrieved Tue, 30 Apr 2024 00:50:01 +0000
Statistical Computations at FreeStatistics.org, Office for Research Development and Education, URL https://freestatistics.org/blog/index.php?pk=114882, Retrieved Tue, 30 Apr 2024 00:50:01 +0000
QR Codes:

Original text written by user:
IsPrivate?No (this computation is public)
User-defined keywords
Estimated Impact113
Family? (F = Feedback message, R = changed R code, M = changed R Module, P = changed Parameters, D = changed Data)
-       [ARIMA Forecasting] [ARIMA Forecasting...] [2010-12-24 12:55:35] [194b0dcd1d575718d8c1582a0112d12c] [Current]
Feedback Forum

Post a new message
Dataseries X:
4940
3924
3927
4535
3446
3016
4934
2743
3242
6662
3262
3381
7144
3803
3684
6759
3386
3066
5538
2940
3215
7023
3443
3712
7475
4137
3491
7019
3908
3402
5604
3222
3636
7123
4368
4092
8377
4595
4188
6988
4218
3655
6211
3622
3841
8510
4627
4582
8967
4928
4809
7917
4790
4065
7290
4670
3561
5149
6880
6981
8454
4960
4670
7638
4560
3980
6825
3939
4079
8117
5121
5167
7960
4670
4397
7191
4293
3747
6425
3709
3840
7642
4821
4865


Summary of computational transaction
Raw Inputview raw input (R code)
Raw Outputview raw output of R engine
Computing time2 seconds
R Server'Sir Ronald Aylmer Fisher' @ 193.190.124.24

\begin{tabular}{lllllllll}
\hline
Summary of computational transaction \tabularnewline
Raw Input & view raw input (R code)  \tabularnewline
Raw Output & view raw output of R engine  \tabularnewline
Computing time & 2 seconds \tabularnewline
R Server & 'Sir Ronald Aylmer Fisher' @ 193.190.124.24 \tabularnewline
\hline
\end{tabular}
%Source: https://freestatistics.org/blog/index.php?pk=114882&T=0

[TABLE]
[ROW][C]Summary of computational transaction[/C][/ROW]
[ROW][C]Raw Input[/C][C]view raw input (R code) [/C][/ROW]
[ROW][C]Raw Output[/C][C]view raw output of R engine [/C][/ROW]
[ROW][C]Computing time[/C][C]2 seconds[/C][/ROW]
[ROW][C]R Server[/C][C]'Sir Ronald Aylmer Fisher' @ 193.190.124.24[/C][/ROW]
[/TABLE]
Source: https://freestatistics.org/blog/index.php?pk=114882&T=0

Globally Unique Identifier (entire table): ba.freestatistics.org/blog/index.php?pk=114882&T=0

As an alternative you can also use a QR Code:  

The GUIDs for individual cells are displayed in the table below:

Summary of computational transaction
Raw Inputview raw input (R code)
Raw Outputview raw output of R engine
Computing time2 seconds
R Server'Sir Ronald Aylmer Fisher' @ 193.190.124.24


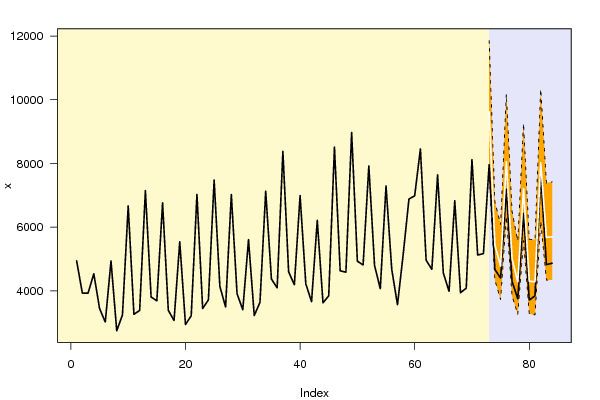
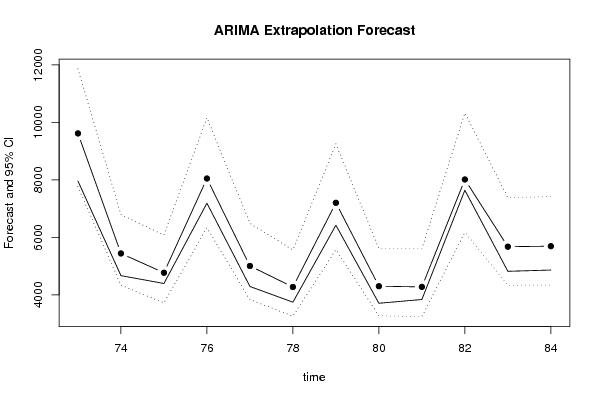
Univariate ARIMA Extrapolation Forecast
timeY[t]F[t]95% LB95% UBp-value(H0: Y[t] = F[t])P(F[t]>Y[t-1])P(F[t]>Y[t-s])P(F[t]>Y[72])
606981-------
618454-------
624960-------
634670-------
647638-------
654560-------
663980-------
676825.00000000001-------
683939-------
694079-------
708117.00000000001-------
715121-------
725167-------
7379609618.29297764.28511861.6430.07370.99990.84550.9999
7446705442.64434336.84516796.03260.13161e-040.75770.6551
7543974771.10693723.04856077.60240.28730.56030.56030.2763
7671918050.01666335.996610170.61270.21360.99960.64830.9961
7742935005.95943835.4416488.70790.1730.00190.72220.4157
7837474274.96773261.28085563.9050.2110.48910.67310.0875
7964257203.77815571.84169253.96220.22830.99950.64140.9742
8037094301.99983271.56725615.85010.18828e-040.70590.0985
8138404279.04923243.10335603.84970.2580.80050.61640.0945
8276428015.4486178.000910330.89330.3760.99980.46570.992
8348215677.56574334.19197384.71150.16270.01210.73860.7211
8448655694.24864339.34687418.67530.1730.83950.72550.7255

\begin{tabular}{lllllllll}
\hline
Univariate ARIMA Extrapolation Forecast \tabularnewline
time & Y[t] & F[t] & 95% LB & 95% UB & p-value(H0: Y[t] = F[t]) & P(F[t]>Y[t-1]) & P(F[t]>Y[t-s]) & P(F[t]>Y[72]) \tabularnewline
60 & 6981 & - & - & - & - & - & - & - \tabularnewline
61 & 8454 & - & - & - & - & - & - & - \tabularnewline
62 & 4960 & - & - & - & - & - & - & - \tabularnewline
63 & 4670 & - & - & - & - & - & - & - \tabularnewline
64 & 7638 & - & - & - & - & - & - & - \tabularnewline
65 & 4560 & - & - & - & - & - & - & - \tabularnewline
66 & 3980 & - & - & - & - & - & - & - \tabularnewline
67 & 6825.00000000001 & - & - & - & - & - & - & - \tabularnewline
68 & 3939 & - & - & - & - & - & - & - \tabularnewline
69 & 4079 & - & - & - & - & - & - & - \tabularnewline
70 & 8117.00000000001 & - & - & - & - & - & - & - \tabularnewline
71 & 5121 & - & - & - & - & - & - & - \tabularnewline
72 & 5167 & - & - & - & - & - & - & - \tabularnewline
73 & 7960 & 9618.2929 & 7764.285 & 11861.643 & 0.0737 & 0.9999 & 0.8455 & 0.9999 \tabularnewline
74 & 4670 & 5442.6443 & 4336.8451 & 6796.0326 & 0.1316 & 1e-04 & 0.7577 & 0.6551 \tabularnewline
75 & 4397 & 4771.1069 & 3723.0485 & 6077.6024 & 0.2873 & 0.5603 & 0.5603 & 0.2763 \tabularnewline
76 & 7191 & 8050.0166 & 6335.9966 & 10170.6127 & 0.2136 & 0.9996 & 0.6483 & 0.9961 \tabularnewline
77 & 4293 & 5005.9594 & 3835.441 & 6488.7079 & 0.173 & 0.0019 & 0.7222 & 0.4157 \tabularnewline
78 & 3747 & 4274.9677 & 3261.2808 & 5563.905 & 0.211 & 0.4891 & 0.6731 & 0.0875 \tabularnewline
79 & 6425 & 7203.7781 & 5571.8416 & 9253.9622 & 0.2283 & 0.9995 & 0.6414 & 0.9742 \tabularnewline
80 & 3709 & 4301.9998 & 3271.5672 & 5615.8501 & 0.1882 & 8e-04 & 0.7059 & 0.0985 \tabularnewline
81 & 3840 & 4279.0492 & 3243.1033 & 5603.8497 & 0.258 & 0.8005 & 0.6164 & 0.0945 \tabularnewline
82 & 7642 & 8015.448 & 6178.0009 & 10330.8933 & 0.376 & 0.9998 & 0.4657 & 0.992 \tabularnewline
83 & 4821 & 5677.5657 & 4334.1919 & 7384.7115 & 0.1627 & 0.0121 & 0.7386 & 0.7211 \tabularnewline
84 & 4865 & 5694.2486 & 4339.3468 & 7418.6753 & 0.173 & 0.8395 & 0.7255 & 0.7255 \tabularnewline
\hline
\end{tabular}
%Source: https://freestatistics.org/blog/index.php?pk=114882&T=1

[TABLE]
[ROW][C]Univariate ARIMA Extrapolation Forecast[/C][/ROW]
[ROW][C]time[/C][C]Y[t][/C][C]F[t][/C][C]95% LB[/C][C]95% UB[/C][C]p-value(H0: Y[t] = F[t])[/C][C]P(F[t]>Y[t-1])[/C][C]P(F[t]>Y[t-s])[/C][C]P(F[t]>Y[72])[/C][/ROW]
[ROW][C]60[/C][C]6981[/C][C]-[/C][C]-[/C][C]-[/C][C]-[/C][C]-[/C][C]-[/C][C]-[/C][/ROW]
[ROW][C]61[/C][C]8454[/C][C]-[/C][C]-[/C][C]-[/C][C]-[/C][C]-[/C][C]-[/C][C]-[/C][/ROW]
[ROW][C]62[/C][C]4960[/C][C]-[/C][C]-[/C][C]-[/C][C]-[/C][C]-[/C][C]-[/C][C]-[/C][/ROW]
[ROW][C]63[/C][C]4670[/C][C]-[/C][C]-[/C][C]-[/C][C]-[/C][C]-[/C][C]-[/C][C]-[/C][/ROW]
[ROW][C]64[/C][C]7638[/C][C]-[/C][C]-[/C][C]-[/C][C]-[/C][C]-[/C][C]-[/C][C]-[/C][/ROW]
[ROW][C]65[/C][C]4560[/C][C]-[/C][C]-[/C][C]-[/C][C]-[/C][C]-[/C][C]-[/C][C]-[/C][/ROW]
[ROW][C]66[/C][C]3980[/C][C]-[/C][C]-[/C][C]-[/C][C]-[/C][C]-[/C][C]-[/C][C]-[/C][/ROW]
[ROW][C]67[/C][C]6825.00000000001[/C][C]-[/C][C]-[/C][C]-[/C][C]-[/C][C]-[/C][C]-[/C][C]-[/C][/ROW]
[ROW][C]68[/C][C]3939[/C][C]-[/C][C]-[/C][C]-[/C][C]-[/C][C]-[/C][C]-[/C][C]-[/C][/ROW]
[ROW][C]69[/C][C]4079[/C][C]-[/C][C]-[/C][C]-[/C][C]-[/C][C]-[/C][C]-[/C][C]-[/C][/ROW]
[ROW][C]70[/C][C]8117.00000000001[/C][C]-[/C][C]-[/C][C]-[/C][C]-[/C][C]-[/C][C]-[/C][C]-[/C][/ROW]
[ROW][C]71[/C][C]5121[/C][C]-[/C][C]-[/C][C]-[/C][C]-[/C][C]-[/C][C]-[/C][C]-[/C][/ROW]
[ROW][C]72[/C][C]5167[/C][C]-[/C][C]-[/C][C]-[/C][C]-[/C][C]-[/C][C]-[/C][C]-[/C][/ROW]
[ROW][C]73[/C][C]7960[/C][C]9618.2929[/C][C]7764.285[/C][C]11861.643[/C][C]0.0737[/C][C]0.9999[/C][C]0.8455[/C][C]0.9999[/C][/ROW]
[ROW][C]74[/C][C]4670[/C][C]5442.6443[/C][C]4336.8451[/C][C]6796.0326[/C][C]0.1316[/C][C]1e-04[/C][C]0.7577[/C][C]0.6551[/C][/ROW]
[ROW][C]75[/C][C]4397[/C][C]4771.1069[/C][C]3723.0485[/C][C]6077.6024[/C][C]0.2873[/C][C]0.5603[/C][C]0.5603[/C][C]0.2763[/C][/ROW]
[ROW][C]76[/C][C]7191[/C][C]8050.0166[/C][C]6335.9966[/C][C]10170.6127[/C][C]0.2136[/C][C]0.9996[/C][C]0.6483[/C][C]0.9961[/C][/ROW]
[ROW][C]77[/C][C]4293[/C][C]5005.9594[/C][C]3835.441[/C][C]6488.7079[/C][C]0.173[/C][C]0.0019[/C][C]0.7222[/C][C]0.4157[/C][/ROW]
[ROW][C]78[/C][C]3747[/C][C]4274.9677[/C][C]3261.2808[/C][C]5563.905[/C][C]0.211[/C][C]0.4891[/C][C]0.6731[/C][C]0.0875[/C][/ROW]
[ROW][C]79[/C][C]6425[/C][C]7203.7781[/C][C]5571.8416[/C][C]9253.9622[/C][C]0.2283[/C][C]0.9995[/C][C]0.6414[/C][C]0.9742[/C][/ROW]
[ROW][C]80[/C][C]3709[/C][C]4301.9998[/C][C]3271.5672[/C][C]5615.8501[/C][C]0.1882[/C][C]8e-04[/C][C]0.7059[/C][C]0.0985[/C][/ROW]
[ROW][C]81[/C][C]3840[/C][C]4279.0492[/C][C]3243.1033[/C][C]5603.8497[/C][C]0.258[/C][C]0.8005[/C][C]0.6164[/C][C]0.0945[/C][/ROW]
[ROW][C]82[/C][C]7642[/C][C]8015.448[/C][C]6178.0009[/C][C]10330.8933[/C][C]0.376[/C][C]0.9998[/C][C]0.4657[/C][C]0.992[/C][/ROW]
[ROW][C]83[/C][C]4821[/C][C]5677.5657[/C][C]4334.1919[/C][C]7384.7115[/C][C]0.1627[/C][C]0.0121[/C][C]0.7386[/C][C]0.7211[/C][/ROW]
[ROW][C]84[/C][C]4865[/C][C]5694.2486[/C][C]4339.3468[/C][C]7418.6753[/C][C]0.173[/C][C]0.8395[/C][C]0.7255[/C][C]0.7255[/C][/ROW]
[/TABLE]
Source: https://freestatistics.org/blog/index.php?pk=114882&T=1

Globally Unique Identifier (entire table): ba.freestatistics.org/blog/index.php?pk=114882&T=1

As an alternative you can also use a QR Code:  

The GUIDs for individual cells are displayed in the table below:

Univariate ARIMA Extrapolation Forecast
timeY[t]F[t]95% LB95% UBp-value(H0: Y[t] = F[t])P(F[t]>Y[t-1])P(F[t]>Y[t-s])P(F[t]>Y[72])
606981-------
618454-------
624960-------
634670-------
647638-------
654560-------
663980-------
676825.00000000001-------
683939-------
694079-------
708117.00000000001-------
715121-------
725167-------
7379609618.29297764.28511861.6430.07370.99990.84550.9999
7446705442.64434336.84516796.03260.13161e-040.75770.6551
7543974771.10693723.04856077.60240.28730.56030.56030.2763
7671918050.01666335.996610170.61270.21360.99960.64830.9961
7742935005.95943835.4416488.70790.1730.00190.72220.4157
7837474274.96773261.28085563.9050.2110.48910.67310.0875
7964257203.77815571.84169253.96220.22830.99950.64140.9742
8037094301.99983271.56725615.85010.18828e-040.70590.0985
8138404279.04923243.10335603.84970.2580.80050.61640.0945
8276428015.4486178.000910330.89330.3760.99980.46570.992
8348215677.56574334.19197384.71150.16270.01210.73860.7211
8448655694.24864339.34687418.67530.1730.83950.72550.7255


Univariate ARIMA Extrapolation Forecast Performance
time% S.E.PEMAPESq.EMSERMSE
730.119-0.172402749935.35600
740.1269-0.1420.1572596979.25371673457.30491293.6218
750.1397-0.07840.1309139955.94331162290.18431078.0956
760.1344-0.10670.1249737909.51761056195.01771027.7135
770.1511-0.14240.1284508311.0401946618.2221972.9431
780.1538-0.12350.1276278749.8451835306.826913.9512
790.1452-0.10810.1248606495.3125802619.4669895.8903
800.1558-0.13780.1264351648.7615746248.1287863.8565
810.158-0.10260.1238192764.2375684749.9186827.4962
820.1474-0.04660.1161139463.4269630221.2694793.8648
830.1534-0.15090.1192733704.7283639628.8566799.768
840.1545-0.14560.1214687653.2479643630.8892802.2661

\begin{tabular}{lllllllll}
\hline
Univariate ARIMA Extrapolation Forecast Performance \tabularnewline
time & % S.E. & PE & MAPE & Sq.E & MSE & RMSE \tabularnewline
73 & 0.119 & -0.1724 & 0 & 2749935.356 & 0 & 0 \tabularnewline
74 & 0.1269 & -0.142 & 0.1572 & 596979.2537 & 1673457.3049 & 1293.6218 \tabularnewline
75 & 0.1397 & -0.0784 & 0.1309 & 139955.9433 & 1162290.1843 & 1078.0956 \tabularnewline
76 & 0.1344 & -0.1067 & 0.1249 & 737909.5176 & 1056195.0177 & 1027.7135 \tabularnewline
77 & 0.1511 & -0.1424 & 0.1284 & 508311.0401 & 946618.2221 & 972.9431 \tabularnewline
78 & 0.1538 & -0.1235 & 0.1276 & 278749.8451 & 835306.826 & 913.9512 \tabularnewline
79 & 0.1452 & -0.1081 & 0.1248 & 606495.3125 & 802619.4669 & 895.8903 \tabularnewline
80 & 0.1558 & -0.1378 & 0.1264 & 351648.7615 & 746248.1287 & 863.8565 \tabularnewline
81 & 0.158 & -0.1026 & 0.1238 & 192764.2375 & 684749.9186 & 827.4962 \tabularnewline
82 & 0.1474 & -0.0466 & 0.1161 & 139463.4269 & 630221.2694 & 793.8648 \tabularnewline
83 & 0.1534 & -0.1509 & 0.1192 & 733704.7283 & 639628.8566 & 799.768 \tabularnewline
84 & 0.1545 & -0.1456 & 0.1214 & 687653.2479 & 643630.8892 & 802.2661 \tabularnewline
\hline
\end{tabular}
%Source: https://freestatistics.org/blog/index.php?pk=114882&T=2

[TABLE]
[ROW][C]Univariate ARIMA Extrapolation Forecast Performance[/C][/ROW]
[ROW][C]time[/C][C]% S.E.[/C][C]PE[/C][C]MAPE[/C][C]Sq.E[/C][C]MSE[/C][C]RMSE[/C][/ROW]
[ROW][C]73[/C][C]0.119[/C][C]-0.1724[/C][C]0[/C][C]2749935.356[/C][C]0[/C][C]0[/C][/ROW]
[ROW][C]74[/C][C]0.1269[/C][C]-0.142[/C][C]0.1572[/C][C]596979.2537[/C][C]1673457.3049[/C][C]1293.6218[/C][/ROW]
[ROW][C]75[/C][C]0.1397[/C][C]-0.0784[/C][C]0.1309[/C][C]139955.9433[/C][C]1162290.1843[/C][C]1078.0956[/C][/ROW]
[ROW][C]76[/C][C]0.1344[/C][C]-0.1067[/C][C]0.1249[/C][C]737909.5176[/C][C]1056195.0177[/C][C]1027.7135[/C][/ROW]
[ROW][C]77[/C][C]0.1511[/C][C]-0.1424[/C][C]0.1284[/C][C]508311.0401[/C][C]946618.2221[/C][C]972.9431[/C][/ROW]
[ROW][C]78[/C][C]0.1538[/C][C]-0.1235[/C][C]0.1276[/C][C]278749.8451[/C][C]835306.826[/C][C]913.9512[/C][/ROW]
[ROW][C]79[/C][C]0.1452[/C][C]-0.1081[/C][C]0.1248[/C][C]606495.3125[/C][C]802619.4669[/C][C]895.8903[/C][/ROW]
[ROW][C]80[/C][C]0.1558[/C][C]-0.1378[/C][C]0.1264[/C][C]351648.7615[/C][C]746248.1287[/C][C]863.8565[/C][/ROW]
[ROW][C]81[/C][C]0.158[/C][C]-0.1026[/C][C]0.1238[/C][C]192764.2375[/C][C]684749.9186[/C][C]827.4962[/C][/ROW]
[ROW][C]82[/C][C]0.1474[/C][C]-0.0466[/C][C]0.1161[/C][C]139463.4269[/C][C]630221.2694[/C][C]793.8648[/C][/ROW]
[ROW][C]83[/C][C]0.1534[/C][C]-0.1509[/C][C]0.1192[/C][C]733704.7283[/C][C]639628.8566[/C][C]799.768[/C][/ROW]
[ROW][C]84[/C][C]0.1545[/C][C]-0.1456[/C][C]0.1214[/C][C]687653.2479[/C][C]643630.8892[/C][C]802.2661[/C][/ROW]
[/TABLE]
Source: https://freestatistics.org/blog/index.php?pk=114882&T=2

Globally Unique Identifier (entire table): ba.freestatistics.org/blog/index.php?pk=114882&T=2

As an alternative you can also use a QR Code:  

The GUIDs for individual cells are displayed in the table below:

Univariate ARIMA Extrapolation Forecast Performance
time% S.E.PEMAPESq.EMSERMSE
730.119-0.172402749935.35600
740.1269-0.1420.1572596979.25371673457.30491293.6218
750.1397-0.07840.1309139955.94331162290.18431078.0956
760.1344-0.10670.1249737909.51761056195.01771027.7135
770.1511-0.14240.1284508311.0401946618.2221972.9431
780.1538-0.12350.1276278749.8451835306.826913.9512
790.1452-0.10810.1248606495.3125802619.4669895.8903
800.1558-0.13780.1264351648.7615746248.1287863.8565
810.158-0.10260.1238192764.2375684749.9186827.4962
820.1474-0.04660.1161139463.4269630221.2694793.8648
830.1534-0.15090.1192733704.7283639628.8566799.768
840.1545-0.14560.1214687653.2479643630.8892802.2661


Parameters (Session):
par1 = 12 ; par2 = 0.1 ; par3 = 0 ; par4 = 1 ; par5 = 12 ; par6 = 3 ; par7 = 1 ; par8 = 0 ; par9 = 1 ; par10 = FALSE ;
Parameters (R input):
par1 = 12 ; par2 = 0.1 ; par3 = 0 ; par4 = 1 ; par5 = 12 ; par6 = 3 ; par7 = 1 ; par8 = 0 ; par9 = 1 ; par10 = FALSE ;
R code (references can be found in the software module):
par1 <- as.numeric(par1) #cut off periods
par2 <- as.numeric(par2) #lambda
par3 <- as.numeric(par3) #degree of non-seasonal differencing
par4 <- as.numeric(par4) #degree of seasonal differencing
par5 <- as.numeric(par5) #seasonal period
par6 <- as.numeric(par6) #p
par7 <- as.numeric(par7) #q
par8 <- as.numeric(par8) #P
par9 <- as.numeric(par9) #Q
if (par10 == 'TRUE') par10 <- TRUE
if (par10 == 'FALSE') par10 <- FALSE
if (par2 == 0) x <- log(x)
if (par2 != 0) x <- x^par2
lx <- length(x)
first <- lx - 2*par1
nx <- lx - par1
nx1 <- nx + 1
fx <- lx - nx
if (fx < 1) {
fx <- par5
nx1 <- lx + fx - 1
first <- lx - 2*fx
}
first <- 1
if (fx < 3) fx <- round(lx/10,0)
(arima.out <- arima(x[1:nx], order=c(par6,par3,par7), seasonal=list(order=c(par8,par4,par9), period=par5), include.mean=par10, method='ML'))
(forecast <- predict(arima.out,par1))
(lb <- forecast$pred - 1.96 * forecast$se)
(ub <- forecast$pred + 1.96 * forecast$se)
if (par2 == 0) {
x <- exp(x)
forecast$pred <- exp(forecast$pred)
lb <- exp(lb)
ub <- exp(ub)
}
if (par2 != 0) {
x <- x^(1/par2)
forecast$pred <- forecast$pred^(1/par2)
lb <- lb^(1/par2)
ub <- ub^(1/par2)
}
if (par2 < 0) {
olb <- lb
lb <- ub
ub <- olb
}
(actandfor <- c(x[1:nx], forecast$pred))
(perc.se <- (ub-forecast$pred)/1.96/forecast$pred)
bitmap(file='test1.png')
opar <- par(mar=c(4,4,2,2),las=1)
ylim <- c( min(x[first:nx],lb), max(x[first:nx],ub))
plot(x,ylim=ylim,type='n',xlim=c(first,lx))
usr <- par('usr')
rect(usr[1],usr[3],nx+1,usr[4],border=NA,col='lemonchiffon')
rect(nx1,usr[3],usr[2],usr[4],border=NA,col='lavender')
abline(h= (-3:3)*2 , col ='gray', lty =3)
polygon( c(nx1:lx,lx:nx1), c(lb,rev(ub)), col = 'orange', lty=2,border=NA)
lines(nx1:lx, lb , lty=2)
lines(nx1:lx, ub , lty=2)
lines(x, lwd=2)
lines(nx1:lx, forecast$pred , lwd=2 , col ='white')
box()
par(opar)
dev.off()
prob.dec <- array(NA, dim=fx)
prob.sdec <- array(NA, dim=fx)
prob.ldec <- array(NA, dim=fx)
prob.pval <- array(NA, dim=fx)
perf.pe <- array(0, dim=fx)
perf.mape <- array(0, dim=fx)
perf.mape1 <- array(0, dim=fx)
perf.se <- array(0, dim=fx)
perf.mse <- array(0, dim=fx)
perf.mse1 <- array(0, dim=fx)
perf.rmse <- array(0, dim=fx)
for (i in 1:fx) {
locSD <- (ub[i] - forecast$pred[i]) / 1.96
perf.pe[i] = (x[nx+i] - forecast$pred[i]) / forecast$pred[i]
perf.se[i] = (x[nx+i] - forecast$pred[i])^2
prob.dec[i] = pnorm((x[nx+i-1] - forecast$pred[i]) / locSD)
prob.sdec[i] = pnorm((x[nx+i-par5] - forecast$pred[i]) / locSD)
prob.ldec[i] = pnorm((x[nx] - forecast$pred[i]) / locSD)
prob.pval[i] = pnorm(abs(x[nx+i] - forecast$pred[i]) / locSD)
}
perf.mape[1] = abs(perf.pe[1])
perf.mse[1] = abs(perf.se[1])
for (i in 2:fx) {
perf.mape[i] = perf.mape[i-1] + abs(perf.pe[i])
perf.mape1[i] = perf.mape[i] / i
perf.mse[i] = perf.mse[i-1] + perf.se[i]
perf.mse1[i] = perf.mse[i] / i
}
perf.rmse = sqrt(perf.mse1)
bitmap(file='test2.png')
plot(forecast$pred, pch=19, type='b',main='ARIMA Extrapolation Forecast', ylab='Forecast and 95% CI', xlab='time',ylim=c(min(lb),max(ub)))
dum <- forecast$pred
dum[1:par1] <- x[(nx+1):lx]
lines(dum, lty=1)
lines(ub,lty=3)
lines(lb,lty=3)
dev.off()
load(file='createtable')
a<-table.start()
a<-table.row.start(a)
a<-table.element(a,'Univariate ARIMA Extrapolation Forecast',9,TRUE)
a<-table.row.end(a)
a<-table.row.start(a)
a<-table.element(a,'time',1,header=TRUE)
a<-table.element(a,'Y[t]',1,header=TRUE)
a<-table.element(a,'F[t]',1,header=TRUE)
a<-table.element(a,'95% LB',1,header=TRUE)
a<-table.element(a,'95% UB',1,header=TRUE)
a<-table.element(a,'p-value
(H0: Y[t] = F[t])',1,header=TRUE)
a<-table.element(a,'P(F[t]>Y[t-1])',1,header=TRUE)
a<-table.element(a,'P(F[t]>Y[t-s])',1,header=TRUE)
mylab <- paste('P(F[t]>Y[',nx,sep='')
mylab <- paste(mylab,'])',sep='')
a<-table.element(a,mylab,1,header=TRUE)
a<-table.row.end(a)
for (i in (nx-par5):nx) {
a<-table.row.start(a)
a<-table.element(a,i,header=TRUE)
a<-table.element(a,x[i])
a<-table.element(a,'-')
a<-table.row.end(a)
}
for (i in 1:fx) {
a<-table.row.start(a)
a<-table.element(a,nx+i,header=TRUE)
a<-table.element(a,round(x[nx+i],4))
a<-table.element(a,round(forecast$pred[i],4))
a<-table.element(a,round(lb[i],4))
a<-table.element(a,round(ub[i],4))
a<-table.element(a,round((1-prob.pval[i]),4))
a<-table.element(a,round((1-prob.dec[i]),4))
a<-table.element(a,round((1-prob.sdec[i]),4))
a<-table.element(a,round((1-prob.ldec[i]),4))
a<-table.row.end(a)
}
a<-table.end(a)
table.save(a,file='mytable.tab')
a<-table.start()
a<-table.row.start(a)
a<-table.element(a,'Univariate ARIMA Extrapolation Forecast Performance',7,TRUE)
a<-table.row.end(a)
a<-table.row.start(a)
a<-table.element(a,'time',1,header=TRUE)
a<-table.element(a,'% S.E.',1,header=TRUE)
a<-table.element(a,'PE',1,header=TRUE)
a<-table.element(a,'MAPE',1,header=TRUE)
a<-table.element(a,'Sq.E',1,header=TRUE)
a<-table.element(a,'MSE',1,header=TRUE)
a<-table.element(a,'RMSE',1,header=TRUE)
a<-table.row.end(a)
for (i in 1:fx) {
a<-table.row.start(a)
a<-table.element(a,nx+i,header=TRUE)
a<-table.element(a,round(perc.se[i],4))
a<-table.element(a,round(perf.pe[i],4))
a<-table.element(a,round(perf.mape1[i],4))
a<-table.element(a,round(perf.se[i],4))
a<-table.element(a,round(perf.mse1[i],4))
a<-table.element(a,round(perf.rmse[i],4))
a<-table.row.end(a)
}
a<-table.end(a)
table.save(a,file='mytable1.tab')