Free Statistics

of Irreproducible Research!

Author's title

Author*The author of this computation has been verified*
R Software Modulerwasp_correlation.wasp
Title produced by softwarePearson Correlation
Date of computationFri, 24 Dec 2010 12:42:17 +0000
Cite this page as followsStatistical Computations at FreeStatistics.org, Office for Research Development and Education, URL https://freestatistics.org/blog/index.php?v=date/2010/Dec/24/t1293194406rw8i8m15s5xxal8.htm/, Retrieved Tue, 30 Apr 2024 05:57:32 +0000
Statistical Computations at FreeStatistics.org, Office for Research Development and Education, URL https://freestatistics.org/blog/index.php?pk=114868, Retrieved Tue, 30 Apr 2024 05:57:32 +0000
QR Codes:

Original text written by user:
IsPrivate?No (this computation is public)
User-defined keywords
Estimated Impact131
Family? (F = Feedback message, R = changed R code, M = changed R Module, P = changed Parameters, D = changed Data)
-     [Pearson Correlation] [] [2009-12-17 08:46:05] [ebd107afac1bd6180acb277edd05815b]
-    D    [Pearson Correlation] [] [2010-12-24 12:42:17] [817f44ab92560f82acbc5e6c80d9a294] [Current]
Feedback Forum

Post a new message
Dataseries X:
19685.6
19601.7
16006.9
17681.2
19790.4
17014.2
17424.5
18908.9
15692.1
15160
15794.3
16032.1
16065
16236.8
12521
14762.1
15446.9
13635
14212.6
15021.7
14134.3
13721.4
14384.5
15638.6
19711.6
20359.8
16141.4
20056.9
20605.5
19325.8
20547.7
19211.2
19009.5
18746.8
16471.5
18957.2
20515.2
18374.4
16192.9
18147.5
19301.4
18344.7
17183.6
19630
17167.2
17428.5
16016.5
18466.5
18406.6
18174.1
14851.9
16260.7
18329.6
18003.8
15903.8
19554.2
16554.2
16198.9
16571.8
17535.2
16198.1
Dataseries Y:
377816406.3
356647002
274863241
295963853
367324056.5
292669977.8
312953790.3
348378492
252129938
256467413.2
283673174.8
255580971.6
281343592.9
264488421.6
184886567.3
204078367.4
240150810.2
193677322.2
205793370.3
248418577.7
211167398.6
227303867.6
250171162.2
295166144.2
417478883.3
453242810.3
331371053
406405440.3
443237230.2
387050537
461102612.9
409847878.1
362887260.2
407809752.5
324788879.6
381706091.3
411546139.6
322838243.3
269284818
316936127.3
342616398
329832817.7
279601873.7
365073627.6
281303338.4
304977325
261219941.3
319083196.4
312048692
295179888.6
245633525.3
230730024
313268760.4
304314069.2
253787202.5
387759110.6
278823204
285481574.4
323007161.8
311077878.8
231465796


Summary of computational transaction
Raw Inputview raw input (R code)
Raw Outputview raw output of R engine
Computing time2 seconds
R Server'Sir Ronald Aylmer Fisher' @ 193.190.124.24

\begin{tabular}{lllllllll}
\hline
Summary of computational transaction \tabularnewline
Raw Input & view raw input (R code)  \tabularnewline
Raw Output & view raw output of R engine  \tabularnewline
Computing time & 2 seconds \tabularnewline
R Server & 'Sir Ronald Aylmer Fisher' @ 193.190.124.24 \tabularnewline
\hline
\end{tabular}
%Source: https://freestatistics.org/blog/index.php?pk=114868&T=0

[TABLE]
[ROW][C]Summary of computational transaction[/C][/ROW]
[ROW][C]Raw Input[/C][C]view raw input (R code) [/C][/ROW]
[ROW][C]Raw Output[/C][C]view raw output of R engine [/C][/ROW]
[ROW][C]Computing time[/C][C]2 seconds[/C][/ROW]
[ROW][C]R Server[/C][C]'Sir Ronald Aylmer Fisher' @ 193.190.124.24[/C][/ROW]
[/TABLE]
Source: https://freestatistics.org/blog/index.php?pk=114868&T=0

Globally Unique Identifier (entire table): ba.freestatistics.org/blog/index.php?pk=114868&T=0

As an alternative you can also use a QR Code:  

The GUIDs for individual cells are displayed in the table below:

Summary of computational transaction
Raw Inputview raw input (R code)
Raw Outputview raw output of R engine
Computing time2 seconds
R Server'Sir Ronald Aylmer Fisher' @ 193.190.124.24


Pearson Product Moment Correlation - Ungrouped Data
StatisticVariable XVariable Y
Mean17262.7540983607308933329.201639
Biased Variance3939274.797893044443624720586042
Biased Standard Deviation1984.7606399495766660518.4542248
Covariance124326615231.524
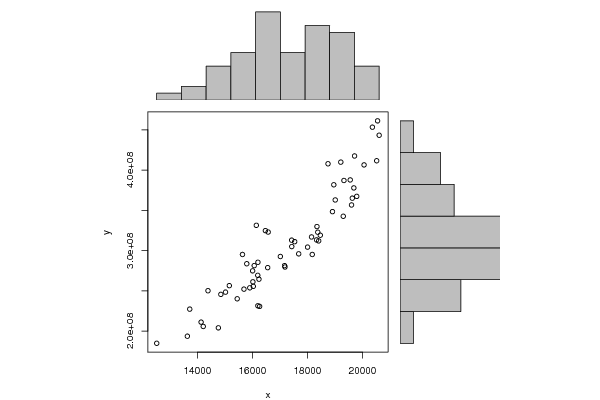
Correlation0.924290947806142
Determination0.854313756196376
T-Test18.600534856073
p-value (2 sided)0
p-value (1 sided)0
Degrees of Freedom59
Number of Observations61

\begin{tabular}{lllllllll}
\hline
Pearson Product Moment Correlation - Ungrouped Data \tabularnewline
Statistic & Variable X & Variable Y \tabularnewline
Mean & 17262.7540983607 & 308933329.201639 \tabularnewline
Biased Variance & 3939274.79789304 & 4443624720586042 \tabularnewline
Biased Standard Deviation & 1984.76063994957 & 66660518.4542248 \tabularnewline
Covariance & 124326615231.524 \tabularnewline
Correlation & 0.924290947806142 \tabularnewline
Determination & 0.854313756196376 \tabularnewline
T-Test & 18.600534856073 \tabularnewline
p-value (2 sided) & 0 \tabularnewline
p-value (1 sided) & 0 \tabularnewline
Degrees of Freedom & 59 \tabularnewline
Number of Observations & 61 \tabularnewline
\hline
\end{tabular}
%Source: https://freestatistics.org/blog/index.php?pk=114868&T=1

[TABLE]
[ROW][C]Pearson Product Moment Correlation - Ungrouped Data[/C][/ROW]
[ROW][C]Statistic[/C][C]Variable X[/C][C]Variable Y[/C][/ROW]
[ROW][C]Mean[/C][C]17262.7540983607[/C][C]308933329.201639[/C][/ROW]
[ROW][C]Biased Variance[/C][C]3939274.79789304[/C][C]4443624720586042[/C][/ROW]
[ROW][C]Biased Standard Deviation[/C][C]1984.76063994957[/C][C]66660518.4542248[/C][/ROW]
[ROW][C]Covariance[/C][C]124326615231.524[/C][/ROW]
[ROW][C]Correlation[/C][C]0.924290947806142[/C][/ROW]
[ROW][C]Determination[/C][C]0.854313756196376[/C][/ROW]
[ROW][C]T-Test[/C][C]18.600534856073[/C][/ROW]
[ROW][C]p-value (2 sided)[/C][C]0[/C][/ROW]
[ROW][C]p-value (1 sided)[/C][C]0[/C][/ROW]
[ROW][C]Degrees of Freedom[/C][C]59[/C][/ROW]
[ROW][C]Number of Observations[/C][C]61[/C][/ROW]
[/TABLE]
Source: https://freestatistics.org/blog/index.php?pk=114868&T=1

Globally Unique Identifier (entire table): ba.freestatistics.org/blog/index.php?pk=114868&T=1

As an alternative you can also use a QR Code:  

The GUIDs for individual cells are displayed in the table below:

Pearson Product Moment Correlation - Ungrouped Data
StatisticVariable XVariable Y
Mean17262.7540983607308933329.201639
Biased Variance3939274.797893044443624720586042
Biased Standard Deviation1984.7606399495766660518.4542248
Covariance124326615231.524
Correlation0.924290947806142
Determination0.854313756196376
T-Test18.600534856073
p-value (2 sided)0
p-value (1 sided)0
Degrees of Freedom59
Number of Observations61


Parameters (Session):
Parameters (R input):
R code (references can be found in the software module):
bitmap(file='test1.png')
histx <- hist(x, plot=FALSE)
histy <- hist(y, plot=FALSE)
maxcounts <- max(c(histx$counts, histx$counts))
xrange <- c(min(x),max(x))
yrange <- c(min(y),max(y))
nf <- layout(matrix(c(2,0,1,3),2,2,byrow=TRUE), c(3,1), c(1,3), TRUE)
par(mar=c(4,4,1,1))
plot(x, y, xlim=xrange, ylim=yrange, xlab=xlab, ylab=ylab)
par(mar=c(0,4,1,1))
barplot(histx$counts, axes=FALSE, ylim=c(0, maxcounts), space=0)
par(mar=c(4,0,1,1))
barplot(histy$counts, axes=FALSE, xlim=c(0, maxcounts), space=0, horiz=TRUE)
dev.off()
lx = length(x)
makebiased = (lx-1)/lx
varx = var(x)*makebiased
vary = var(y)*makebiased
corxy <- cor.test(x,y,method='pearson')
cxy <- as.matrix(corxy$estimate)[1,1]
load(file='createtable')
a<-table.start()
a<-table.row.start(a)
a<-table.element(a,'Pearson Product Moment Correlation - Ungrouped Data',3,TRUE)
a<-table.row.end(a)
a<-table.row.start(a)
a<-table.element(a,'Statistic',1,TRUE)
a<-table.element(a,'Variable X',1,TRUE)
a<-table.element(a,'Variable Y',1,TRUE)
a<-table.row.end(a)
a<-table.row.start(a)
a<-table.element(a,hyperlink('arithmetic_mean.htm','Mean',''),header=TRUE)
a<-table.element(a,mean(x))
a<-table.element(a,mean(y))
a<-table.row.end(a)
a<-table.row.start(a)
a<-table.element(a,hyperlink('biased.htm','Biased Variance',''),header=TRUE)
a<-table.element(a,varx)
a<-table.element(a,vary)
a<-table.row.end(a)
a<-table.row.start(a)
a<-table.element(a,hyperlink('biased1.htm','Biased Standard Deviation',''),header=TRUE)
a<-table.element(a,sqrt(varx))
a<-table.element(a,sqrt(vary))
a<-table.row.end(a)
a<-table.row.start(a)
a<-table.element(a,hyperlink('covariance.htm','Covariance',''),header=TRUE)
a<-table.element(a,cov(x,y),2)
a<-table.row.end(a)
a<-table.row.start(a)
a<-table.element(a,hyperlink('pearson_correlation.htm','Correlation',''),header=TRUE)
a<-table.element(a,cxy,2)
a<-table.row.end(a)
a<-table.row.start(a)
a<-table.element(a,hyperlink('coeff_of_determination.htm','Determination',''),header=TRUE)
a<-table.element(a,cxy*cxy,2)
a<-table.row.end(a)
a<-table.row.start(a)
a<-table.element(a,hyperlink('ttest_statistic.htm','T-Test',''),header=TRUE)
a<-table.element(a,as.matrix(corxy$statistic)[1,1],2)
a<-table.row.end(a)
a<-table.row.start(a)
a<-table.element(a,'p-value (2 sided)',header=TRUE)
a<-table.element(a,(p2 <- as.matrix(corxy$p.value)[1,1]),2)
a<-table.row.end(a)
a<-table.row.start(a)
a<-table.element(a,'p-value (1 sided)',header=TRUE)
a<-table.element(a,p2/2,2)
a<-table.row.end(a)
a<-table.row.start(a)
a<-table.element(a,'Degrees of Freedom',header=TRUE)
a<-table.element(a,lx-2,2)
a<-table.row.end(a)
a<-table.row.start(a)
a<-table.element(a,'Number of Observations',header=TRUE)
a<-table.element(a,lx,2)
a<-table.row.end(a)
a<-table.end(a)
table.save(a,file='mytable.tab')