Free Statistics

of Irreproducible Research!

Author's title

Author*The author of this computation has been verified*
R Software Modulerwasp_arimaforecasting.wasp
Title produced by softwareARIMA Forecasting
Date of computationFri, 24 Dec 2010 12:35:59 +0000
Cite this page as followsStatistical Computations at FreeStatistics.org, Office for Research Development and Education, URL https://freestatistics.org/blog/index.php?v=date/2010/Dec/24/t1293194064zs31snzwntgrijs.htm/, Retrieved Tue, 30 Apr 2024 02:26:22 +0000
Statistical Computations at FreeStatistics.org, Office for Research Development and Education, URL https://freestatistics.org/blog/index.php?pk=114857, Retrieved Tue, 30 Apr 2024 02:26:22 +0000
QR Codes:

Original text written by user:
IsPrivate?No (this computation is public)
User-defined keywords
Estimated Impact114
Family? (F = Feedback message, R = changed R code, M = changed R Module, P = changed Parameters, D = changed Data)
-     [ARIMA Forecasting] [] [2009-12-07 09:54:52] [b98453cac15ba1066b407e146608df68]
-   PD  [ARIMA Forecasting] [forecasting voor ...] [2009-12-19 12:03:00] [7773f496f69461f4a67891f0ef752622]
-   P     [ARIMA Forecasting] [Juiste Jonagold a...] [2009-12-20 19:32:16] [7773f496f69461f4a67891f0ef752622]
-   PD        [ARIMA Forecasting] [ARIMAKoffie2] [2010-12-24 12:35:59] [9be3691a9b6ce074cb51fd18377fce28] [Current]
Feedback Forum

Post a new message
Dataseries X:
7,14
7,24
7,33
7,61
7,66
7,69
7,7
7,68
7,71
7,71
7,72
7,68
7,72
7,74
7,76
7,9
7,97
7,96
7,95
7,97
7,93
7,99
7,96
7,92
7,97
7,98
8
8,04
8,17
8,29
8,26
8,3
8,32
8,28
8,27
8,32
8,31
8,34
8,32
8,36
8,33
8,35
8,34
8,37
8,31
8,33
8,34
8,25
8,27
8,31
8,25
8,3
8,3
8,35
8,78
8,9


Summary of computational transaction
Raw Inputview raw input (R code)
Raw Outputview raw output of R engine
Computing time2 seconds
R Server'RServer@AstonUniversity' @ vre.aston.ac.uk

\begin{tabular}{lllllllll}
\hline
Summary of computational transaction \tabularnewline
Raw Input & view raw input (R code)  \tabularnewline
Raw Output & view raw output of R engine  \tabularnewline
Computing time & 2 seconds \tabularnewline
R Server & 'RServer@AstonUniversity' @ vre.aston.ac.uk \tabularnewline
\hline
\end{tabular}
%Source: https://freestatistics.org/blog/index.php?pk=114857&T=0

[TABLE]
[ROW][C]Summary of computational transaction[/C][/ROW]
[ROW][C]Raw Input[/C][C]view raw input (R code) [/C][/ROW]
[ROW][C]Raw Output[/C][C]view raw output of R engine [/C][/ROW]
[ROW][C]Computing time[/C][C]2 seconds[/C][/ROW]
[ROW][C]R Server[/C][C]'RServer@AstonUniversity' @ vre.aston.ac.uk[/C][/ROW]
[/TABLE]
Source: https://freestatistics.org/blog/index.php?pk=114857&T=0

Globally Unique Identifier (entire table): ba.freestatistics.org/blog/index.php?pk=114857&T=0

As an alternative you can also use a QR Code:  

The GUIDs for individual cells are displayed in the table below:

Summary of computational transaction
Raw Inputview raw input (R code)
Raw Outputview raw output of R engine
Computing time2 seconds
R Server'RServer@AstonUniversity' @ vre.aston.ac.uk


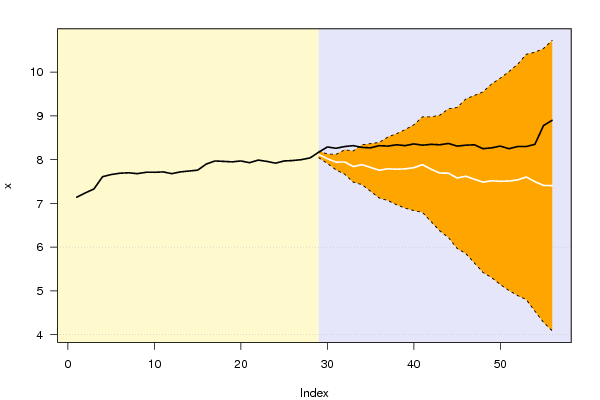
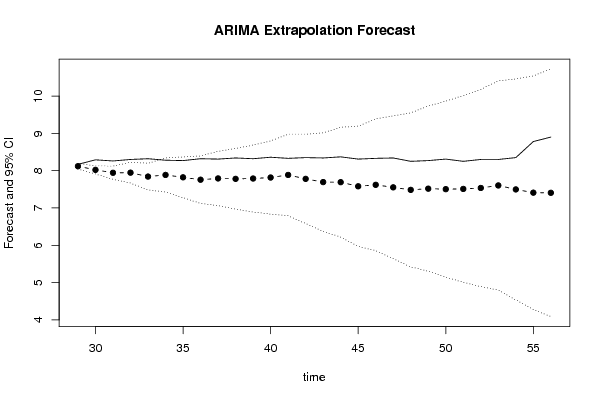
Univariate ARIMA Extrapolation Forecast
timeY[t]F[t]95% LB95% UBp-value(H0: Y[t] = F[t])P(F[t]>Y[t-1])P(F[t]>Y[t-s])P(F[t]>Y[28])
167.9-------
177.97-------
187.96-------
197.95-------
207.97-------
217.93-------
227.99-------
237.96-------
247.92-------
257.97-------
267.98-------
278-------
288.04-------
298.178.11928.04348.19490.09410.97980.99990.9798
308.298.02187.91328.130400.00380.86760.3713
318.267.94367.76698.12032e-041e-040.47160.1424
328.37.94657.66758.22540.00650.01380.43430.2555
338.327.84177.4858.19830.00430.00590.31360.1378
348.287.88567.438.34120.04490.03080.32670.2533
358.277.82167.27678.36660.05340.04960.30930.2161
368.327.75757.12218.3930.04140.0570.30810.1918
378.317.79187.06588.51780.08090.0770.31530.2514
388.347.78086.96888.59270.08850.10070.31530.2657
398.327.78976.89198.68760.12350.11480.32310.2924
408.367.81636.83628.79640.13850.15690.32730.3273
418.337.88566.7948.97720.21240.19710.30480.3908
428.357.78026.58268.97770.17550.18410.2020.3353
438.347.6946.37199.01620.16910.16540.20070.304
448.377.69136.22069.16210.18290.19370.20870.3211
458.317.58115.97089.19130.18750.16850.18420.2882
468.337.62075.85619.38530.21540.2220.2320.3207
478.347.55315.63929.4670.21020.21310.23140.309
488.257.48585.42199.54960.2340.20860.21410.2993
498.277.51755.30439.73080.25260.25830.24140.3218
508.317.50415.14599.86240.25150.26220.24360.328
518.257.51135.009310.01320.28140.26570.26320.3394
528.37.53624.894710.17780.28550.29820.27050.3543
538.37.60414.801510.40670.31320.31320.30580.3802
548.357.49764.538510.45670.28620.29750.28620.3597
558.787.41054.28110.53990.19550.27810.28020.3467
568.97.4074.088810.72520.18890.20870.28470.3542

\begin{tabular}{lllllllll}
\hline
Univariate ARIMA Extrapolation Forecast \tabularnewline
time & Y[t] & F[t] & 95% LB & 95% UB & p-value(H0: Y[t] = F[t]) & P(F[t]>Y[t-1]) & P(F[t]>Y[t-s]) & P(F[t]>Y[28]) \tabularnewline
16 & 7.9 & - & - & - & - & - & - & - \tabularnewline
17 & 7.97 & - & - & - & - & - & - & - \tabularnewline
18 & 7.96 & - & - & - & - & - & - & - \tabularnewline
19 & 7.95 & - & - & - & - & - & - & - \tabularnewline
20 & 7.97 & - & - & - & - & - & - & - \tabularnewline
21 & 7.93 & - & - & - & - & - & - & - \tabularnewline
22 & 7.99 & - & - & - & - & - & - & - \tabularnewline
23 & 7.96 & - & - & - & - & - & - & - \tabularnewline
24 & 7.92 & - & - & - & - & - & - & - \tabularnewline
25 & 7.97 & - & - & - & - & - & - & - \tabularnewline
26 & 7.98 & - & - & - & - & - & - & - \tabularnewline
27 & 8 & - & - & - & - & - & - & - \tabularnewline
28 & 8.04 & - & - & - & - & - & - & - \tabularnewline
29 & 8.17 & 8.1192 & 8.0434 & 8.1949 & 0.0941 & 0.9798 & 0.9999 & 0.9798 \tabularnewline
30 & 8.29 & 8.0218 & 7.9132 & 8.1304 & 0 & 0.0038 & 0.8676 & 0.3713 \tabularnewline
31 & 8.26 & 7.9436 & 7.7669 & 8.1203 & 2e-04 & 1e-04 & 0.4716 & 0.1424 \tabularnewline
32 & 8.3 & 7.9465 & 7.6675 & 8.2254 & 0.0065 & 0.0138 & 0.4343 & 0.2555 \tabularnewline
33 & 8.32 & 7.8417 & 7.485 & 8.1983 & 0.0043 & 0.0059 & 0.3136 & 0.1378 \tabularnewline
34 & 8.28 & 7.8856 & 7.43 & 8.3412 & 0.0449 & 0.0308 & 0.3267 & 0.2533 \tabularnewline
35 & 8.27 & 7.8216 & 7.2767 & 8.3666 & 0.0534 & 0.0496 & 0.3093 & 0.2161 \tabularnewline
36 & 8.32 & 7.7575 & 7.1221 & 8.393 & 0.0414 & 0.057 & 0.3081 & 0.1918 \tabularnewline
37 & 8.31 & 7.7918 & 7.0658 & 8.5178 & 0.0809 & 0.077 & 0.3153 & 0.2514 \tabularnewline
38 & 8.34 & 7.7808 & 6.9688 & 8.5927 & 0.0885 & 0.1007 & 0.3153 & 0.2657 \tabularnewline
39 & 8.32 & 7.7897 & 6.8919 & 8.6876 & 0.1235 & 0.1148 & 0.3231 & 0.2924 \tabularnewline
40 & 8.36 & 7.8163 & 6.8362 & 8.7964 & 0.1385 & 0.1569 & 0.3273 & 0.3273 \tabularnewline
41 & 8.33 & 7.8856 & 6.794 & 8.9772 & 0.2124 & 0.1971 & 0.3048 & 0.3908 \tabularnewline
42 & 8.35 & 7.7802 & 6.5826 & 8.9777 & 0.1755 & 0.1841 & 0.202 & 0.3353 \tabularnewline
43 & 8.34 & 7.694 & 6.3719 & 9.0162 & 0.1691 & 0.1654 & 0.2007 & 0.304 \tabularnewline
44 & 8.37 & 7.6913 & 6.2206 & 9.1621 & 0.1829 & 0.1937 & 0.2087 & 0.3211 \tabularnewline
45 & 8.31 & 7.5811 & 5.9708 & 9.1913 & 0.1875 & 0.1685 & 0.1842 & 0.2882 \tabularnewline
46 & 8.33 & 7.6207 & 5.8561 & 9.3853 & 0.2154 & 0.222 & 0.232 & 0.3207 \tabularnewline
47 & 8.34 & 7.5531 & 5.6392 & 9.467 & 0.2102 & 0.2131 & 0.2314 & 0.309 \tabularnewline
48 & 8.25 & 7.4858 & 5.4219 & 9.5496 & 0.234 & 0.2086 & 0.2141 & 0.2993 \tabularnewline
49 & 8.27 & 7.5175 & 5.3043 & 9.7308 & 0.2526 & 0.2583 & 0.2414 & 0.3218 \tabularnewline
50 & 8.31 & 7.5041 & 5.1459 & 9.8624 & 0.2515 & 0.2622 & 0.2436 & 0.328 \tabularnewline
51 & 8.25 & 7.5113 & 5.0093 & 10.0132 & 0.2814 & 0.2657 & 0.2632 & 0.3394 \tabularnewline
52 & 8.3 & 7.5362 & 4.8947 & 10.1778 & 0.2855 & 0.2982 & 0.2705 & 0.3543 \tabularnewline
53 & 8.3 & 7.6041 & 4.8015 & 10.4067 & 0.3132 & 0.3132 & 0.3058 & 0.3802 \tabularnewline
54 & 8.35 & 7.4976 & 4.5385 & 10.4567 & 0.2862 & 0.2975 & 0.2862 & 0.3597 \tabularnewline
55 & 8.78 & 7.4105 & 4.281 & 10.5399 & 0.1955 & 0.2781 & 0.2802 & 0.3467 \tabularnewline
56 & 8.9 & 7.407 & 4.0888 & 10.7252 & 0.1889 & 0.2087 & 0.2847 & 0.3542 \tabularnewline
\hline
\end{tabular}
%Source: https://freestatistics.org/blog/index.php?pk=114857&T=1

[TABLE]
[ROW][C]Univariate ARIMA Extrapolation Forecast[/C][/ROW]
[ROW][C]time[/C][C]Y[t][/C][C]F[t][/C][C]95% LB[/C][C]95% UB[/C][C]p-value(H0: Y[t] = F[t])[/C][C]P(F[t]>Y[t-1])[/C][C]P(F[t]>Y[t-s])[/C][C]P(F[t]>Y[28])[/C][/ROW]
[ROW][C]16[/C][C]7.9[/C][C]-[/C][C]-[/C][C]-[/C][C]-[/C][C]-[/C][C]-[/C][C]-[/C][/ROW]
[ROW][C]17[/C][C]7.97[/C][C]-[/C][C]-[/C][C]-[/C][C]-[/C][C]-[/C][C]-[/C][C]-[/C][/ROW]
[ROW][C]18[/C][C]7.96[/C][C]-[/C][C]-[/C][C]-[/C][C]-[/C][C]-[/C][C]-[/C][C]-[/C][/ROW]
[ROW][C]19[/C][C]7.95[/C][C]-[/C][C]-[/C][C]-[/C][C]-[/C][C]-[/C][C]-[/C][C]-[/C][/ROW]
[ROW][C]20[/C][C]7.97[/C][C]-[/C][C]-[/C][C]-[/C][C]-[/C][C]-[/C][C]-[/C][C]-[/C][/ROW]
[ROW][C]21[/C][C]7.93[/C][C]-[/C][C]-[/C][C]-[/C][C]-[/C][C]-[/C][C]-[/C][C]-[/C][/ROW]
[ROW][C]22[/C][C]7.99[/C][C]-[/C][C]-[/C][C]-[/C][C]-[/C][C]-[/C][C]-[/C][C]-[/C][/ROW]
[ROW][C]23[/C][C]7.96[/C][C]-[/C][C]-[/C][C]-[/C][C]-[/C][C]-[/C][C]-[/C][C]-[/C][/ROW]
[ROW][C]24[/C][C]7.92[/C][C]-[/C][C]-[/C][C]-[/C][C]-[/C][C]-[/C][C]-[/C][C]-[/C][/ROW]
[ROW][C]25[/C][C]7.97[/C][C]-[/C][C]-[/C][C]-[/C][C]-[/C][C]-[/C][C]-[/C][C]-[/C][/ROW]
[ROW][C]26[/C][C]7.98[/C][C]-[/C][C]-[/C][C]-[/C][C]-[/C][C]-[/C][C]-[/C][C]-[/C][/ROW]
[ROW][C]27[/C][C]8[/C][C]-[/C][C]-[/C][C]-[/C][C]-[/C][C]-[/C][C]-[/C][C]-[/C][/ROW]
[ROW][C]28[/C][C]8.04[/C][C]-[/C][C]-[/C][C]-[/C][C]-[/C][C]-[/C][C]-[/C][C]-[/C][/ROW]
[ROW][C]29[/C][C]8.17[/C][C]8.1192[/C][C]8.0434[/C][C]8.1949[/C][C]0.0941[/C][C]0.9798[/C][C]0.9999[/C][C]0.9798[/C][/ROW]
[ROW][C]30[/C][C]8.29[/C][C]8.0218[/C][C]7.9132[/C][C]8.1304[/C][C]0[/C][C]0.0038[/C][C]0.8676[/C][C]0.3713[/C][/ROW]
[ROW][C]31[/C][C]8.26[/C][C]7.9436[/C][C]7.7669[/C][C]8.1203[/C][C]2e-04[/C][C]1e-04[/C][C]0.4716[/C][C]0.1424[/C][/ROW]
[ROW][C]32[/C][C]8.3[/C][C]7.9465[/C][C]7.6675[/C][C]8.2254[/C][C]0.0065[/C][C]0.0138[/C][C]0.4343[/C][C]0.2555[/C][/ROW]
[ROW][C]33[/C][C]8.32[/C][C]7.8417[/C][C]7.485[/C][C]8.1983[/C][C]0.0043[/C][C]0.0059[/C][C]0.3136[/C][C]0.1378[/C][/ROW]
[ROW][C]34[/C][C]8.28[/C][C]7.8856[/C][C]7.43[/C][C]8.3412[/C][C]0.0449[/C][C]0.0308[/C][C]0.3267[/C][C]0.2533[/C][/ROW]
[ROW][C]35[/C][C]8.27[/C][C]7.8216[/C][C]7.2767[/C][C]8.3666[/C][C]0.0534[/C][C]0.0496[/C][C]0.3093[/C][C]0.2161[/C][/ROW]
[ROW][C]36[/C][C]8.32[/C][C]7.7575[/C][C]7.1221[/C][C]8.393[/C][C]0.0414[/C][C]0.057[/C][C]0.3081[/C][C]0.1918[/C][/ROW]
[ROW][C]37[/C][C]8.31[/C][C]7.7918[/C][C]7.0658[/C][C]8.5178[/C][C]0.0809[/C][C]0.077[/C][C]0.3153[/C][C]0.2514[/C][/ROW]
[ROW][C]38[/C][C]8.34[/C][C]7.7808[/C][C]6.9688[/C][C]8.5927[/C][C]0.0885[/C][C]0.1007[/C][C]0.3153[/C][C]0.2657[/C][/ROW]
[ROW][C]39[/C][C]8.32[/C][C]7.7897[/C][C]6.8919[/C][C]8.6876[/C][C]0.1235[/C][C]0.1148[/C][C]0.3231[/C][C]0.2924[/C][/ROW]
[ROW][C]40[/C][C]8.36[/C][C]7.8163[/C][C]6.8362[/C][C]8.7964[/C][C]0.1385[/C][C]0.1569[/C][C]0.3273[/C][C]0.3273[/C][/ROW]
[ROW][C]41[/C][C]8.33[/C][C]7.8856[/C][C]6.794[/C][C]8.9772[/C][C]0.2124[/C][C]0.1971[/C][C]0.3048[/C][C]0.3908[/C][/ROW]
[ROW][C]42[/C][C]8.35[/C][C]7.7802[/C][C]6.5826[/C][C]8.9777[/C][C]0.1755[/C][C]0.1841[/C][C]0.202[/C][C]0.3353[/C][/ROW]
[ROW][C]43[/C][C]8.34[/C][C]7.694[/C][C]6.3719[/C][C]9.0162[/C][C]0.1691[/C][C]0.1654[/C][C]0.2007[/C][C]0.304[/C][/ROW]
[ROW][C]44[/C][C]8.37[/C][C]7.6913[/C][C]6.2206[/C][C]9.1621[/C][C]0.1829[/C][C]0.1937[/C][C]0.2087[/C][C]0.3211[/C][/ROW]
[ROW][C]45[/C][C]8.31[/C][C]7.5811[/C][C]5.9708[/C][C]9.1913[/C][C]0.1875[/C][C]0.1685[/C][C]0.1842[/C][C]0.2882[/C][/ROW]
[ROW][C]46[/C][C]8.33[/C][C]7.6207[/C][C]5.8561[/C][C]9.3853[/C][C]0.2154[/C][C]0.222[/C][C]0.232[/C][C]0.3207[/C][/ROW]
[ROW][C]47[/C][C]8.34[/C][C]7.5531[/C][C]5.6392[/C][C]9.467[/C][C]0.2102[/C][C]0.2131[/C][C]0.2314[/C][C]0.309[/C][/ROW]
[ROW][C]48[/C][C]8.25[/C][C]7.4858[/C][C]5.4219[/C][C]9.5496[/C][C]0.234[/C][C]0.2086[/C][C]0.2141[/C][C]0.2993[/C][/ROW]
[ROW][C]49[/C][C]8.27[/C][C]7.5175[/C][C]5.3043[/C][C]9.7308[/C][C]0.2526[/C][C]0.2583[/C][C]0.2414[/C][C]0.3218[/C][/ROW]
[ROW][C]50[/C][C]8.31[/C][C]7.5041[/C][C]5.1459[/C][C]9.8624[/C][C]0.2515[/C][C]0.2622[/C][C]0.2436[/C][C]0.328[/C][/ROW]
[ROW][C]51[/C][C]8.25[/C][C]7.5113[/C][C]5.0093[/C][C]10.0132[/C][C]0.2814[/C][C]0.2657[/C][C]0.2632[/C][C]0.3394[/C][/ROW]
[ROW][C]52[/C][C]8.3[/C][C]7.5362[/C][C]4.8947[/C][C]10.1778[/C][C]0.2855[/C][C]0.2982[/C][C]0.2705[/C][C]0.3543[/C][/ROW]
[ROW][C]53[/C][C]8.3[/C][C]7.6041[/C][C]4.8015[/C][C]10.4067[/C][C]0.3132[/C][C]0.3132[/C][C]0.3058[/C][C]0.3802[/C][/ROW]
[ROW][C]54[/C][C]8.35[/C][C]7.4976[/C][C]4.5385[/C][C]10.4567[/C][C]0.2862[/C][C]0.2975[/C][C]0.2862[/C][C]0.3597[/C][/ROW]
[ROW][C]55[/C][C]8.78[/C][C]7.4105[/C][C]4.281[/C][C]10.5399[/C][C]0.1955[/C][C]0.2781[/C][C]0.2802[/C][C]0.3467[/C][/ROW]
[ROW][C]56[/C][C]8.9[/C][C]7.407[/C][C]4.0888[/C][C]10.7252[/C][C]0.1889[/C][C]0.2087[/C][C]0.2847[/C][C]0.3542[/C][/ROW]
[/TABLE]
Source: https://freestatistics.org/blog/index.php?pk=114857&T=1

Globally Unique Identifier (entire table): ba.freestatistics.org/blog/index.php?pk=114857&T=1

As an alternative you can also use a QR Code:  

The GUIDs for individual cells are displayed in the table below:

Univariate ARIMA Extrapolation Forecast
timeY[t]F[t]95% LB95% UBp-value(H0: Y[t] = F[t])P(F[t]>Y[t-1])P(F[t]>Y[t-s])P(F[t]>Y[28])
167.9-------
177.97-------
187.96-------
197.95-------
207.97-------
217.93-------
227.99-------
237.96-------
247.92-------
257.97-------
267.98-------
278-------
288.04-------
298.178.11928.04348.19490.09410.97980.99990.9798
308.298.02187.91328.130400.00380.86760.3713
318.267.94367.76698.12032e-041e-040.47160.1424
328.37.94657.66758.22540.00650.01380.43430.2555
338.327.84177.4858.19830.00430.00590.31360.1378
348.287.88567.438.34120.04490.03080.32670.2533
358.277.82167.27678.36660.05340.04960.30930.2161
368.327.75757.12218.3930.04140.0570.30810.1918
378.317.79187.06588.51780.08090.0770.31530.2514
388.347.78086.96888.59270.08850.10070.31530.2657
398.327.78976.89198.68760.12350.11480.32310.2924
408.367.81636.83628.79640.13850.15690.32730.3273
418.337.88566.7948.97720.21240.19710.30480.3908
428.357.78026.58268.97770.17550.18410.2020.3353
438.347.6946.37199.01620.16910.16540.20070.304
448.377.69136.22069.16210.18290.19370.20870.3211
458.317.58115.97089.19130.18750.16850.18420.2882
468.337.62075.85619.38530.21540.2220.2320.3207
478.347.55315.63929.4670.21020.21310.23140.309
488.257.48585.42199.54960.2340.20860.21410.2993
498.277.51755.30439.73080.25260.25830.24140.3218
508.317.50415.14599.86240.25150.26220.24360.328
518.257.51135.009310.01320.28140.26570.26320.3394
528.37.53624.894710.17780.28550.29820.27050.3543
538.37.60414.801510.40670.31320.31320.30580.3802
548.357.49764.538510.45670.28620.29750.28620.3597
558.787.41054.28110.53990.19550.27810.28020.3467
568.97.4074.088810.72520.18890.20870.28470.3542


Univariate ARIMA Extrapolation Forecast Performance
time% S.E.PEMAPESq.EMSERMSE
290.00480.006300.002600
300.00690.03340.01980.07190.03730.193
310.01130.03980.02650.10010.05820.2413
320.01790.04450.0310.1250.07490.2737
330.02320.0610.0370.22880.10570.3251
340.02950.050.03920.15550.1140.3376
350.03550.05730.04180.2010.12640.3556
360.04180.07250.04560.31640.15020.3875
370.04750.06650.04790.26850.16330.4041
380.05320.07190.05030.31270.17830.4222
390.05880.06810.05190.28120.18760.4332
400.0640.06960.05340.29560.19660.4434
410.07060.05640.05360.19750.19670.4435
420.07850.07320.0550.32470.20580.4537
430.08770.0840.0570.41730.21990.469
440.09760.08820.05890.46060.2350.4847
450.10840.09620.06110.53140.25240.5024
460.11810.09310.06290.50310.26630.5161
470.12930.10420.06510.61920.28490.5338
480.14070.10210.06690.58410.29990.5476
490.15020.10010.06850.56620.31250.5591
500.16030.10740.07030.64940.32790.5726
510.16990.09840.07150.54570.33730.5808
520.17880.10130.07270.58330.34760.5896
530.1880.09150.07350.48430.3530.5942
540.20140.11370.0750.72660.36740.6061
550.21550.18480.07911.87570.42330.6506
560.22860.20160.08352.22920.48780.6984

\begin{tabular}{lllllllll}
\hline
Univariate ARIMA Extrapolation Forecast Performance \tabularnewline
time & % S.E. & PE & MAPE & Sq.E & MSE & RMSE \tabularnewline
29 & 0.0048 & 0.0063 & 0 & 0.0026 & 0 & 0 \tabularnewline
30 & 0.0069 & 0.0334 & 0.0198 & 0.0719 & 0.0373 & 0.193 \tabularnewline
31 & 0.0113 & 0.0398 & 0.0265 & 0.1001 & 0.0582 & 0.2413 \tabularnewline
32 & 0.0179 & 0.0445 & 0.031 & 0.125 & 0.0749 & 0.2737 \tabularnewline
33 & 0.0232 & 0.061 & 0.037 & 0.2288 & 0.1057 & 0.3251 \tabularnewline
34 & 0.0295 & 0.05 & 0.0392 & 0.1555 & 0.114 & 0.3376 \tabularnewline
35 & 0.0355 & 0.0573 & 0.0418 & 0.201 & 0.1264 & 0.3556 \tabularnewline
36 & 0.0418 & 0.0725 & 0.0456 & 0.3164 & 0.1502 & 0.3875 \tabularnewline
37 & 0.0475 & 0.0665 & 0.0479 & 0.2685 & 0.1633 & 0.4041 \tabularnewline
38 & 0.0532 & 0.0719 & 0.0503 & 0.3127 & 0.1783 & 0.4222 \tabularnewline
39 & 0.0588 & 0.0681 & 0.0519 & 0.2812 & 0.1876 & 0.4332 \tabularnewline
40 & 0.064 & 0.0696 & 0.0534 & 0.2956 & 0.1966 & 0.4434 \tabularnewline
41 & 0.0706 & 0.0564 & 0.0536 & 0.1975 & 0.1967 & 0.4435 \tabularnewline
42 & 0.0785 & 0.0732 & 0.055 & 0.3247 & 0.2058 & 0.4537 \tabularnewline
43 & 0.0877 & 0.084 & 0.057 & 0.4173 & 0.2199 & 0.469 \tabularnewline
44 & 0.0976 & 0.0882 & 0.0589 & 0.4606 & 0.235 & 0.4847 \tabularnewline
45 & 0.1084 & 0.0962 & 0.0611 & 0.5314 & 0.2524 & 0.5024 \tabularnewline
46 & 0.1181 & 0.0931 & 0.0629 & 0.5031 & 0.2663 & 0.5161 \tabularnewline
47 & 0.1293 & 0.1042 & 0.0651 & 0.6192 & 0.2849 & 0.5338 \tabularnewline
48 & 0.1407 & 0.1021 & 0.0669 & 0.5841 & 0.2999 & 0.5476 \tabularnewline
49 & 0.1502 & 0.1001 & 0.0685 & 0.5662 & 0.3125 & 0.5591 \tabularnewline
50 & 0.1603 & 0.1074 & 0.0703 & 0.6494 & 0.3279 & 0.5726 \tabularnewline
51 & 0.1699 & 0.0984 & 0.0715 & 0.5457 & 0.3373 & 0.5808 \tabularnewline
52 & 0.1788 & 0.1013 & 0.0727 & 0.5833 & 0.3476 & 0.5896 \tabularnewline
53 & 0.188 & 0.0915 & 0.0735 & 0.4843 & 0.353 & 0.5942 \tabularnewline
54 & 0.2014 & 0.1137 & 0.075 & 0.7266 & 0.3674 & 0.6061 \tabularnewline
55 & 0.2155 & 0.1848 & 0.0791 & 1.8757 & 0.4233 & 0.6506 \tabularnewline
56 & 0.2286 & 0.2016 & 0.0835 & 2.2292 & 0.4878 & 0.6984 \tabularnewline
\hline
\end{tabular}
%Source: https://freestatistics.org/blog/index.php?pk=114857&T=2

[TABLE]
[ROW][C]Univariate ARIMA Extrapolation Forecast Performance[/C][/ROW]
[ROW][C]time[/C][C]% S.E.[/C][C]PE[/C][C]MAPE[/C][C]Sq.E[/C][C]MSE[/C][C]RMSE[/C][/ROW]
[ROW][C]29[/C][C]0.0048[/C][C]0.0063[/C][C]0[/C][C]0.0026[/C][C]0[/C][C]0[/C][/ROW]
[ROW][C]30[/C][C]0.0069[/C][C]0.0334[/C][C]0.0198[/C][C]0.0719[/C][C]0.0373[/C][C]0.193[/C][/ROW]
[ROW][C]31[/C][C]0.0113[/C][C]0.0398[/C][C]0.0265[/C][C]0.1001[/C][C]0.0582[/C][C]0.2413[/C][/ROW]
[ROW][C]32[/C][C]0.0179[/C][C]0.0445[/C][C]0.031[/C][C]0.125[/C][C]0.0749[/C][C]0.2737[/C][/ROW]
[ROW][C]33[/C][C]0.0232[/C][C]0.061[/C][C]0.037[/C][C]0.2288[/C][C]0.1057[/C][C]0.3251[/C][/ROW]
[ROW][C]34[/C][C]0.0295[/C][C]0.05[/C][C]0.0392[/C][C]0.1555[/C][C]0.114[/C][C]0.3376[/C][/ROW]
[ROW][C]35[/C][C]0.0355[/C][C]0.0573[/C][C]0.0418[/C][C]0.201[/C][C]0.1264[/C][C]0.3556[/C][/ROW]
[ROW][C]36[/C][C]0.0418[/C][C]0.0725[/C][C]0.0456[/C][C]0.3164[/C][C]0.1502[/C][C]0.3875[/C][/ROW]
[ROW][C]37[/C][C]0.0475[/C][C]0.0665[/C][C]0.0479[/C][C]0.2685[/C][C]0.1633[/C][C]0.4041[/C][/ROW]
[ROW][C]38[/C][C]0.0532[/C][C]0.0719[/C][C]0.0503[/C][C]0.3127[/C][C]0.1783[/C][C]0.4222[/C][/ROW]
[ROW][C]39[/C][C]0.0588[/C][C]0.0681[/C][C]0.0519[/C][C]0.2812[/C][C]0.1876[/C][C]0.4332[/C][/ROW]
[ROW][C]40[/C][C]0.064[/C][C]0.0696[/C][C]0.0534[/C][C]0.2956[/C][C]0.1966[/C][C]0.4434[/C][/ROW]
[ROW][C]41[/C][C]0.0706[/C][C]0.0564[/C][C]0.0536[/C][C]0.1975[/C][C]0.1967[/C][C]0.4435[/C][/ROW]
[ROW][C]42[/C][C]0.0785[/C][C]0.0732[/C][C]0.055[/C][C]0.3247[/C][C]0.2058[/C][C]0.4537[/C][/ROW]
[ROW][C]43[/C][C]0.0877[/C][C]0.084[/C][C]0.057[/C][C]0.4173[/C][C]0.2199[/C][C]0.469[/C][/ROW]
[ROW][C]44[/C][C]0.0976[/C][C]0.0882[/C][C]0.0589[/C][C]0.4606[/C][C]0.235[/C][C]0.4847[/C][/ROW]
[ROW][C]45[/C][C]0.1084[/C][C]0.0962[/C][C]0.0611[/C][C]0.5314[/C][C]0.2524[/C][C]0.5024[/C][/ROW]
[ROW][C]46[/C][C]0.1181[/C][C]0.0931[/C][C]0.0629[/C][C]0.5031[/C][C]0.2663[/C][C]0.5161[/C][/ROW]
[ROW][C]47[/C][C]0.1293[/C][C]0.1042[/C][C]0.0651[/C][C]0.6192[/C][C]0.2849[/C][C]0.5338[/C][/ROW]
[ROW][C]48[/C][C]0.1407[/C][C]0.1021[/C][C]0.0669[/C][C]0.5841[/C][C]0.2999[/C][C]0.5476[/C][/ROW]
[ROW][C]49[/C][C]0.1502[/C][C]0.1001[/C][C]0.0685[/C][C]0.5662[/C][C]0.3125[/C][C]0.5591[/C][/ROW]
[ROW][C]50[/C][C]0.1603[/C][C]0.1074[/C][C]0.0703[/C][C]0.6494[/C][C]0.3279[/C][C]0.5726[/C][/ROW]
[ROW][C]51[/C][C]0.1699[/C][C]0.0984[/C][C]0.0715[/C][C]0.5457[/C][C]0.3373[/C][C]0.5808[/C][/ROW]
[ROW][C]52[/C][C]0.1788[/C][C]0.1013[/C][C]0.0727[/C][C]0.5833[/C][C]0.3476[/C][C]0.5896[/C][/ROW]
[ROW][C]53[/C][C]0.188[/C][C]0.0915[/C][C]0.0735[/C][C]0.4843[/C][C]0.353[/C][C]0.5942[/C][/ROW]
[ROW][C]54[/C][C]0.2014[/C][C]0.1137[/C][C]0.075[/C][C]0.7266[/C][C]0.3674[/C][C]0.6061[/C][/ROW]
[ROW][C]55[/C][C]0.2155[/C][C]0.1848[/C][C]0.0791[/C][C]1.8757[/C][C]0.4233[/C][C]0.6506[/C][/ROW]
[ROW][C]56[/C][C]0.2286[/C][C]0.2016[/C][C]0.0835[/C][C]2.2292[/C][C]0.4878[/C][C]0.6984[/C][/ROW]
[/TABLE]
Source: https://freestatistics.org/blog/index.php?pk=114857&T=2

Globally Unique Identifier (entire table): ba.freestatistics.org/blog/index.php?pk=114857&T=2

As an alternative you can also use a QR Code:  

The GUIDs for individual cells are displayed in the table below:

Univariate ARIMA Extrapolation Forecast Performance
time% S.E.PEMAPESq.EMSERMSE
290.00480.006300.002600
300.00690.03340.01980.07190.03730.193
310.01130.03980.02650.10010.05820.2413
320.01790.04450.0310.1250.07490.2737
330.02320.0610.0370.22880.10570.3251
340.02950.050.03920.15550.1140.3376
350.03550.05730.04180.2010.12640.3556
360.04180.07250.04560.31640.15020.3875
370.04750.06650.04790.26850.16330.4041
380.05320.07190.05030.31270.17830.4222
390.05880.06810.05190.28120.18760.4332
400.0640.06960.05340.29560.19660.4434
410.07060.05640.05360.19750.19670.4435
420.07850.07320.0550.32470.20580.4537
430.08770.0840.0570.41730.21990.469
440.09760.08820.05890.46060.2350.4847
450.10840.09620.06110.53140.25240.5024
460.11810.09310.06290.50310.26630.5161
470.12930.10420.06510.61920.28490.5338
480.14070.10210.06690.58410.29990.5476
490.15020.10010.06850.56620.31250.5591
500.16030.10740.07030.64940.32790.5726
510.16990.09840.07150.54570.33730.5808
520.17880.10130.07270.58330.34760.5896
530.1880.09150.07350.48430.3530.5942
540.20140.11370.0750.72660.36740.6061
550.21550.18480.07911.87570.42330.6506
560.22860.20160.08352.22920.48780.6984


Parameters (Session):
par1 = 24 ; par2 = 1 ; par3 = 1 ; par4 = 1 ; par5 = 12 ; par6 = 0 ; par7 = 0 ; par8 = 0 ; par9 = 0 ; par10 = FALSE ;
Parameters (R input):
par1 = 24 ; par2 = 1 ; par3 = 1 ; par4 = 1 ; par5 = 12 ; par6 = 0 ; par7 = 0 ; par8 = 0 ; par9 = 0 ; par10 = FALSE ;
R code (references can be found in the software module):
par1 <- as.numeric(par1) #cut off periods
par1 <- 28
par2 <- as.numeric(par2) #lambda
par3 <- as.numeric(par3) #degree of non-seasonal differencing
par4 <- as.numeric(par4) #degree of seasonal differencing
par5 <- as.numeric(par5) #seasonal period
par6 <- as.numeric(par6) #p
par6 <- 3
par7 <- as.numeric(par7) #q
par7 <- 3
par8 <- as.numeric(par8) #P
par9 <- as.numeric(par9) #Q
if (par10 == 'TRUE') par10 <- TRUE
if (par10 == 'FALSE') par10 <- FALSE
if (par2 == 0) x <- log(x)
if (par2 != 0) x <- x^par2
lx <- length(x)
first <- lx - 2*par1
nx <- lx - par1
nx1 <- nx + 1
fx <- lx - nx
if (fx < 1) {
fx <- par5
nx1 <- lx + fx - 1
first <- lx - 2*fx
}
first <- 1
if (fx < 3) fx <- round(lx/10,0)
(arima.out <- arima(x[1:nx], order=c(par6,par3,par7), seasonal=list(order=c(par8,par4,par9), period=par5), include.mean=par10, method='ML'))
(forecast <- predict(arima.out,par1))
(lb <- forecast$pred - 1.96 * forecast$se)
(ub <- forecast$pred + 1.96 * forecast$se)
if (par2 == 0) {
x <- exp(x)
forecast$pred <- exp(forecast$pred)
lb <- exp(lb)
ub <- exp(ub)
}
if (par2 != 0) {
x <- x^(1/par2)
forecast$pred <- forecast$pred^(1/par2)
lb <- lb^(1/par2)
ub <- ub^(1/par2)
}
if (par2 < 0) {
olb <- lb
lb <- ub
ub <- olb
}
(actandfor <- c(x[1:nx], forecast$pred))
(perc.se <- (ub-forecast$pred)/1.96/forecast$pred)
bitmap(file='test1.png')
opar <- par(mar=c(4,4,2,2),las=1)
ylim <- c( min(x[first:nx],lb), max(x[first:nx],ub))
plot(x,ylim=ylim,type='n',xlim=c(first,lx))
usr <- par('usr')
rect(usr[1],usr[3],nx+1,usr[4],border=NA,col='lemonchiffon')
rect(nx1,usr[3],usr[2],usr[4],border=NA,col='lavender')
abline(h= (-3:3)*2 , col ='gray', lty =3)
polygon( c(nx1:lx,lx:nx1), c(lb,rev(ub)), col = 'orange', lty=2,border=NA)
lines(nx1:lx, lb , lty=2)
lines(nx1:lx, ub , lty=2)
lines(x, lwd=2)
lines(nx1:lx, forecast$pred , lwd=2 , col ='white')
box()
par(opar)
dev.off()
prob.dec <- array(NA, dim=fx)
prob.sdec <- array(NA, dim=fx)
prob.ldec <- array(NA, dim=fx)
prob.pval <- array(NA, dim=fx)
perf.pe <- array(0, dim=fx)
perf.mape <- array(0, dim=fx)
perf.mape1 <- array(0, dim=fx)
perf.se <- array(0, dim=fx)
perf.mse <- array(0, dim=fx)
perf.mse1 <- array(0, dim=fx)
perf.rmse <- array(0, dim=fx)
for (i in 1:fx) {
locSD <- (ub[i] - forecast$pred[i]) / 1.96
perf.pe[i] = (x[nx+i] - forecast$pred[i]) / forecast$pred[i]
perf.se[i] = (x[nx+i] - forecast$pred[i])^2
prob.dec[i] = pnorm((x[nx+i-1] - forecast$pred[i]) / locSD)
prob.sdec[i] = pnorm((x[nx+i-par5] - forecast$pred[i]) / locSD)
prob.ldec[i] = pnorm((x[nx] - forecast$pred[i]) / locSD)
prob.pval[i] = pnorm(abs(x[nx+i] - forecast$pred[i]) / locSD)
}
perf.mape[1] = abs(perf.pe[1])
perf.mse[1] = abs(perf.se[1])
for (i in 2:fx) {
perf.mape[i] = perf.mape[i-1] + abs(perf.pe[i])
perf.mape1[i] = perf.mape[i] / i
perf.mse[i] = perf.mse[i-1] + perf.se[i]
perf.mse1[i] = perf.mse[i] / i
}
perf.rmse = sqrt(perf.mse1)
bitmap(file='test2.png')
plot(forecast$pred, pch=19, type='b',main='ARIMA Extrapolation Forecast', ylab='Forecast and 95% CI', xlab='time',ylim=c(min(lb),max(ub)))
dum <- forecast$pred
dum[1:par1] <- x[(nx+1):lx]
lines(dum, lty=1)
lines(ub,lty=3)
lines(lb,lty=3)
dev.off()
load(file='createtable')
a<-table.start()
a<-table.row.start(a)
a<-table.element(a,'Univariate ARIMA Extrapolation Forecast',9,TRUE)
a<-table.row.end(a)
a<-table.row.start(a)
a<-table.element(a,'time',1,header=TRUE)
a<-table.element(a,'Y[t]',1,header=TRUE)
a<-table.element(a,'F[t]',1,header=TRUE)
a<-table.element(a,'95% LB',1,header=TRUE)
a<-table.element(a,'95% UB',1,header=TRUE)
a<-table.element(a,'p-value
(H0: Y[t] = F[t])',1,header=TRUE)
a<-table.element(a,'P(F[t]>Y[t-1])',1,header=TRUE)
a<-table.element(a,'P(F[t]>Y[t-s])',1,header=TRUE)
mylab <- paste('P(F[t]>Y[',nx,sep='')
mylab <- paste(mylab,'])',sep='')
a<-table.element(a,mylab,1,header=TRUE)
a<-table.row.end(a)
for (i in (nx-par5):nx) {
a<-table.row.start(a)
a<-table.element(a,i,header=TRUE)
a<-table.element(a,x[i])
a<-table.element(a,'-')
a<-table.row.end(a)
}
for (i in 1:fx) {
a<-table.row.start(a)
a<-table.element(a,nx+i,header=TRUE)
a<-table.element(a,round(x[nx+i],4))
a<-table.element(a,round(forecast$pred[i],4))
a<-table.element(a,round(lb[i],4))
a<-table.element(a,round(ub[i],4))
a<-table.element(a,round((1-prob.pval[i]),4))
a<-table.element(a,round((1-prob.dec[i]),4))
a<-table.element(a,round((1-prob.sdec[i]),4))
a<-table.element(a,round((1-prob.ldec[i]),4))
a<-table.row.end(a)
}
a<-table.end(a)
table.save(a,file='mytable.tab')
a<-table.start()
a<-table.row.start(a)
a<-table.element(a,'Univariate ARIMA Extrapolation Forecast Performance',7,TRUE)
a<-table.row.end(a)
a<-table.row.start(a)
a<-table.element(a,'time',1,header=TRUE)
a<-table.element(a,'% S.E.',1,header=TRUE)
a<-table.element(a,'PE',1,header=TRUE)
a<-table.element(a,'MAPE',1,header=TRUE)
a<-table.element(a,'Sq.E',1,header=TRUE)
a<-table.element(a,'MSE',1,header=TRUE)
a<-table.element(a,'RMSE',1,header=TRUE)
a<-table.row.end(a)
for (i in 1:fx) {
a<-table.row.start(a)
a<-table.element(a,nx+i,header=TRUE)
a<-table.element(a,round(perc.se[i],4))
a<-table.element(a,round(perf.pe[i],4))
a<-table.element(a,round(perf.mape1[i],4))
a<-table.element(a,round(perf.se[i],4))
a<-table.element(a,round(perf.mse1[i],4))
a<-table.element(a,round(perf.rmse[i],4))
a<-table.row.end(a)
}
a<-table.end(a)
table.save(a,file='mytable1.tab')