Free Statistics

of Irreproducible Research!

Author's title

Author*The author of this computation has been verified*
R Software Modulerwasp_smp.wasp
Title produced by softwareStandard Deviation-Mean Plot
Date of computationFri, 24 Dec 2010 12:03:45 +0000
Cite this page as followsStatistical Computations at FreeStatistics.org, Office for Research Development and Education, URL https://freestatistics.org/blog/index.php?v=date/2010/Dec/24/t12931920755w2l3tafex75yz9.htm/, Retrieved Tue, 30 Apr 2024 05:59:27 +0000
Statistical Computations at FreeStatistics.org, Office for Research Development and Education, URL https://freestatistics.org/blog/index.php?pk=114799, Retrieved Tue, 30 Apr 2024 05:59:27 +0000
QR Codes:

Original text written by user:
IsPrivate?No (this computation is public)
User-defined keywords
Estimated Impact149
Family? (F = Feedback message, R = changed R code, M = changed R Module, P = changed Parameters, D = changed Data)
-     [Kendall tau Correlation Matrix] [] [2010-12-05 17:44:33] [b98453cac15ba1066b407e146608df68]
- RMPD  [Kendall tau Correlation Matrix] [WS 10 - Pearson c...] [2010-12-10 16:13:49] [033eb2749a430605d9b2be7c4aac4a0c]
-         [Kendall tau Correlation Matrix] [] [2010-12-13 18:15:16] [d7b28a0391ab3b2ddc9f9fba95a43f33]
- RMPD        [Standard Deviation-Mean Plot] [] [2010-12-24 12:03:45] [a75ee4dff32cc2c5ca1525a5910b53eb] [Current]
-   PD          [Standard Deviation-Mean Plot] [standard dev mean...] [2011-12-15 16:08:11] [63813c3109753b730d344072266dee79]
Feedback Forum

Post a new message
Dataseries X:
5.715
4.575
4.621
4.413
4.280
4.024
4.336
4.144
3.764
4.248
4.215
4.871
4.946
4.490
4.851
4.591
4.279
4.191
4.285
4.516
4.197
4.404
4.373
5.307
5.320
4.356
4.484
4.210
4.018
3.912
3.972
3.886
3.892
4.242
4.134
4.743

5.116
4.823
5.489
4.263
4.221
4.076
3.715
3.715
3.784
4.141
3.968
4.767
5.019
4.343
4.853
4.154
4.035
3.996
4.734
3.778
3.887
3.953
3.987
4.436
4.803
4.672
4.560
4.289
3.961
3.943
3.932
3.816
3.834
4.130
4.467
4.447


Summary of computational transaction
Raw Inputview raw input (R code)
Raw Outputview raw output of R engine
Computing time2 seconds
R Server'Gwilym Jenkins' @ 72.249.127.135
R Framework error message
Warning: there are blank lines in the 'Data' field.
Please, use NA for missing data - blank lines are simply
 deleted and are NOT treated as missing values.

\begin{tabular}{lllllllll}
\hline
Summary of computational transaction \tabularnewline
Raw Input & view raw input (R code)  \tabularnewline
Raw Output & view raw output of R engine  \tabularnewline
Computing time & 2 seconds \tabularnewline
R Server & 'Gwilym Jenkins' @ 72.249.127.135 \tabularnewline
R Framework error message & 
Warning: there are blank lines in the 'Data' field.
Please, use NA for missing data - blank lines are simply
 deleted and are NOT treated as missing values.
\tabularnewline \hline \end{tabular} %Source: https://freestatistics.org/blog/index.php?pk=114799&T=0

[TABLE]
[ROW][C]Summary of computational transaction[/C][/ROW]
[ROW][C]Raw Input[/C][C]view raw input (R code) [/C][/ROW]
[ROW][C]Raw Output[/C][C]view raw output of R engine [/C][/ROW]
[ROW][C]Computing time[/C][C]2 seconds[/C][/ROW]
[ROW][C]R Server[/C][C]'Gwilym Jenkins' @ 72.249.127.135[/C][/ROW]
[ROW][C]R Framework error message[/C][C]
Warning: there are blank lines in the 'Data' field.
Please, use NA for missing data - blank lines are simply
 deleted and are NOT treated as missing values.
[/C][/ROW] [/TABLE] Source: https://freestatistics.org/blog/index.php?pk=114799&T=0

Globally Unique Identifier (entire table): ba.freestatistics.org/blog/index.php?pk=114799&T=0

As an alternative you can also use a QR Code:  

The GUIDs for individual cells are displayed in the table below:

Summary of computational transaction
Raw Inputview raw input (R code)
Raw Outputview raw output of R engine
Computing time2 seconds
R Server'Gwilym Jenkins' @ 72.249.127.135
R Framework error message
Warning: there are blank lines in the 'Data' field.
Please, use NA for missing data - blank lines are simply
 deleted and are NOT treated as missing values.


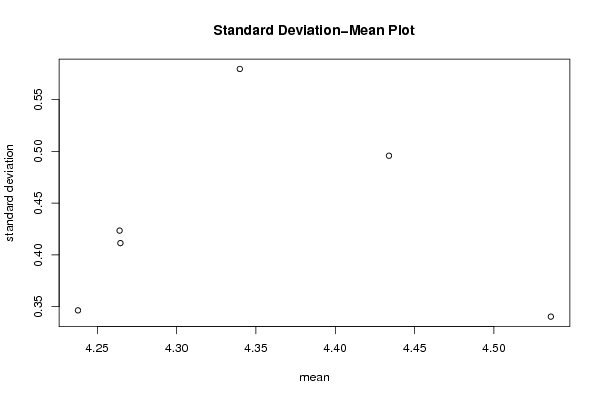
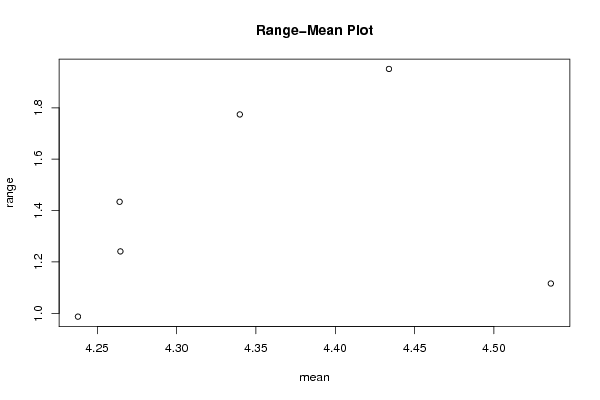
Standard Deviation-Mean Plot
SectionMeanStandard DeviationRange
14.433833333333330.4958186679776711.951
24.535833333333330.3403601924521441.116
34.264083333333330.4234804832539151.434
44.339833333333330.579666962900931.774
54.264583333333330.4114063371442211.241
64.237833333333330.3464549907362580.987

\begin{tabular}{lllllllll}
\hline
Standard Deviation-Mean Plot \tabularnewline
Section & Mean & Standard Deviation & Range \tabularnewline
1 & 4.43383333333333 & 0.495818667977671 & 1.951 \tabularnewline
2 & 4.53583333333333 & 0.340360192452144 & 1.116 \tabularnewline
3 & 4.26408333333333 & 0.423480483253915 & 1.434 \tabularnewline
4 & 4.33983333333333 & 0.57966696290093 & 1.774 \tabularnewline
5 & 4.26458333333333 & 0.411406337144221 & 1.241 \tabularnewline
6 & 4.23783333333333 & 0.346454990736258 & 0.987 \tabularnewline
\hline
\end{tabular}
%Source: https://freestatistics.org/blog/index.php?pk=114799&T=1

[TABLE]
[ROW][C]Standard Deviation-Mean Plot[/C][/ROW]
[ROW][C]Section[/C][C]Mean[/C][C]Standard Deviation[/C][C]Range[/C][/ROW]
[ROW][C]1[/C][C]4.43383333333333[/C][C]0.495818667977671[/C][C]1.951[/C][/ROW]
[ROW][C]2[/C][C]4.53583333333333[/C][C]0.340360192452144[/C][C]1.116[/C][/ROW]
[ROW][C]3[/C][C]4.26408333333333[/C][C]0.423480483253915[/C][C]1.434[/C][/ROW]
[ROW][C]4[/C][C]4.33983333333333[/C][C]0.57966696290093[/C][C]1.774[/C][/ROW]
[ROW][C]5[/C][C]4.26458333333333[/C][C]0.411406337144221[/C][C]1.241[/C][/ROW]
[ROW][C]6[/C][C]4.23783333333333[/C][C]0.346454990736258[/C][C]0.987[/C][/ROW]
[/TABLE]
Source: https://freestatistics.org/blog/index.php?pk=114799&T=1

Globally Unique Identifier (entire table): ba.freestatistics.org/blog/index.php?pk=114799&T=1

As an alternative you can also use a QR Code:  

The GUIDs for individual cells are displayed in the table below:

Standard Deviation-Mean Plot
SectionMeanStandard DeviationRange
14.433833333333330.4958186679776711.951
24.535833333333330.3403601924521441.116
34.264083333333330.4234804832539151.434
44.339833333333330.579666962900931.774
54.264583333333330.4114063371442211.241
64.237833333333330.3464549907362580.987


Regression: S.E.(k) = alpha + beta * Mean(k)
alpha0.500668297964832
beta-0.0156014017995035
S.D.0.390904054236209
T-STAT-0.0399110769776671
p-value0.970076621570884

\begin{tabular}{lllllllll}
\hline
Regression: S.E.(k) = alpha + beta * Mean(k) \tabularnewline
alpha & 0.500668297964832 \tabularnewline
beta & -0.0156014017995035 \tabularnewline
S.D. & 0.390904054236209 \tabularnewline
T-STAT & -0.0399110769776671 \tabularnewline
p-value & 0.970076621570884 \tabularnewline
\hline
\end{tabular}
%Source: https://freestatistics.org/blog/index.php?pk=114799&T=2

[TABLE]
[ROW][C]Regression: S.E.(k) = alpha + beta * Mean(k)[/C][/ROW]
[ROW][C]alpha[/C][C]0.500668297964832[/C][/ROW]
[ROW][C]beta[/C][C]-0.0156014017995035[/C][/ROW]
[ROW][C]S.D.[/C][C]0.390904054236209[/C][/ROW]
[ROW][C]T-STAT[/C][C]-0.0399110769776671[/C][/ROW]
[ROW][C]p-value[/C][C]0.970076621570884[/C][/ROW]
[/TABLE]
Source: https://freestatistics.org/blog/index.php?pk=114799&T=2

Globally Unique Identifier (entire table): ba.freestatistics.org/blog/index.php?pk=114799&T=2

As an alternative you can also use a QR Code:  

The GUIDs for individual cells are displayed in the table below:

Regression: S.E.(k) = alpha + beta * Mean(k)
alpha0.500668297964832
beta-0.0156014017995035
S.D.0.390904054236209
T-STAT-0.0399110769776671
p-value0.970076621570884


Regression: ln S.E.(k) = alpha + beta * ln Mean(k)
alpha-0.438096943260824
beta-0.284038533853793
S.D.3.84459390473411
T-STAT-0.0738799833979961
p-value0.944652930986772
Lambda1.28403853385379

\begin{tabular}{lllllllll}
\hline
Regression: ln S.E.(k) = alpha + beta * ln Mean(k) \tabularnewline
alpha & -0.438096943260824 \tabularnewline
beta & -0.284038533853793 \tabularnewline
S.D. & 3.84459390473411 \tabularnewline
T-STAT & -0.0738799833979961 \tabularnewline
p-value & 0.944652930986772 \tabularnewline
Lambda & 1.28403853385379 \tabularnewline
\hline
\end{tabular}
%Source: https://freestatistics.org/blog/index.php?pk=114799&T=3

[TABLE]
[ROW][C]Regression: ln S.E.(k) = alpha + beta * ln Mean(k)[/C][/ROW]
[ROW][C]alpha[/C][C]-0.438096943260824[/C][/ROW]
[ROW][C]beta[/C][C]-0.284038533853793[/C][/ROW]
[ROW][C]S.D.[/C][C]3.84459390473411[/C][/ROW]
[ROW][C]T-STAT[/C][C]-0.0738799833979961[/C][/ROW]
[ROW][C]p-value[/C][C]0.944652930986772[/C][/ROW]
[ROW][C]Lambda[/C][C]1.28403853385379[/C][/ROW]
[/TABLE]
Source: https://freestatistics.org/blog/index.php?pk=114799&T=3

Globally Unique Identifier (entire table): ba.freestatistics.org/blog/index.php?pk=114799&T=3

As an alternative you can also use a QR Code:  

The GUIDs for individual cells are displayed in the table below:

Regression: ln S.E.(k) = alpha + beta * ln Mean(k)
alpha-0.438096943260824
beta-0.284038533853793
S.D.3.84459390473411
T-STAT-0.0738799833979961
p-value0.944652930986772
Lambda1.28403853385379


Parameters (Session):
par1 = 12 ;
Parameters (R input):
par1 = 12 ;
R code (references can be found in the software module):
par1 <- as.numeric(par1)
(n <- length(x))
(np <- floor(n / par1))
arr <- array(NA,dim=c(par1,np))
j <- 0
k <- 1
for (i in 1:(np*par1))
{
j = j + 1
arr[j,k] <- x[i]
if (j == par1) {
j = 0
k=k+1
}
}
arr
arr.mean <- array(NA,dim=np)
arr.sd <- array(NA,dim=np)
arr.range <- array(NA,dim=np)
for (j in 1:np)
{
arr.mean[j] <- mean(arr[,j],na.rm=TRUE)
arr.sd[j] <- sd(arr[,j],na.rm=TRUE)
arr.range[j] <- max(arr[,j],na.rm=TRUE) - min(arr[,j],na.rm=TRUE)
}
arr.mean
arr.sd
arr.range
(lm1 <- lm(arr.sd~arr.mean))
(lnlm1 <- lm(log(arr.sd)~log(arr.mean)))
(lm2 <- lm(arr.range~arr.mean))
bitmap(file='test1.png')
plot(arr.mean,arr.sd,main='Standard Deviation-Mean Plot',xlab='mean',ylab='standard deviation')
dev.off()
bitmap(file='test2.png')
plot(arr.mean,arr.range,main='Range-Mean Plot',xlab='mean',ylab='range')
dev.off()
load(file='createtable')
a<-table.start()
a<-table.row.start(a)
a<-table.element(a,'Standard Deviation-Mean Plot',4,TRUE)
a<-table.row.end(a)
a<-table.row.start(a)
a<-table.element(a,'Section',header=TRUE)
a<-table.element(a,'Mean',header=TRUE)
a<-table.element(a,'Standard Deviation',header=TRUE)
a<-table.element(a,'Range',header=TRUE)
a<-table.row.end(a)
for (j in 1:np) {
a<-table.row.start(a)
a<-table.element(a,j,header=TRUE)
a<-table.element(a,arr.mean[j])
a<-table.element(a,arr.sd[j] )
a<-table.element(a,arr.range[j] )
a<-table.row.end(a)
}
a<-table.end(a)
table.save(a,file='mytable.tab')
a<-table.start()
a<-table.row.start(a)
a<-table.element(a,'Regression: S.E.(k) = alpha + beta * Mean(k)',2,TRUE)
a<-table.row.end(a)
a<-table.row.start(a)
a<-table.element(a,'alpha',header=TRUE)
a<-table.element(a,lm1$coefficients[[1]])
a<-table.row.end(a)
a<-table.row.start(a)
a<-table.element(a,'beta',header=TRUE)
a<-table.element(a,lm1$coefficients[[2]])
a<-table.row.end(a)
a<-table.row.start(a)
a<-table.element(a,'S.D.',header=TRUE)
a<-table.element(a,summary(lm1)$coefficients[2,2])
a<-table.row.end(a)
a<-table.row.start(a)
a<-table.element(a,'T-STAT',header=TRUE)
a<-table.element(a,summary(lm1)$coefficients[2,3])
a<-table.row.end(a)
a<-table.row.start(a)
a<-table.element(a,'p-value',header=TRUE)
a<-table.element(a,summary(lm1)$coefficients[2,4])
a<-table.row.end(a)
a<-table.end(a)
table.save(a,file='mytable1.tab')
a<-table.start()
a<-table.row.start(a)
a<-table.element(a,'Regression: ln S.E.(k) = alpha + beta * ln Mean(k)',2,TRUE)
a<-table.row.end(a)
a<-table.row.start(a)
a<-table.element(a,'alpha',header=TRUE)
a<-table.element(a,lnlm1$coefficients[[1]])
a<-table.row.end(a)
a<-table.row.start(a)
a<-table.element(a,'beta',header=TRUE)
a<-table.element(a,lnlm1$coefficients[[2]])
a<-table.row.end(a)
a<-table.row.start(a)
a<-table.element(a,'S.D.',header=TRUE)
a<-table.element(a,summary(lnlm1)$coefficients[2,2])
a<-table.row.end(a)
a<-table.row.start(a)
a<-table.element(a,'T-STAT',header=TRUE)
a<-table.element(a,summary(lnlm1)$coefficients[2,3])
a<-table.row.end(a)
a<-table.row.start(a)
a<-table.element(a,'p-value',header=TRUE)
a<-table.element(a,summary(lnlm1)$coefficients[2,4])
a<-table.row.end(a)
a<-table.row.start(a)
a<-table.element(a,'Lambda',header=TRUE)
a<-table.element(a,1-lnlm1$coefficients[[2]])
a<-table.row.end(a)
a<-table.end(a)
table.save(a,file='mytable2.tab')