Free Statistics

of Irreproducible Research!

Author's title

Author*The author of this computation has been verified*
R Software Modulerwasp_autocorrelation.wasp
Title produced by software(Partial) Autocorrelation Function
Date of computationFri, 24 Dec 2010 12:01:32 +0000
Cite this page as followsStatistical Computations at FreeStatistics.org, Office for Research Development and Education, URL https://freestatistics.org/blog/index.php?v=date/2010/Dec/24/t12931919490yaiikeaov1m6kv.htm/, Retrieved Tue, 30 Apr 2024 07:37:26 +0000
Statistical Computations at FreeStatistics.org, Office for Research Development and Education, URL https://freestatistics.org/blog/index.php?pk=114793, Retrieved Tue, 30 Apr 2024 07:37:26 +0000
QR Codes:

Original text written by user:
IsPrivate?No (this computation is public)
User-defined keywords
Estimated Impact101
Family? (F = Feedback message, R = changed R code, M = changed R Module, P = changed Parameters, D = changed Data)
-       [(Partial) Autocorrelation Function] [Autocorrelatie D=1] [2010-12-24 12:01:32] [b5e30b7400ffb7c52b5936a3d8d7c96c] [Current]
Feedback Forum

Post a new message
Dataseries X:
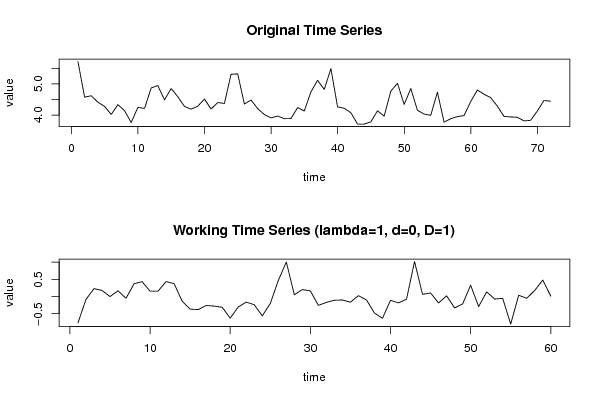
5.715
4.575
4.621
4.413
4.280
4.024
4.336
4.144
3.764
4.248
4.215
4.871
4.946
4.490
4.851
4.591
4.279
4.191
4.285
4.516
4.197
4.404
4.373
5.307
5.320
4.356
4.484
4.210
4.018
3.912
3.972
3.886
3.892
4.242
4.134
4.743

5.116
4.823
5.489
4.263
4.221
4.076
3.715
3.715
3.784
4.141
3.968
4.767
5.019
4.343
4.853
4.154
4.035
3.996
4.734
3.778
3.887
3.953
3.987
4.436
4.803
4.672
4.560
4.289
3.961
3.943
3.932
3.816
3.834
4.130
4.467
4.447


Summary of computational transaction
Raw Inputview raw input (R code)
Raw Outputview raw output of R engine
Computing time3 seconds
R Server'George Udny Yule' @ 72.249.76.132
R Framework error message
Warning: there are blank lines in the 'Data' field.
Please, use NA for missing data - blank lines are simply
 deleted and are NOT treated as missing values.

\begin{tabular}{lllllllll}
\hline
Summary of computational transaction \tabularnewline
Raw Input & view raw input (R code)  \tabularnewline
Raw Output & view raw output of R engine  \tabularnewline
Computing time & 3 seconds \tabularnewline
R Server & 'George Udny Yule' @ 72.249.76.132 \tabularnewline
R Framework error message & 
Warning: there are blank lines in the 'Data' field.
Please, use NA for missing data - blank lines are simply
 deleted and are NOT treated as missing values.
\tabularnewline \hline \end{tabular} %Source: https://freestatistics.org/blog/index.php?pk=114793&T=0

[TABLE]
[ROW][C]Summary of computational transaction[/C][/ROW]
[ROW][C]Raw Input[/C][C]view raw input (R code) [/C][/ROW]
[ROW][C]Raw Output[/C][C]view raw output of R engine [/C][/ROW]
[ROW][C]Computing time[/C][C]3 seconds[/C][/ROW]
[ROW][C]R Server[/C][C]'George Udny Yule' @ 72.249.76.132[/C][/ROW]
[ROW][C]R Framework error message[/C][C]
Warning: there are blank lines in the 'Data' field.
Please, use NA for missing data - blank lines are simply
 deleted and are NOT treated as missing values.
[/C][/ROW] [/TABLE] Source: https://freestatistics.org/blog/index.php?pk=114793&T=0

Globally Unique Identifier (entire table): ba.freestatistics.org/blog/index.php?pk=114793&T=0

As an alternative you can also use a QR Code:  

The GUIDs for individual cells are displayed in the table below:

Summary of computational transaction
Raw Inputview raw input (R code)
Raw Outputview raw output of R engine
Computing time3 seconds
R Server'George Udny Yule' @ 72.249.76.132
R Framework error message
Warning: there are blank lines in the 'Data' field.
Please, use NA for missing data - blank lines are simply
 deleted and are NOT treated as missing values.


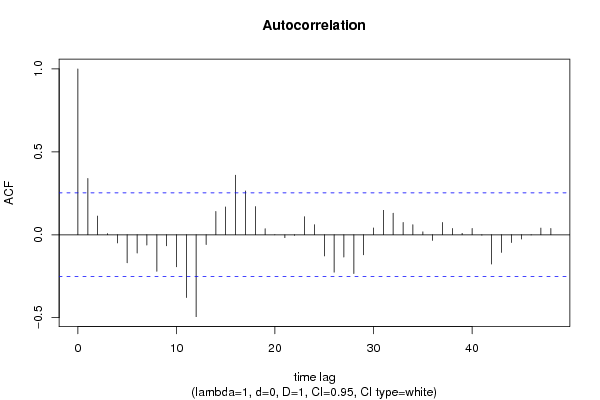
Autocorrelation Function
Time lag kACF(k)T-STATP-value
10.339522.62990.005417
20.1128190.87390.192831
30.0070420.05450.478341
4-0.049351-0.38230.351805
5-0.169416-1.31230.09721
6-0.110581-0.85660.197548
7-0.06255-0.48450.314893
8-0.220398-1.70720.046478
9-0.066629-0.51610.303838
10-0.193676-1.50020.069402
11-0.378877-2.93480.002362
12-0.493982-3.82640.000156
13-0.059081-0.45760.324433
140.1402591.08640.140815
150.168011.30140.099049
160.3592612.78280.003597
170.2645972.04960.022393
180.1699591.31650.096507
190.0363910.28190.389503
20-1.5e-05-1e-040.499955
21-0.017622-0.13650.445943
22-0.004051-0.03140.487537
230.1085990.84120.201786
240.0609540.47220.319266
25-0.12784-0.99020.163015
26-0.225774-1.74880.042717
27-0.134262-1.040.151258
28-0.233969-1.81230.037471
29-0.121165-0.93850.175864
300.0414290.32090.374699
310.1475421.14290.128819
320.1298481.00580.159276
330.0739120.57250.284556
340.0603340.46730.320973
350.017610.13640.445979
36-0.034166-0.26460.396095
370.0744150.57640.283246
380.0378420.29310.385219
390.0085510.06620.473706
400.0384350.29770.383475
41-0.002907-0.02250.491054
42-0.176805-1.36950.08797
43-0.106705-0.82650.205889
44-0.04746-0.36760.357224
45-0.025794-0.19980.421157
46-0.001517-0.01180.495331
470.0402980.31210.378005
480.0382880.29660.383907

\begin{tabular}{lllllllll}
\hline
Autocorrelation Function \tabularnewline
Time lag k & ACF(k) & T-STAT & P-value \tabularnewline
1 & 0.33952 & 2.6299 & 0.005417 \tabularnewline
2 & 0.112819 & 0.8739 & 0.192831 \tabularnewline
3 & 0.007042 & 0.0545 & 0.478341 \tabularnewline
4 & -0.049351 & -0.3823 & 0.351805 \tabularnewline
5 & -0.169416 & -1.3123 & 0.09721 \tabularnewline
6 & -0.110581 & -0.8566 & 0.197548 \tabularnewline
7 & -0.06255 & -0.4845 & 0.314893 \tabularnewline
8 & -0.220398 & -1.7072 & 0.046478 \tabularnewline
9 & -0.066629 & -0.5161 & 0.303838 \tabularnewline
10 & -0.193676 & -1.5002 & 0.069402 \tabularnewline
11 & -0.378877 & -2.9348 & 0.002362 \tabularnewline
12 & -0.493982 & -3.8264 & 0.000156 \tabularnewline
13 & -0.059081 & -0.4576 & 0.324433 \tabularnewline
14 & 0.140259 & 1.0864 & 0.140815 \tabularnewline
15 & 0.16801 & 1.3014 & 0.099049 \tabularnewline
16 & 0.359261 & 2.7828 & 0.003597 \tabularnewline
17 & 0.264597 & 2.0496 & 0.022393 \tabularnewline
18 & 0.169959 & 1.3165 & 0.096507 \tabularnewline
19 & 0.036391 & 0.2819 & 0.389503 \tabularnewline
20 & -1.5e-05 & -1e-04 & 0.499955 \tabularnewline
21 & -0.017622 & -0.1365 & 0.445943 \tabularnewline
22 & -0.004051 & -0.0314 & 0.487537 \tabularnewline
23 & 0.108599 & 0.8412 & 0.201786 \tabularnewline
24 & 0.060954 & 0.4722 & 0.319266 \tabularnewline
25 & -0.12784 & -0.9902 & 0.163015 \tabularnewline
26 & -0.225774 & -1.7488 & 0.042717 \tabularnewline
27 & -0.134262 & -1.04 & 0.151258 \tabularnewline
28 & -0.233969 & -1.8123 & 0.037471 \tabularnewline
29 & -0.121165 & -0.9385 & 0.175864 \tabularnewline
30 & 0.041429 & 0.3209 & 0.374699 \tabularnewline
31 & 0.147542 & 1.1429 & 0.128819 \tabularnewline
32 & 0.129848 & 1.0058 & 0.159276 \tabularnewline
33 & 0.073912 & 0.5725 & 0.284556 \tabularnewline
34 & 0.060334 & 0.4673 & 0.320973 \tabularnewline
35 & 0.01761 & 0.1364 & 0.445979 \tabularnewline
36 & -0.034166 & -0.2646 & 0.396095 \tabularnewline
37 & 0.074415 & 0.5764 & 0.283246 \tabularnewline
38 & 0.037842 & 0.2931 & 0.385219 \tabularnewline
39 & 0.008551 & 0.0662 & 0.473706 \tabularnewline
40 & 0.038435 & 0.2977 & 0.383475 \tabularnewline
41 & -0.002907 & -0.0225 & 0.491054 \tabularnewline
42 & -0.176805 & -1.3695 & 0.08797 \tabularnewline
43 & -0.106705 & -0.8265 & 0.205889 \tabularnewline
44 & -0.04746 & -0.3676 & 0.357224 \tabularnewline
45 & -0.025794 & -0.1998 & 0.421157 \tabularnewline
46 & -0.001517 & -0.0118 & 0.495331 \tabularnewline
47 & 0.040298 & 0.3121 & 0.378005 \tabularnewline
48 & 0.038288 & 0.2966 & 0.383907 \tabularnewline
\hline
\end{tabular}
%Source: https://freestatistics.org/blog/index.php?pk=114793&T=1

[TABLE]
[ROW][C]Autocorrelation Function[/C][/ROW]
[ROW][C]Time lag k[/C][C]ACF(k)[/C][C]T-STAT[/C][C]P-value[/C][/ROW]
[ROW][C]1[/C][C]0.33952[/C][C]2.6299[/C][C]0.005417[/C][/ROW]
[ROW][C]2[/C][C]0.112819[/C][C]0.8739[/C][C]0.192831[/C][/ROW]
[ROW][C]3[/C][C]0.007042[/C][C]0.0545[/C][C]0.478341[/C][/ROW]
[ROW][C]4[/C][C]-0.049351[/C][C]-0.3823[/C][C]0.351805[/C][/ROW]
[ROW][C]5[/C][C]-0.169416[/C][C]-1.3123[/C][C]0.09721[/C][/ROW]
[ROW][C]6[/C][C]-0.110581[/C][C]-0.8566[/C][C]0.197548[/C][/ROW]
[ROW][C]7[/C][C]-0.06255[/C][C]-0.4845[/C][C]0.314893[/C][/ROW]
[ROW][C]8[/C][C]-0.220398[/C][C]-1.7072[/C][C]0.046478[/C][/ROW]
[ROW][C]9[/C][C]-0.066629[/C][C]-0.5161[/C][C]0.303838[/C][/ROW]
[ROW][C]10[/C][C]-0.193676[/C][C]-1.5002[/C][C]0.069402[/C][/ROW]
[ROW][C]11[/C][C]-0.378877[/C][C]-2.9348[/C][C]0.002362[/C][/ROW]
[ROW][C]12[/C][C]-0.493982[/C][C]-3.8264[/C][C]0.000156[/C][/ROW]
[ROW][C]13[/C][C]-0.059081[/C][C]-0.4576[/C][C]0.324433[/C][/ROW]
[ROW][C]14[/C][C]0.140259[/C][C]1.0864[/C][C]0.140815[/C][/ROW]
[ROW][C]15[/C][C]0.16801[/C][C]1.3014[/C][C]0.099049[/C][/ROW]
[ROW][C]16[/C][C]0.359261[/C][C]2.7828[/C][C]0.003597[/C][/ROW]
[ROW][C]17[/C][C]0.264597[/C][C]2.0496[/C][C]0.022393[/C][/ROW]
[ROW][C]18[/C][C]0.169959[/C][C]1.3165[/C][C]0.096507[/C][/ROW]
[ROW][C]19[/C][C]0.036391[/C][C]0.2819[/C][C]0.389503[/C][/ROW]
[ROW][C]20[/C][C]-1.5e-05[/C][C]-1e-04[/C][C]0.499955[/C][/ROW]
[ROW][C]21[/C][C]-0.017622[/C][C]-0.1365[/C][C]0.445943[/C][/ROW]
[ROW][C]22[/C][C]-0.004051[/C][C]-0.0314[/C][C]0.487537[/C][/ROW]
[ROW][C]23[/C][C]0.108599[/C][C]0.8412[/C][C]0.201786[/C][/ROW]
[ROW][C]24[/C][C]0.060954[/C][C]0.4722[/C][C]0.319266[/C][/ROW]
[ROW][C]25[/C][C]-0.12784[/C][C]-0.9902[/C][C]0.163015[/C][/ROW]
[ROW][C]26[/C][C]-0.225774[/C][C]-1.7488[/C][C]0.042717[/C][/ROW]
[ROW][C]27[/C][C]-0.134262[/C][C]-1.04[/C][C]0.151258[/C][/ROW]
[ROW][C]28[/C][C]-0.233969[/C][C]-1.8123[/C][C]0.037471[/C][/ROW]
[ROW][C]29[/C][C]-0.121165[/C][C]-0.9385[/C][C]0.175864[/C][/ROW]
[ROW][C]30[/C][C]0.041429[/C][C]0.3209[/C][C]0.374699[/C][/ROW]
[ROW][C]31[/C][C]0.147542[/C][C]1.1429[/C][C]0.128819[/C][/ROW]
[ROW][C]32[/C][C]0.129848[/C][C]1.0058[/C][C]0.159276[/C][/ROW]
[ROW][C]33[/C][C]0.073912[/C][C]0.5725[/C][C]0.284556[/C][/ROW]
[ROW][C]34[/C][C]0.060334[/C][C]0.4673[/C][C]0.320973[/C][/ROW]
[ROW][C]35[/C][C]0.01761[/C][C]0.1364[/C][C]0.445979[/C][/ROW]
[ROW][C]36[/C][C]-0.034166[/C][C]-0.2646[/C][C]0.396095[/C][/ROW]
[ROW][C]37[/C][C]0.074415[/C][C]0.5764[/C][C]0.283246[/C][/ROW]
[ROW][C]38[/C][C]0.037842[/C][C]0.2931[/C][C]0.385219[/C][/ROW]
[ROW][C]39[/C][C]0.008551[/C][C]0.0662[/C][C]0.473706[/C][/ROW]
[ROW][C]40[/C][C]0.038435[/C][C]0.2977[/C][C]0.383475[/C][/ROW]
[ROW][C]41[/C][C]-0.002907[/C][C]-0.0225[/C][C]0.491054[/C][/ROW]
[ROW][C]42[/C][C]-0.176805[/C][C]-1.3695[/C][C]0.08797[/C][/ROW]
[ROW][C]43[/C][C]-0.106705[/C][C]-0.8265[/C][C]0.205889[/C][/ROW]
[ROW][C]44[/C][C]-0.04746[/C][C]-0.3676[/C][C]0.357224[/C][/ROW]
[ROW][C]45[/C][C]-0.025794[/C][C]-0.1998[/C][C]0.421157[/C][/ROW]
[ROW][C]46[/C][C]-0.001517[/C][C]-0.0118[/C][C]0.495331[/C][/ROW]
[ROW][C]47[/C][C]0.040298[/C][C]0.3121[/C][C]0.378005[/C][/ROW]
[ROW][C]48[/C][C]0.038288[/C][C]0.2966[/C][C]0.383907[/C][/ROW]
[/TABLE]
Source: https://freestatistics.org/blog/index.php?pk=114793&T=1

Globally Unique Identifier (entire table): ba.freestatistics.org/blog/index.php?pk=114793&T=1

As an alternative you can also use a QR Code:  

The GUIDs for individual cells are displayed in the table below:

Autocorrelation Function
Time lag kACF(k)T-STATP-value
10.339522.62990.005417
20.1128190.87390.192831
30.0070420.05450.478341
4-0.049351-0.38230.351805
5-0.169416-1.31230.09721
6-0.110581-0.85660.197548
7-0.06255-0.48450.314893
8-0.220398-1.70720.046478
9-0.066629-0.51610.303838
10-0.193676-1.50020.069402
11-0.378877-2.93480.002362
12-0.493982-3.82640.000156
13-0.059081-0.45760.324433
140.1402591.08640.140815
150.168011.30140.099049
160.3592612.78280.003597
170.2645972.04960.022393
180.1699591.31650.096507
190.0363910.28190.389503
20-1.5e-05-1e-040.499955
21-0.017622-0.13650.445943
22-0.004051-0.03140.487537
230.1085990.84120.201786
240.0609540.47220.319266
25-0.12784-0.99020.163015
26-0.225774-1.74880.042717
27-0.134262-1.040.151258
28-0.233969-1.81230.037471
29-0.121165-0.93850.175864
300.0414290.32090.374699
310.1475421.14290.128819
320.1298481.00580.159276
330.0739120.57250.284556
340.0603340.46730.320973
350.017610.13640.445979
36-0.034166-0.26460.396095
370.0744150.57640.283246
380.0378420.29310.385219
390.0085510.06620.473706
400.0384350.29770.383475
41-0.002907-0.02250.491054
42-0.176805-1.36950.08797
43-0.106705-0.82650.205889
44-0.04746-0.36760.357224
45-0.025794-0.19980.421157
46-0.001517-0.01180.495331
470.0402980.31210.378005
480.0382880.29660.383907


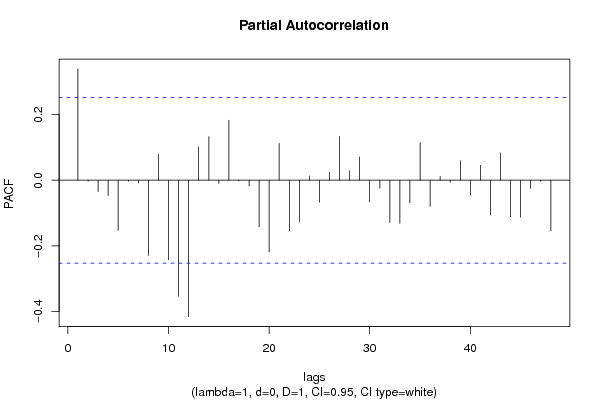
Partial Autocorrelation Function
Time lag kPACF(k)T-STATP-value
10.339522.62990.005417
2-0.002775-0.02150.491461
3-0.034391-0.26640.395425
4-0.046487-0.36010.360023
5-0.152972-1.18490.120361
6-0.003038-0.02350.490652
7-0.008746-0.06770.473107
8-0.229604-1.77850.040194
90.0787530.610.272077
10-0.242263-1.87660.032722
11-0.354134-2.74310.004006
12-0.416165-3.22360.001024
130.1019040.78930.21651
140.1331951.03170.153171
15-0.010155-0.07870.468782
160.183331.42010.080381
17-0.002099-0.01630.493542
18-0.017259-0.13370.447049
19-0.141917-1.09930.138018
20-0.219304-1.69870.047276
210.1124640.87110.193574
22-0.153986-1.19280.118827
23-0.126841-0.98250.164898
240.0132660.10280.459248
25-0.066872-0.5180.303186
260.0245580.19020.424888
270.1336381.03520.152375
280.0290270.22480.411432
290.0707360.54790.292891
30-0.066242-0.51310.304879
31-0.024729-0.19150.424372
32-0.128896-0.99840.161042
33-0.131279-1.01690.156646
34-0.068935-0.5340.297667
350.1144360.88640.189467
36-0.079447-0.61540.270311
370.0116010.08990.464348
38-0.006335-0.04910.480512
390.0598270.46340.322371
40-0.045063-0.34910.364135
410.0456430.35350.362458
42-0.106155-0.82230.207089
430.0831480.64410.260996
44-0.111007-0.85990.196645
45-0.112721-0.87310.193037
46-0.024719-0.19150.424401
47-0.003827-0.02960.488223
48-0.154221-1.19460.118474

\begin{tabular}{lllllllll}
\hline
Partial Autocorrelation Function \tabularnewline
Time lag k & PACF(k) & T-STAT & P-value \tabularnewline
1 & 0.33952 & 2.6299 & 0.005417 \tabularnewline
2 & -0.002775 & -0.0215 & 0.491461 \tabularnewline
3 & -0.034391 & -0.2664 & 0.395425 \tabularnewline
4 & -0.046487 & -0.3601 & 0.360023 \tabularnewline
5 & -0.152972 & -1.1849 & 0.120361 \tabularnewline
6 & -0.003038 & -0.0235 & 0.490652 \tabularnewline
7 & -0.008746 & -0.0677 & 0.473107 \tabularnewline
8 & -0.229604 & -1.7785 & 0.040194 \tabularnewline
9 & 0.078753 & 0.61 & 0.272077 \tabularnewline
10 & -0.242263 & -1.8766 & 0.032722 \tabularnewline
11 & -0.354134 & -2.7431 & 0.004006 \tabularnewline
12 & -0.416165 & -3.2236 & 0.001024 \tabularnewline
13 & 0.101904 & 0.7893 & 0.21651 \tabularnewline
14 & 0.133195 & 1.0317 & 0.153171 \tabularnewline
15 & -0.010155 & -0.0787 & 0.468782 \tabularnewline
16 & 0.18333 & 1.4201 & 0.080381 \tabularnewline
17 & -0.002099 & -0.0163 & 0.493542 \tabularnewline
18 & -0.017259 & -0.1337 & 0.447049 \tabularnewline
19 & -0.141917 & -1.0993 & 0.138018 \tabularnewline
20 & -0.219304 & -1.6987 & 0.047276 \tabularnewline
21 & 0.112464 & 0.8711 & 0.193574 \tabularnewline
22 & -0.153986 & -1.1928 & 0.118827 \tabularnewline
23 & -0.126841 & -0.9825 & 0.164898 \tabularnewline
24 & 0.013266 & 0.1028 & 0.459248 \tabularnewline
25 & -0.066872 & -0.518 & 0.303186 \tabularnewline
26 & 0.024558 & 0.1902 & 0.424888 \tabularnewline
27 & 0.133638 & 1.0352 & 0.152375 \tabularnewline
28 & 0.029027 & 0.2248 & 0.411432 \tabularnewline
29 & 0.070736 & 0.5479 & 0.292891 \tabularnewline
30 & -0.066242 & -0.5131 & 0.304879 \tabularnewline
31 & -0.024729 & -0.1915 & 0.424372 \tabularnewline
32 & -0.128896 & -0.9984 & 0.161042 \tabularnewline
33 & -0.131279 & -1.0169 & 0.156646 \tabularnewline
34 & -0.068935 & -0.534 & 0.297667 \tabularnewline
35 & 0.114436 & 0.8864 & 0.189467 \tabularnewline
36 & -0.079447 & -0.6154 & 0.270311 \tabularnewline
37 & 0.011601 & 0.0899 & 0.464348 \tabularnewline
38 & -0.006335 & -0.0491 & 0.480512 \tabularnewline
39 & 0.059827 & 0.4634 & 0.322371 \tabularnewline
40 & -0.045063 & -0.3491 & 0.364135 \tabularnewline
41 & 0.045643 & 0.3535 & 0.362458 \tabularnewline
42 & -0.106155 & -0.8223 & 0.207089 \tabularnewline
43 & 0.083148 & 0.6441 & 0.260996 \tabularnewline
44 & -0.111007 & -0.8599 & 0.196645 \tabularnewline
45 & -0.112721 & -0.8731 & 0.193037 \tabularnewline
46 & -0.024719 & -0.1915 & 0.424401 \tabularnewline
47 & -0.003827 & -0.0296 & 0.488223 \tabularnewline
48 & -0.154221 & -1.1946 & 0.118474 \tabularnewline
\hline
\end{tabular}
%Source: https://freestatistics.org/blog/index.php?pk=114793&T=2

[TABLE]
[ROW][C]Partial Autocorrelation Function[/C][/ROW]
[ROW][C]Time lag k[/C][C]PACF(k)[/C][C]T-STAT[/C][C]P-value[/C][/ROW]
[ROW][C]1[/C][C]0.33952[/C][C]2.6299[/C][C]0.005417[/C][/ROW]
[ROW][C]2[/C][C]-0.002775[/C][C]-0.0215[/C][C]0.491461[/C][/ROW]
[ROW][C]3[/C][C]-0.034391[/C][C]-0.2664[/C][C]0.395425[/C][/ROW]
[ROW][C]4[/C][C]-0.046487[/C][C]-0.3601[/C][C]0.360023[/C][/ROW]
[ROW][C]5[/C][C]-0.152972[/C][C]-1.1849[/C][C]0.120361[/C][/ROW]
[ROW][C]6[/C][C]-0.003038[/C][C]-0.0235[/C][C]0.490652[/C][/ROW]
[ROW][C]7[/C][C]-0.008746[/C][C]-0.0677[/C][C]0.473107[/C][/ROW]
[ROW][C]8[/C][C]-0.229604[/C][C]-1.7785[/C][C]0.040194[/C][/ROW]
[ROW][C]9[/C][C]0.078753[/C][C]0.61[/C][C]0.272077[/C][/ROW]
[ROW][C]10[/C][C]-0.242263[/C][C]-1.8766[/C][C]0.032722[/C][/ROW]
[ROW][C]11[/C][C]-0.354134[/C][C]-2.7431[/C][C]0.004006[/C][/ROW]
[ROW][C]12[/C][C]-0.416165[/C][C]-3.2236[/C][C]0.001024[/C][/ROW]
[ROW][C]13[/C][C]0.101904[/C][C]0.7893[/C][C]0.21651[/C][/ROW]
[ROW][C]14[/C][C]0.133195[/C][C]1.0317[/C][C]0.153171[/C][/ROW]
[ROW][C]15[/C][C]-0.010155[/C][C]-0.0787[/C][C]0.468782[/C][/ROW]
[ROW][C]16[/C][C]0.18333[/C][C]1.4201[/C][C]0.080381[/C][/ROW]
[ROW][C]17[/C][C]-0.002099[/C][C]-0.0163[/C][C]0.493542[/C][/ROW]
[ROW][C]18[/C][C]-0.017259[/C][C]-0.1337[/C][C]0.447049[/C][/ROW]
[ROW][C]19[/C][C]-0.141917[/C][C]-1.0993[/C][C]0.138018[/C][/ROW]
[ROW][C]20[/C][C]-0.219304[/C][C]-1.6987[/C][C]0.047276[/C][/ROW]
[ROW][C]21[/C][C]0.112464[/C][C]0.8711[/C][C]0.193574[/C][/ROW]
[ROW][C]22[/C][C]-0.153986[/C][C]-1.1928[/C][C]0.118827[/C][/ROW]
[ROW][C]23[/C][C]-0.126841[/C][C]-0.9825[/C][C]0.164898[/C][/ROW]
[ROW][C]24[/C][C]0.013266[/C][C]0.1028[/C][C]0.459248[/C][/ROW]
[ROW][C]25[/C][C]-0.066872[/C][C]-0.518[/C][C]0.303186[/C][/ROW]
[ROW][C]26[/C][C]0.024558[/C][C]0.1902[/C][C]0.424888[/C][/ROW]
[ROW][C]27[/C][C]0.133638[/C][C]1.0352[/C][C]0.152375[/C][/ROW]
[ROW][C]28[/C][C]0.029027[/C][C]0.2248[/C][C]0.411432[/C][/ROW]
[ROW][C]29[/C][C]0.070736[/C][C]0.5479[/C][C]0.292891[/C][/ROW]
[ROW][C]30[/C][C]-0.066242[/C][C]-0.5131[/C][C]0.304879[/C][/ROW]
[ROW][C]31[/C][C]-0.024729[/C][C]-0.1915[/C][C]0.424372[/C][/ROW]
[ROW][C]32[/C][C]-0.128896[/C][C]-0.9984[/C][C]0.161042[/C][/ROW]
[ROW][C]33[/C][C]-0.131279[/C][C]-1.0169[/C][C]0.156646[/C][/ROW]
[ROW][C]34[/C][C]-0.068935[/C][C]-0.534[/C][C]0.297667[/C][/ROW]
[ROW][C]35[/C][C]0.114436[/C][C]0.8864[/C][C]0.189467[/C][/ROW]
[ROW][C]36[/C][C]-0.079447[/C][C]-0.6154[/C][C]0.270311[/C][/ROW]
[ROW][C]37[/C][C]0.011601[/C][C]0.0899[/C][C]0.464348[/C][/ROW]
[ROW][C]38[/C][C]-0.006335[/C][C]-0.0491[/C][C]0.480512[/C][/ROW]
[ROW][C]39[/C][C]0.059827[/C][C]0.4634[/C][C]0.322371[/C][/ROW]
[ROW][C]40[/C][C]-0.045063[/C][C]-0.3491[/C][C]0.364135[/C][/ROW]
[ROW][C]41[/C][C]0.045643[/C][C]0.3535[/C][C]0.362458[/C][/ROW]
[ROW][C]42[/C][C]-0.106155[/C][C]-0.8223[/C][C]0.207089[/C][/ROW]
[ROW][C]43[/C][C]0.083148[/C][C]0.6441[/C][C]0.260996[/C][/ROW]
[ROW][C]44[/C][C]-0.111007[/C][C]-0.8599[/C][C]0.196645[/C][/ROW]
[ROW][C]45[/C][C]-0.112721[/C][C]-0.8731[/C][C]0.193037[/C][/ROW]
[ROW][C]46[/C][C]-0.024719[/C][C]-0.1915[/C][C]0.424401[/C][/ROW]
[ROW][C]47[/C][C]-0.003827[/C][C]-0.0296[/C][C]0.488223[/C][/ROW]
[ROW][C]48[/C][C]-0.154221[/C][C]-1.1946[/C][C]0.118474[/C][/ROW]
[/TABLE]
Source: https://freestatistics.org/blog/index.php?pk=114793&T=2

Globally Unique Identifier (entire table): ba.freestatistics.org/blog/index.php?pk=114793&T=2

As an alternative you can also use a QR Code:  

The GUIDs for individual cells are displayed in the table below:

Partial Autocorrelation Function
Time lag kPACF(k)T-STATP-value
10.339522.62990.005417
2-0.002775-0.02150.491461
3-0.034391-0.26640.395425
4-0.046487-0.36010.360023
5-0.152972-1.18490.120361
6-0.003038-0.02350.490652
7-0.008746-0.06770.473107
8-0.229604-1.77850.040194
90.0787530.610.272077
10-0.242263-1.87660.032722
11-0.354134-2.74310.004006
12-0.416165-3.22360.001024
130.1019040.78930.21651
140.1331951.03170.153171
15-0.010155-0.07870.468782
160.183331.42010.080381
17-0.002099-0.01630.493542
18-0.017259-0.13370.447049
19-0.141917-1.09930.138018
20-0.219304-1.69870.047276
210.1124640.87110.193574
22-0.153986-1.19280.118827
23-0.126841-0.98250.164898
240.0132660.10280.459248
25-0.066872-0.5180.303186
260.0245580.19020.424888
270.1336381.03520.152375
280.0290270.22480.411432
290.0707360.54790.292891
30-0.066242-0.51310.304879
31-0.024729-0.19150.424372
32-0.128896-0.99840.161042
33-0.131279-1.01690.156646
34-0.068935-0.5340.297667
350.1144360.88640.189467
36-0.079447-0.61540.270311
370.0116010.08990.464348
38-0.006335-0.04910.480512
390.0598270.46340.322371
40-0.045063-0.34910.364135
410.0456430.35350.362458
42-0.106155-0.82230.207089
430.0831480.64410.260996
44-0.111007-0.85990.196645
45-0.112721-0.87310.193037
46-0.024719-0.19150.424401
47-0.003827-0.02960.488223
48-0.154221-1.19460.118474


Parameters (Session):
par1 = 48 ; par2 = 1 ; par3 = 0 ; par4 = 1 ; par5 = 12 ; par6 = White Noise ; par7 = 0.95 ;
Parameters (R input):
par1 = 48 ; par2 = 1 ; par3 = 0 ; par4 = 1 ; par5 = 12 ; par6 = White Noise ; par7 = 0.95 ; par8 = ;
R code (references can be found in the software module):
if (par1 == 'Default') {
par1 = 10*log10(length(x))
} else {
par1 <- as.numeric(par1)
}
par2 <- as.numeric(par2)
par3 <- as.numeric(par3)
par4 <- as.numeric(par4)
par5 <- as.numeric(par5)
if (par6 == 'White Noise') par6 <- 'white' else par6 <- 'ma'
par7 <- as.numeric(par7)
if (par8 != '') par8 <- as.numeric(par8)
ox <- x
if (par8 == '') {
if (par2 == 0) {
x <- log(x)
} else {
x <- (x ^ par2 - 1) / par2
}
} else {
x <- log(x,base=par8)
}
if (par3 > 0) x <- diff(x,lag=1,difference=par3)
if (par4 > 0) x <- diff(x,lag=par5,difference=par4)
bitmap(file='picts.png')
op <- par(mfrow=c(2,1))
plot(ox,type='l',main='Original Time Series',xlab='time',ylab='value')
if (par8=='') {
mytitle <- paste('Working Time Series (lambda=',par2,', d=',par3,', D=',par4,')',sep='')
mysub <- paste('(lambda=',par2,', d=',par3,', D=',par4,', CI=', par7, ', CI type=',par6,')',sep='')
} else {
mytitle <- paste('Working Time Series (base=',par8,', d=',par3,', D=',par4,')',sep='')
mysub <- paste('(base=',par8,', d=',par3,', D=',par4,', CI=', par7, ', CI type=',par6,')',sep='')
}
plot(x,type='l', main=mytitle,xlab='time',ylab='value')
par(op)
dev.off()
bitmap(file='pic1.png')
racf <- acf(x, par1, main='Autocorrelation', xlab='time lag', ylab='ACF', ci.type=par6, ci=par7, sub=mysub)
dev.off()
bitmap(file='pic2.png')
rpacf <- pacf(x,par1,main='Partial Autocorrelation',xlab='lags',ylab='PACF',sub=mysub)
dev.off()
(myacf <- c(racf$acf))
(mypacf <- c(rpacf$acf))
lengthx <- length(x)
sqrtn <- sqrt(lengthx)
load(file='createtable')
a<-table.start()
a<-table.row.start(a)
a<-table.element(a,'Autocorrelation Function',4,TRUE)
a<-table.row.end(a)
a<-table.row.start(a)
a<-table.element(a,'Time lag k',header=TRUE)
a<-table.element(a,hyperlink('basics.htm','ACF(k)','click here for more information about the Autocorrelation Function'),header=TRUE)
a<-table.element(a,'T-STAT',header=TRUE)
a<-table.element(a,'P-value',header=TRUE)
a<-table.row.end(a)
for (i in 2:(par1+1)) {
a<-table.row.start(a)
a<-table.element(a,i-1,header=TRUE)
a<-table.element(a,round(myacf[i],6))
mytstat <- myacf[i]*sqrtn
a<-table.element(a,round(mytstat,4))
a<-table.element(a,round(1-pt(abs(mytstat),lengthx),6))
a<-table.row.end(a)
}
a<-table.end(a)
table.save(a,file='mytable.tab')
a<-table.start()
a<-table.row.start(a)
a<-table.element(a,'Partial Autocorrelation Function',4,TRUE)
a<-table.row.end(a)
a<-table.row.start(a)
a<-table.element(a,'Time lag k',header=TRUE)
a<-table.element(a,hyperlink('basics.htm','PACF(k)','click here for more information about the Partial Autocorrelation Function'),header=TRUE)
a<-table.element(a,'T-STAT',header=TRUE)
a<-table.element(a,'P-value',header=TRUE)
a<-table.row.end(a)
for (i in 1:par1) {
a<-table.row.start(a)
a<-table.element(a,i,header=TRUE)
a<-table.element(a,round(mypacf[i],6))
mytstat <- mypacf[i]*sqrtn
a<-table.element(a,round(mytstat,4))
a<-table.element(a,round(1-pt(abs(mytstat),lengthx),6))
a<-table.row.end(a)
}
a<-table.end(a)
table.save(a,file='mytable1.tab')