Free Statistics

of Irreproducible Research!

Author's title

Author*The author of this computation has been verified*
R Software Modulerwasp_autocorrelation.wasp
Title produced by software(Partial) Autocorrelation Function
Date of computationFri, 24 Dec 2010 12:00:33 +0000
Cite this page as followsStatistical Computations at FreeStatistics.org, Office for Research Development and Education, URL https://freestatistics.org/blog/index.php?v=date/2010/Dec/24/t1293191890zrbyz9zznu3c3ai.htm/, Retrieved Tue, 30 Apr 2024 06:52:05 +0000
Statistical Computations at FreeStatistics.org, Office for Research Development and Education, URL https://freestatistics.org/blog/index.php?pk=114790, Retrieved Tue, 30 Apr 2024 06:52:05 +0000
QR Codes:

Original text written by user:
IsPrivate?No (this computation is public)
User-defined keywords
Estimated Impact118
Family? (F = Feedback message, R = changed R code, M = changed R Module, P = changed Parameters, D = changed Data)
-       [(Partial) Autocorrelation Function] [Autocorrelatie 1] [2010-12-24 12:00:33] [b5e30b7400ffb7c52b5936a3d8d7c96c] [Current]
Feedback Forum

Post a new message
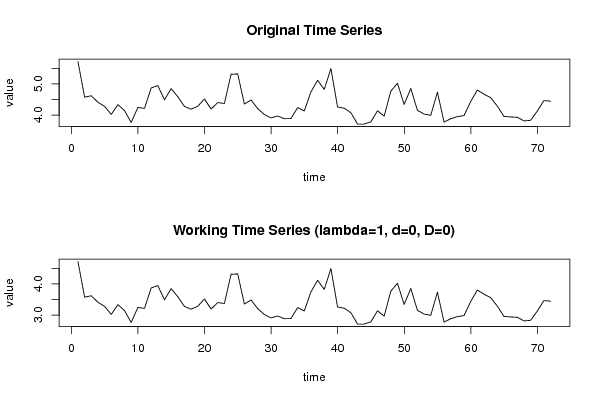
Dataseries X:
5.715
4.575
4.621
4.413
4.280
4.024
4.336
4.144
3.764
4.248
4.215
4.871
4.946
4.490
4.851
4.591
4.279
4.191
4.285
4.516
4.197
4.404
4.373
5.307
5.320
4.356
4.484
4.210
4.018
3.912
3.972
3.886
3.892
4.242
4.134
4.743

5.116
4.823
5.489
4.263
4.221
4.076
3.715
3.715
3.784
4.141
3.968
4.767
5.019
4.343
4.853
4.154
4.035
3.996
4.734
3.778
3.887
3.953
3.987
4.436
4.803
4.672
4.560
4.289
3.961
3.943
3.932
3.816
3.834
4.130
4.467
4.447


Summary of computational transaction
Raw Inputview raw input (R code)
Raw Outputview raw output of R engine
Computing time2 seconds
R Server'Gwilym Jenkins' @ 72.249.127.135
R Framework error message
Warning: there are blank lines in the 'Data' field.
Please, use NA for missing data - blank lines are simply
 deleted and are NOT treated as missing values.

\begin{tabular}{lllllllll}
\hline
Summary of computational transaction \tabularnewline
Raw Input & view raw input (R code)  \tabularnewline
Raw Output & view raw output of R engine  \tabularnewline
Computing time & 2 seconds \tabularnewline
R Server & 'Gwilym Jenkins' @ 72.249.127.135 \tabularnewline
R Framework error message & 
Warning: there are blank lines in the 'Data' field.
Please, use NA for missing data - blank lines are simply
 deleted and are NOT treated as missing values.
\tabularnewline \hline \end{tabular} %Source: https://freestatistics.org/blog/index.php?pk=114790&T=0

[TABLE]
[ROW][C]Summary of computational transaction[/C][/ROW]
[ROW][C]Raw Input[/C][C]view raw input (R code) [/C][/ROW]
[ROW][C]Raw Output[/C][C]view raw output of R engine [/C][/ROW]
[ROW][C]Computing time[/C][C]2 seconds[/C][/ROW]
[ROW][C]R Server[/C][C]'Gwilym Jenkins' @ 72.249.127.135[/C][/ROW]
[ROW][C]R Framework error message[/C][C]
Warning: there are blank lines in the 'Data' field.
Please, use NA for missing data - blank lines are simply
 deleted and are NOT treated as missing values.
[/C][/ROW] [/TABLE] Source: https://freestatistics.org/blog/index.php?pk=114790&T=0

Globally Unique Identifier (entire table): ba.freestatistics.org/blog/index.php?pk=114790&T=0

As an alternative you can also use a QR Code:  

The GUIDs for individual cells are displayed in the table below:

Summary of computational transaction
Raw Inputview raw input (R code)
Raw Outputview raw output of R engine
Computing time2 seconds
R Server'Gwilym Jenkins' @ 72.249.127.135
R Framework error message
Warning: there are blank lines in the 'Data' field.
Please, use NA for missing data - blank lines are simply
 deleted and are NOT treated as missing values.


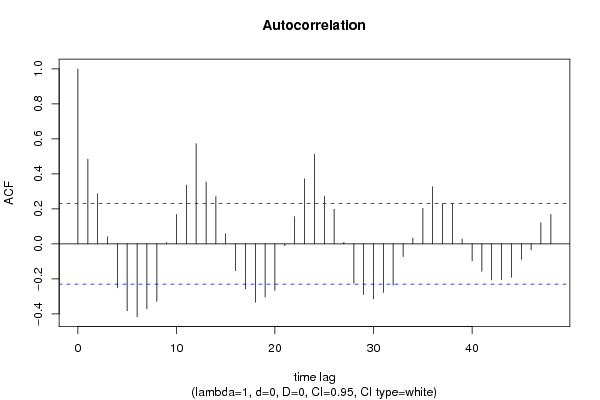
Autocorrelation Function
Time lag kACF(k)T-STATP-value
10.4841774.10845.2e-05
20.2865022.4310.008773
30.0403320.34220.366587
4-0.251635-2.13520.018074
5-0.383211-3.25170.000874
6-0.416421-3.53350.00036
7-0.371441-3.15180.001183
8-0.328816-2.79010.00337
90.0072960.06190.475403
100.1677721.42360.079442
110.3360732.85170.002836
120.5727954.86033e-06
130.3530262.99550.001878
140.2702342.2930.012385
150.0589150.49990.309332
16-0.154474-1.31080.097053
17-0.256958-2.18040.01625
18-0.333529-2.83010.003013
19-0.303543-2.57560.006029
20-0.26573-2.25480.013594
21-0.010622-0.09010.464216
220.1551271.31630.096125
230.3714823.15210.001181
240.5118334.3432.3e-05
250.2733482.31940.011606
260.1978651.67890.048749
270.0084870.0720.471395
28-0.225985-1.91750.029568
29-0.289371-2.45540.008244
30-0.314649-2.66990.004686
31-0.277971-2.35870.010529
32-0.236447-2.00630.02429
33-0.072778-0.61750.269412
340.0333230.28280.389088
350.2034141.7260.044316
360.3268492.77340.00353
370.2306831.95740.027088
380.2282051.93640.028373
390.0272780.23150.408807
40-0.097336-0.82590.205787
41-0.156921-1.33150.093609
42-0.206384-1.75120.042083
43-0.20551-1.74380.04273
44-0.191504-1.6250.05427
45-0.089207-0.75690.225777
46-0.034-0.28850.386898
470.1210341.0270.153927
480.167991.42540.079175

\begin{tabular}{lllllllll}
\hline
Autocorrelation Function \tabularnewline
Time lag k & ACF(k) & T-STAT & P-value \tabularnewline
1 & 0.484177 & 4.1084 & 5.2e-05 \tabularnewline
2 & 0.286502 & 2.431 & 0.008773 \tabularnewline
3 & 0.040332 & 0.3422 & 0.366587 \tabularnewline
4 & -0.251635 & -2.1352 & 0.018074 \tabularnewline
5 & -0.383211 & -3.2517 & 0.000874 \tabularnewline
6 & -0.416421 & -3.5335 & 0.00036 \tabularnewline
7 & -0.371441 & -3.1518 & 0.001183 \tabularnewline
8 & -0.328816 & -2.7901 & 0.00337 \tabularnewline
9 & 0.007296 & 0.0619 & 0.475403 \tabularnewline
10 & 0.167772 & 1.4236 & 0.079442 \tabularnewline
11 & 0.336073 & 2.8517 & 0.002836 \tabularnewline
12 & 0.572795 & 4.8603 & 3e-06 \tabularnewline
13 & 0.353026 & 2.9955 & 0.001878 \tabularnewline
14 & 0.270234 & 2.293 & 0.012385 \tabularnewline
15 & 0.058915 & 0.4999 & 0.309332 \tabularnewline
16 & -0.154474 & -1.3108 & 0.097053 \tabularnewline
17 & -0.256958 & -2.1804 & 0.01625 \tabularnewline
18 & -0.333529 & -2.8301 & 0.003013 \tabularnewline
19 & -0.303543 & -2.5756 & 0.006029 \tabularnewline
20 & -0.26573 & -2.2548 & 0.013594 \tabularnewline
21 & -0.010622 & -0.0901 & 0.464216 \tabularnewline
22 & 0.155127 & 1.3163 & 0.096125 \tabularnewline
23 & 0.371482 & 3.1521 & 0.001181 \tabularnewline
24 & 0.511833 & 4.343 & 2.3e-05 \tabularnewline
25 & 0.273348 & 2.3194 & 0.011606 \tabularnewline
26 & 0.197865 & 1.6789 & 0.048749 \tabularnewline
27 & 0.008487 & 0.072 & 0.471395 \tabularnewline
28 & -0.225985 & -1.9175 & 0.029568 \tabularnewline
29 & -0.289371 & -2.4554 & 0.008244 \tabularnewline
30 & -0.314649 & -2.6699 & 0.004686 \tabularnewline
31 & -0.277971 & -2.3587 & 0.010529 \tabularnewline
32 & -0.236447 & -2.0063 & 0.02429 \tabularnewline
33 & -0.072778 & -0.6175 & 0.269412 \tabularnewline
34 & 0.033323 & 0.2828 & 0.389088 \tabularnewline
35 & 0.203414 & 1.726 & 0.044316 \tabularnewline
36 & 0.326849 & 2.7734 & 0.00353 \tabularnewline
37 & 0.230683 & 1.9574 & 0.027088 \tabularnewline
38 & 0.228205 & 1.9364 & 0.028373 \tabularnewline
39 & 0.027278 & 0.2315 & 0.408807 \tabularnewline
40 & -0.097336 & -0.8259 & 0.205787 \tabularnewline
41 & -0.156921 & -1.3315 & 0.093609 \tabularnewline
42 & -0.206384 & -1.7512 & 0.042083 \tabularnewline
43 & -0.20551 & -1.7438 & 0.04273 \tabularnewline
44 & -0.191504 & -1.625 & 0.05427 \tabularnewline
45 & -0.089207 & -0.7569 & 0.225777 \tabularnewline
46 & -0.034 & -0.2885 & 0.386898 \tabularnewline
47 & 0.121034 & 1.027 & 0.153927 \tabularnewline
48 & 0.16799 & 1.4254 & 0.079175 \tabularnewline
\hline
\end{tabular}
%Source: https://freestatistics.org/blog/index.php?pk=114790&T=1

[TABLE]
[ROW][C]Autocorrelation Function[/C][/ROW]
[ROW][C]Time lag k[/C][C]ACF(k)[/C][C]T-STAT[/C][C]P-value[/C][/ROW]
[ROW][C]1[/C][C]0.484177[/C][C]4.1084[/C][C]5.2e-05[/C][/ROW]
[ROW][C]2[/C][C]0.286502[/C][C]2.431[/C][C]0.008773[/C][/ROW]
[ROW][C]3[/C][C]0.040332[/C][C]0.3422[/C][C]0.366587[/C][/ROW]
[ROW][C]4[/C][C]-0.251635[/C][C]-2.1352[/C][C]0.018074[/C][/ROW]
[ROW][C]5[/C][C]-0.383211[/C][C]-3.2517[/C][C]0.000874[/C][/ROW]
[ROW][C]6[/C][C]-0.416421[/C][C]-3.5335[/C][C]0.00036[/C][/ROW]
[ROW][C]7[/C][C]-0.371441[/C][C]-3.1518[/C][C]0.001183[/C][/ROW]
[ROW][C]8[/C][C]-0.328816[/C][C]-2.7901[/C][C]0.00337[/C][/ROW]
[ROW][C]9[/C][C]0.007296[/C][C]0.0619[/C][C]0.475403[/C][/ROW]
[ROW][C]10[/C][C]0.167772[/C][C]1.4236[/C][C]0.079442[/C][/ROW]
[ROW][C]11[/C][C]0.336073[/C][C]2.8517[/C][C]0.002836[/C][/ROW]
[ROW][C]12[/C][C]0.572795[/C][C]4.8603[/C][C]3e-06[/C][/ROW]
[ROW][C]13[/C][C]0.353026[/C][C]2.9955[/C][C]0.001878[/C][/ROW]
[ROW][C]14[/C][C]0.270234[/C][C]2.293[/C][C]0.012385[/C][/ROW]
[ROW][C]15[/C][C]0.058915[/C][C]0.4999[/C][C]0.309332[/C][/ROW]
[ROW][C]16[/C][C]-0.154474[/C][C]-1.3108[/C][C]0.097053[/C][/ROW]
[ROW][C]17[/C][C]-0.256958[/C][C]-2.1804[/C][C]0.01625[/C][/ROW]
[ROW][C]18[/C][C]-0.333529[/C][C]-2.8301[/C][C]0.003013[/C][/ROW]
[ROW][C]19[/C][C]-0.303543[/C][C]-2.5756[/C][C]0.006029[/C][/ROW]
[ROW][C]20[/C][C]-0.26573[/C][C]-2.2548[/C][C]0.013594[/C][/ROW]
[ROW][C]21[/C][C]-0.010622[/C][C]-0.0901[/C][C]0.464216[/C][/ROW]
[ROW][C]22[/C][C]0.155127[/C][C]1.3163[/C][C]0.096125[/C][/ROW]
[ROW][C]23[/C][C]0.371482[/C][C]3.1521[/C][C]0.001181[/C][/ROW]
[ROW][C]24[/C][C]0.511833[/C][C]4.343[/C][C]2.3e-05[/C][/ROW]
[ROW][C]25[/C][C]0.273348[/C][C]2.3194[/C][C]0.011606[/C][/ROW]
[ROW][C]26[/C][C]0.197865[/C][C]1.6789[/C][C]0.048749[/C][/ROW]
[ROW][C]27[/C][C]0.008487[/C][C]0.072[/C][C]0.471395[/C][/ROW]
[ROW][C]28[/C][C]-0.225985[/C][C]-1.9175[/C][C]0.029568[/C][/ROW]
[ROW][C]29[/C][C]-0.289371[/C][C]-2.4554[/C][C]0.008244[/C][/ROW]
[ROW][C]30[/C][C]-0.314649[/C][C]-2.6699[/C][C]0.004686[/C][/ROW]
[ROW][C]31[/C][C]-0.277971[/C][C]-2.3587[/C][C]0.010529[/C][/ROW]
[ROW][C]32[/C][C]-0.236447[/C][C]-2.0063[/C][C]0.02429[/C][/ROW]
[ROW][C]33[/C][C]-0.072778[/C][C]-0.6175[/C][C]0.269412[/C][/ROW]
[ROW][C]34[/C][C]0.033323[/C][C]0.2828[/C][C]0.389088[/C][/ROW]
[ROW][C]35[/C][C]0.203414[/C][C]1.726[/C][C]0.044316[/C][/ROW]
[ROW][C]36[/C][C]0.326849[/C][C]2.7734[/C][C]0.00353[/C][/ROW]
[ROW][C]37[/C][C]0.230683[/C][C]1.9574[/C][C]0.027088[/C][/ROW]
[ROW][C]38[/C][C]0.228205[/C][C]1.9364[/C][C]0.028373[/C][/ROW]
[ROW][C]39[/C][C]0.027278[/C][C]0.2315[/C][C]0.408807[/C][/ROW]
[ROW][C]40[/C][C]-0.097336[/C][C]-0.8259[/C][C]0.205787[/C][/ROW]
[ROW][C]41[/C][C]-0.156921[/C][C]-1.3315[/C][C]0.093609[/C][/ROW]
[ROW][C]42[/C][C]-0.206384[/C][C]-1.7512[/C][C]0.042083[/C][/ROW]
[ROW][C]43[/C][C]-0.20551[/C][C]-1.7438[/C][C]0.04273[/C][/ROW]
[ROW][C]44[/C][C]-0.191504[/C][C]-1.625[/C][C]0.05427[/C][/ROW]
[ROW][C]45[/C][C]-0.089207[/C][C]-0.7569[/C][C]0.225777[/C][/ROW]
[ROW][C]46[/C][C]-0.034[/C][C]-0.2885[/C][C]0.386898[/C][/ROW]
[ROW][C]47[/C][C]0.121034[/C][C]1.027[/C][C]0.153927[/C][/ROW]
[ROW][C]48[/C][C]0.16799[/C][C]1.4254[/C][C]0.079175[/C][/ROW]
[/TABLE]
Source: https://freestatistics.org/blog/index.php?pk=114790&T=1

Globally Unique Identifier (entire table): ba.freestatistics.org/blog/index.php?pk=114790&T=1

As an alternative you can also use a QR Code:  

The GUIDs for individual cells are displayed in the table below:

Autocorrelation Function
Time lag kACF(k)T-STATP-value
10.4841774.10845.2e-05
20.2865022.4310.008773
30.0403320.34220.366587
4-0.251635-2.13520.018074
5-0.383211-3.25170.000874
6-0.416421-3.53350.00036
7-0.371441-3.15180.001183
8-0.328816-2.79010.00337
90.0072960.06190.475403
100.1677721.42360.079442
110.3360732.85170.002836
120.5727954.86033e-06
130.3530262.99550.001878
140.2702342.2930.012385
150.0589150.49990.309332
16-0.154474-1.31080.097053
17-0.256958-2.18040.01625
18-0.333529-2.83010.003013
19-0.303543-2.57560.006029
20-0.26573-2.25480.013594
21-0.010622-0.09010.464216
220.1551271.31630.096125
230.3714823.15210.001181
240.5118334.3432.3e-05
250.2733482.31940.011606
260.1978651.67890.048749
270.0084870.0720.471395
28-0.225985-1.91750.029568
29-0.289371-2.45540.008244
30-0.314649-2.66990.004686
31-0.277971-2.35870.010529
32-0.236447-2.00630.02429
33-0.072778-0.61750.269412
340.0333230.28280.389088
350.2034141.7260.044316
360.3268492.77340.00353
370.2306831.95740.027088
380.2282051.93640.028373
390.0272780.23150.408807
40-0.097336-0.82590.205787
41-0.156921-1.33150.093609
42-0.206384-1.75120.042083
43-0.20551-1.74380.04273
44-0.191504-1.6250.05427
45-0.089207-0.75690.225777
46-0.034-0.28850.386898
470.1210341.0270.153927
480.167991.42540.079175


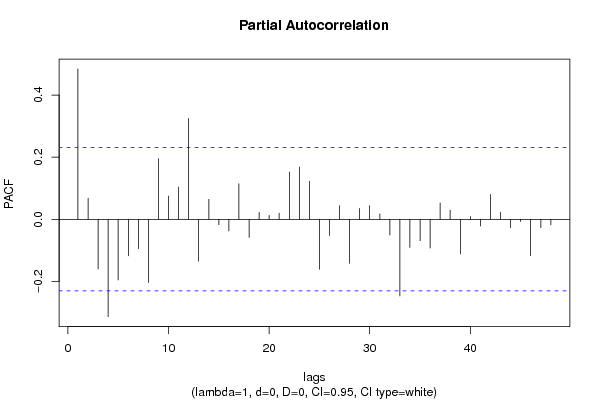
Partial Autocorrelation Function
Time lag kPACF(k)T-STATP-value
10.4841774.10845.2e-05
20.0680210.57720.282811
3-0.159946-1.35720.089481
4-0.313786-2.66260.00478
5-0.195354-1.65760.050871
6-0.117816-0.99970.160401
7-0.095188-0.80770.210963
8-0.203944-1.73050.043911
90.1954031.65810.050829
100.0745470.63260.264515
110.1035120.87830.191343
120.324892.75680.003696
13-0.135587-1.15050.126873
140.0642650.54530.293613
15-0.017504-0.14850.441171
16-0.037486-0.31810.375673
170.1143390.97020.167597
18-0.05841-0.49560.310833
190.0220210.18690.426149
200.012170.10330.45902
210.0193960.16460.434868
220.151881.28870.100806
230.1679951.42550.079169
240.122591.04020.150862
25-0.161276-1.36850.08771
26-0.052619-0.44650.328293
270.0434840.3690.356615
28-0.141845-1.20360.116344
290.0346090.29370.384928
300.0436340.37020.356142
310.0169250.14360.443105
32-0.051133-0.43390.332836
33-0.247199-2.09760.019728
34-0.090899-0.77130.221524
35-0.06926-0.58770.27929
36-0.092772-0.78720.216876
370.052060.44170.329998
380.0293780.24930.401928
39-0.111951-0.94990.172662
400.0089080.07560.469978
41-0.02209-0.18740.425923
420.0798790.67780.250038
430.022680.19240.423968
44-0.027576-0.2340.407829
45-0.007637-0.06480.474255
46-0.117211-0.99460.161638
47-0.027432-0.23280.408299
48-0.018055-0.15320.439334

\begin{tabular}{lllllllll}
\hline
Partial Autocorrelation Function \tabularnewline
Time lag k & PACF(k) & T-STAT & P-value \tabularnewline
1 & 0.484177 & 4.1084 & 5.2e-05 \tabularnewline
2 & 0.068021 & 0.5772 & 0.282811 \tabularnewline
3 & -0.159946 & -1.3572 & 0.089481 \tabularnewline
4 & -0.313786 & -2.6626 & 0.00478 \tabularnewline
5 & -0.195354 & -1.6576 & 0.050871 \tabularnewline
6 & -0.117816 & -0.9997 & 0.160401 \tabularnewline
7 & -0.095188 & -0.8077 & 0.210963 \tabularnewline
8 & -0.203944 & -1.7305 & 0.043911 \tabularnewline
9 & 0.195403 & 1.6581 & 0.050829 \tabularnewline
10 & 0.074547 & 0.6326 & 0.264515 \tabularnewline
11 & 0.103512 & 0.8783 & 0.191343 \tabularnewline
12 & 0.32489 & 2.7568 & 0.003696 \tabularnewline
13 & -0.135587 & -1.1505 & 0.126873 \tabularnewline
14 & 0.064265 & 0.5453 & 0.293613 \tabularnewline
15 & -0.017504 & -0.1485 & 0.441171 \tabularnewline
16 & -0.037486 & -0.3181 & 0.375673 \tabularnewline
17 & 0.114339 & 0.9702 & 0.167597 \tabularnewline
18 & -0.05841 & -0.4956 & 0.310833 \tabularnewline
19 & 0.022021 & 0.1869 & 0.426149 \tabularnewline
20 & 0.01217 & 0.1033 & 0.45902 \tabularnewline
21 & 0.019396 & 0.1646 & 0.434868 \tabularnewline
22 & 0.15188 & 1.2887 & 0.100806 \tabularnewline
23 & 0.167995 & 1.4255 & 0.079169 \tabularnewline
24 & 0.12259 & 1.0402 & 0.150862 \tabularnewline
25 & -0.161276 & -1.3685 & 0.08771 \tabularnewline
26 & -0.052619 & -0.4465 & 0.328293 \tabularnewline
27 & 0.043484 & 0.369 & 0.356615 \tabularnewline
28 & -0.141845 & -1.2036 & 0.116344 \tabularnewline
29 & 0.034609 & 0.2937 & 0.384928 \tabularnewline
30 & 0.043634 & 0.3702 & 0.356142 \tabularnewline
31 & 0.016925 & 0.1436 & 0.443105 \tabularnewline
32 & -0.051133 & -0.4339 & 0.332836 \tabularnewline
33 & -0.247199 & -2.0976 & 0.019728 \tabularnewline
34 & -0.090899 & -0.7713 & 0.221524 \tabularnewline
35 & -0.06926 & -0.5877 & 0.27929 \tabularnewline
36 & -0.092772 & -0.7872 & 0.216876 \tabularnewline
37 & 0.05206 & 0.4417 & 0.329998 \tabularnewline
38 & 0.029378 & 0.2493 & 0.401928 \tabularnewline
39 & -0.111951 & -0.9499 & 0.172662 \tabularnewline
40 & 0.008908 & 0.0756 & 0.469978 \tabularnewline
41 & -0.02209 & -0.1874 & 0.425923 \tabularnewline
42 & 0.079879 & 0.6778 & 0.250038 \tabularnewline
43 & 0.02268 & 0.1924 & 0.423968 \tabularnewline
44 & -0.027576 & -0.234 & 0.407829 \tabularnewline
45 & -0.007637 & -0.0648 & 0.474255 \tabularnewline
46 & -0.117211 & -0.9946 & 0.161638 \tabularnewline
47 & -0.027432 & -0.2328 & 0.408299 \tabularnewline
48 & -0.018055 & -0.1532 & 0.439334 \tabularnewline
\hline
\end{tabular}
%Source: https://freestatistics.org/blog/index.php?pk=114790&T=2

[TABLE]
[ROW][C]Partial Autocorrelation Function[/C][/ROW]
[ROW][C]Time lag k[/C][C]PACF(k)[/C][C]T-STAT[/C][C]P-value[/C][/ROW]
[ROW][C]1[/C][C]0.484177[/C][C]4.1084[/C][C]5.2e-05[/C][/ROW]
[ROW][C]2[/C][C]0.068021[/C][C]0.5772[/C][C]0.282811[/C][/ROW]
[ROW][C]3[/C][C]-0.159946[/C][C]-1.3572[/C][C]0.089481[/C][/ROW]
[ROW][C]4[/C][C]-0.313786[/C][C]-2.6626[/C][C]0.00478[/C][/ROW]
[ROW][C]5[/C][C]-0.195354[/C][C]-1.6576[/C][C]0.050871[/C][/ROW]
[ROW][C]6[/C][C]-0.117816[/C][C]-0.9997[/C][C]0.160401[/C][/ROW]
[ROW][C]7[/C][C]-0.095188[/C][C]-0.8077[/C][C]0.210963[/C][/ROW]
[ROW][C]8[/C][C]-0.203944[/C][C]-1.7305[/C][C]0.043911[/C][/ROW]
[ROW][C]9[/C][C]0.195403[/C][C]1.6581[/C][C]0.050829[/C][/ROW]
[ROW][C]10[/C][C]0.074547[/C][C]0.6326[/C][C]0.264515[/C][/ROW]
[ROW][C]11[/C][C]0.103512[/C][C]0.8783[/C][C]0.191343[/C][/ROW]
[ROW][C]12[/C][C]0.32489[/C][C]2.7568[/C][C]0.003696[/C][/ROW]
[ROW][C]13[/C][C]-0.135587[/C][C]-1.1505[/C][C]0.126873[/C][/ROW]
[ROW][C]14[/C][C]0.064265[/C][C]0.5453[/C][C]0.293613[/C][/ROW]
[ROW][C]15[/C][C]-0.017504[/C][C]-0.1485[/C][C]0.441171[/C][/ROW]
[ROW][C]16[/C][C]-0.037486[/C][C]-0.3181[/C][C]0.375673[/C][/ROW]
[ROW][C]17[/C][C]0.114339[/C][C]0.9702[/C][C]0.167597[/C][/ROW]
[ROW][C]18[/C][C]-0.05841[/C][C]-0.4956[/C][C]0.310833[/C][/ROW]
[ROW][C]19[/C][C]0.022021[/C][C]0.1869[/C][C]0.426149[/C][/ROW]
[ROW][C]20[/C][C]0.01217[/C][C]0.1033[/C][C]0.45902[/C][/ROW]
[ROW][C]21[/C][C]0.019396[/C][C]0.1646[/C][C]0.434868[/C][/ROW]
[ROW][C]22[/C][C]0.15188[/C][C]1.2887[/C][C]0.100806[/C][/ROW]
[ROW][C]23[/C][C]0.167995[/C][C]1.4255[/C][C]0.079169[/C][/ROW]
[ROW][C]24[/C][C]0.12259[/C][C]1.0402[/C][C]0.150862[/C][/ROW]
[ROW][C]25[/C][C]-0.161276[/C][C]-1.3685[/C][C]0.08771[/C][/ROW]
[ROW][C]26[/C][C]-0.052619[/C][C]-0.4465[/C][C]0.328293[/C][/ROW]
[ROW][C]27[/C][C]0.043484[/C][C]0.369[/C][C]0.356615[/C][/ROW]
[ROW][C]28[/C][C]-0.141845[/C][C]-1.2036[/C][C]0.116344[/C][/ROW]
[ROW][C]29[/C][C]0.034609[/C][C]0.2937[/C][C]0.384928[/C][/ROW]
[ROW][C]30[/C][C]0.043634[/C][C]0.3702[/C][C]0.356142[/C][/ROW]
[ROW][C]31[/C][C]0.016925[/C][C]0.1436[/C][C]0.443105[/C][/ROW]
[ROW][C]32[/C][C]-0.051133[/C][C]-0.4339[/C][C]0.332836[/C][/ROW]
[ROW][C]33[/C][C]-0.247199[/C][C]-2.0976[/C][C]0.019728[/C][/ROW]
[ROW][C]34[/C][C]-0.090899[/C][C]-0.7713[/C][C]0.221524[/C][/ROW]
[ROW][C]35[/C][C]-0.06926[/C][C]-0.5877[/C][C]0.27929[/C][/ROW]
[ROW][C]36[/C][C]-0.092772[/C][C]-0.7872[/C][C]0.216876[/C][/ROW]
[ROW][C]37[/C][C]0.05206[/C][C]0.4417[/C][C]0.329998[/C][/ROW]
[ROW][C]38[/C][C]0.029378[/C][C]0.2493[/C][C]0.401928[/C][/ROW]
[ROW][C]39[/C][C]-0.111951[/C][C]-0.9499[/C][C]0.172662[/C][/ROW]
[ROW][C]40[/C][C]0.008908[/C][C]0.0756[/C][C]0.469978[/C][/ROW]
[ROW][C]41[/C][C]-0.02209[/C][C]-0.1874[/C][C]0.425923[/C][/ROW]
[ROW][C]42[/C][C]0.079879[/C][C]0.6778[/C][C]0.250038[/C][/ROW]
[ROW][C]43[/C][C]0.02268[/C][C]0.1924[/C][C]0.423968[/C][/ROW]
[ROW][C]44[/C][C]-0.027576[/C][C]-0.234[/C][C]0.407829[/C][/ROW]
[ROW][C]45[/C][C]-0.007637[/C][C]-0.0648[/C][C]0.474255[/C][/ROW]
[ROW][C]46[/C][C]-0.117211[/C][C]-0.9946[/C][C]0.161638[/C][/ROW]
[ROW][C]47[/C][C]-0.027432[/C][C]-0.2328[/C][C]0.408299[/C][/ROW]
[ROW][C]48[/C][C]-0.018055[/C][C]-0.1532[/C][C]0.439334[/C][/ROW]
[/TABLE]
Source: https://freestatistics.org/blog/index.php?pk=114790&T=2

Globally Unique Identifier (entire table): ba.freestatistics.org/blog/index.php?pk=114790&T=2

As an alternative you can also use a QR Code:  

The GUIDs for individual cells are displayed in the table below:

Partial Autocorrelation Function
Time lag kPACF(k)T-STATP-value
10.4841774.10845.2e-05
20.0680210.57720.282811
3-0.159946-1.35720.089481
4-0.313786-2.66260.00478
5-0.195354-1.65760.050871
6-0.117816-0.99970.160401
7-0.095188-0.80770.210963
8-0.203944-1.73050.043911
90.1954031.65810.050829
100.0745470.63260.264515
110.1035120.87830.191343
120.324892.75680.003696
13-0.135587-1.15050.126873
140.0642650.54530.293613
15-0.017504-0.14850.441171
16-0.037486-0.31810.375673
170.1143390.97020.167597
18-0.05841-0.49560.310833
190.0220210.18690.426149
200.012170.10330.45902
210.0193960.16460.434868
220.151881.28870.100806
230.1679951.42550.079169
240.122591.04020.150862
25-0.161276-1.36850.08771
26-0.052619-0.44650.328293
270.0434840.3690.356615
28-0.141845-1.20360.116344
290.0346090.29370.384928
300.0436340.37020.356142
310.0169250.14360.443105
32-0.051133-0.43390.332836
33-0.247199-2.09760.019728
34-0.090899-0.77130.221524
35-0.06926-0.58770.27929
36-0.092772-0.78720.216876
370.052060.44170.329998
380.0293780.24930.401928
39-0.111951-0.94990.172662
400.0089080.07560.469978
41-0.02209-0.18740.425923
420.0798790.67780.250038
430.022680.19240.423968
44-0.027576-0.2340.407829
45-0.007637-0.06480.474255
46-0.117211-0.99460.161638
47-0.027432-0.23280.408299
48-0.018055-0.15320.439334


Parameters (Session):
par1 = 48 ; par2 = 1 ; par3 = 0 ; par4 = 0 ; par5 = 12 ; par6 = White Noise ; par7 = 0.95 ;
Parameters (R input):
par1 = 48 ; par2 = 1 ; par3 = 0 ; par4 = 0 ; par5 = 12 ; par6 = White Noise ; par7 = 0.95 ; par8 = ;
R code (references can be found in the software module):
if (par1 == 'Default') {
par1 = 10*log10(length(x))
} else {
par1 <- as.numeric(par1)
}
par2 <- as.numeric(par2)
par3 <- as.numeric(par3)
par4 <- as.numeric(par4)
par5 <- as.numeric(par5)
if (par6 == 'White Noise') par6 <- 'white' else par6 <- 'ma'
par7 <- as.numeric(par7)
if (par8 != '') par8 <- as.numeric(par8)
ox <- x
if (par8 == '') {
if (par2 == 0) {
x <- log(x)
} else {
x <- (x ^ par2 - 1) / par2
}
} else {
x <- log(x,base=par8)
}
if (par3 > 0) x <- diff(x,lag=1,difference=par3)
if (par4 > 0) x <- diff(x,lag=par5,difference=par4)
bitmap(file='picts.png')
op <- par(mfrow=c(2,1))
plot(ox,type='l',main='Original Time Series',xlab='time',ylab='value')
if (par8=='') {
mytitle <- paste('Working Time Series (lambda=',par2,', d=',par3,', D=',par4,')',sep='')
mysub <- paste('(lambda=',par2,', d=',par3,', D=',par4,', CI=', par7, ', CI type=',par6,')',sep='')
} else {
mytitle <- paste('Working Time Series (base=',par8,', d=',par3,', D=',par4,')',sep='')
mysub <- paste('(base=',par8,', d=',par3,', D=',par4,', CI=', par7, ', CI type=',par6,')',sep='')
}
plot(x,type='l', main=mytitle,xlab='time',ylab='value')
par(op)
dev.off()
bitmap(file='pic1.png')
racf <- acf(x, par1, main='Autocorrelation', xlab='time lag', ylab='ACF', ci.type=par6, ci=par7, sub=mysub)
dev.off()
bitmap(file='pic2.png')
rpacf <- pacf(x,par1,main='Partial Autocorrelation',xlab='lags',ylab='PACF',sub=mysub)
dev.off()
(myacf <- c(racf$acf))
(mypacf <- c(rpacf$acf))
lengthx <- length(x)
sqrtn <- sqrt(lengthx)
load(file='createtable')
a<-table.start()
a<-table.row.start(a)
a<-table.element(a,'Autocorrelation Function',4,TRUE)
a<-table.row.end(a)
a<-table.row.start(a)
a<-table.element(a,'Time lag k',header=TRUE)
a<-table.element(a,hyperlink('basics.htm','ACF(k)','click here for more information about the Autocorrelation Function'),header=TRUE)
a<-table.element(a,'T-STAT',header=TRUE)
a<-table.element(a,'P-value',header=TRUE)
a<-table.row.end(a)
for (i in 2:(par1+1)) {
a<-table.row.start(a)
a<-table.element(a,i-1,header=TRUE)
a<-table.element(a,round(myacf[i],6))
mytstat <- myacf[i]*sqrtn
a<-table.element(a,round(mytstat,4))
a<-table.element(a,round(1-pt(abs(mytstat),lengthx),6))
a<-table.row.end(a)
}
a<-table.end(a)
table.save(a,file='mytable.tab')
a<-table.start()
a<-table.row.start(a)
a<-table.element(a,'Partial Autocorrelation Function',4,TRUE)
a<-table.row.end(a)
a<-table.row.start(a)
a<-table.element(a,'Time lag k',header=TRUE)
a<-table.element(a,hyperlink('basics.htm','PACF(k)','click here for more information about the Partial Autocorrelation Function'),header=TRUE)
a<-table.element(a,'T-STAT',header=TRUE)
a<-table.element(a,'P-value',header=TRUE)
a<-table.row.end(a)
for (i in 1:par1) {
a<-table.row.start(a)
a<-table.element(a,i,header=TRUE)
a<-table.element(a,round(mypacf[i],6))
mytstat <- mypacf[i]*sqrtn
a<-table.element(a,round(mytstat,4))
a<-table.element(a,round(1-pt(abs(mytstat),lengthx),6))
a<-table.row.end(a)
}
a<-table.end(a)
table.save(a,file='mytable1.tab')