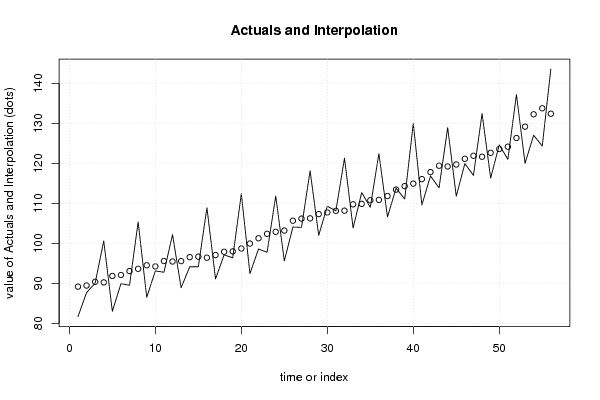
| Multiple Linear Regression - Estimated Regression Equation |
| LKI[t] = -47.7762553333726 + 1.6142611431639CPI[t] + e[t] |
| Multiple Linear Regression - Ordinary Least Squares | |||||
| Variable | Parameter | S.D. | T-STAT H0: parameter = 0 | 2-tail p-value | 1-tail p-value |
| (Intercept) | -47.7762553333726 | 12.116984 | -3.9429 | 0.000234 | 0.000117 |
| CPI | 1.6142611431639 | 0.125506 | 12.862 | 0 | 0 |
| Multiple Linear Regression - Regression Statistics | |
| Multiple R | 0.868279845574862 |
| R-squared | 0.753909890231506 |
| Adjusted R-squared | 0.749352665976534 |
| F-TEST (value) | 165.431817275386 |
| F-TEST (DF numerator) | 1 |
| F-TEST (DF denominator) | 54 |
| p-value | 0 |
| Multiple Linear Regression - Residual Statistics | |
| Residual Standard Deviation | 7.25340453011476 |
| Sum Squared Residuals | 2841.04137298442 |
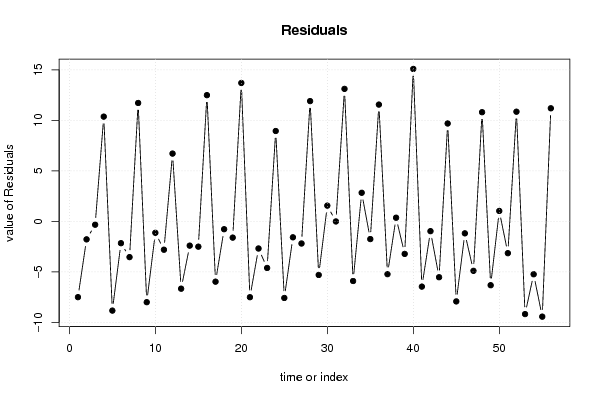
| Multiple Linear Regression - Actuals, Interpolation, and Residuals | |||
| Time or Index | Actuals | Interpolation Forecast | Residuals Prediction Error |
| 1 | 81.71 | 89.2099452755156 | -7.49994527551565 |
| 2 | 87.703 | 89.4843696698534 | -1.78136966985342 |
| 3 | 90.09 | 90.4206411328885 | -0.330641132888482 |
| 4 | 100.639 | 90.2753576300037 | 10.3636423699963 |
| 5 | 83.042 | 91.873476161736 | -8.831476161736 |
| 6 | 89.956 | 92.1156153332106 | -2.15961533321057 |
| 7 | 89.561 | 93.1003146305406 | -3.53931463054054 |
| 8 | 105.38 | 93.665306030648 | 11.7146939693521 |
| 9 | 86.554 | 94.553149659388 | -7.99914965938806 |
| 10 | 93.131 | 94.2625826536186 | -1.13158265361855 |
| 11 | 92.812 | 95.6185620138762 | -2.80656201387623 |
| 12 | 102.195 | 95.4894211224231 | 6.70557887757687 |
| 13 | 88.925 | 95.586276791013 | -6.66127679101296 |
| 14 | 94.184 | 96.5871186997746 | -2.40311869977458 |
| 15 | 94.196 | 96.700116979796 | -2.50411697979604 |
| 16 | 108.932 | 96.4418351968898 | 12.4901648031102 |
| 17 | 91.134 | 97.103682265587 | -5.96968226558702 |
| 18 | 97.149 | 97.9269554486006 | -0.777955448600611 |
| 19 | 96.415 | 98.0238111171904 | -1.60881111719042 |
| 20 | 112.432 | 98.7340860201826 | 13.6979139798174 |
| 21 | 92.47 | 99.9770671004188 | -7.50706710041875 |
| 22 | 98.61410515 | 101.300761237813 | -2.68665608781314 |
| 23 | 97.80117197 | 102.414601426596 | -4.61342945659625 |
| 24 | 111.8560178 | 102.915022380977 | 8.94099541902297 |
| 25 | 95.63981455 | 103.221731998178 | -7.5819174481782 |
| 26 | 104.1120262 | 105.691551547219 | -1.57952534721893 |
| 27 | 104.0148224 | 106.208115113031 | -2.19329271303139 |
| 28 | 118.1743476 | 106.272685558758 | 11.901662041242 |
| 29 | 102.033431 | 107.338097913246 | -5.30466691324613 |
| 30 | 109.3138852 | 107.757805810469 | 1.55607938953128 |
| 31 | 108.1523649 | 108.16137109626 | -0.00900619625969844 |
| 32 | 121.30381 | 108.193656319123 | 13.110153680877 |
| 33 | 103.8725146 | 109.775632239424 | -5.90311763942359 |
| 34 | 112.7185207 | 109.888630519445 | 2.82989018055493 |
| 35 | 109.0381253 | 110.792616759617 | -1.75449145961685 |
| 36 | 122.4434864 | 110.889472428207 | 11.5540139717933 |
| 37 | 106.6325686 | 111.858029114105 | -5.22546051410503 |
| 38 | 113.8153852 | 113.456147645837 | 0.359237554162722 |
| 39 | 111.1071252 | 114.327848663146 | -3.22072346314579 |
| 40 | 130.039536 | 114.95741050898 | 15.0821254910203 |
| 41 | 109.6121057 | 116.071250697763 | -6.45914499776279 |
| 42 | 116.8592117 | 117.830795343811 | -0.97158364381144 |
| 43 | 113.8982545 | 119.428913875544 | -5.5306593755437 |
| 44 | 128.9375926 | 119.251345149796 | 9.68624745020432 |
| 45 | 111.8120023 | 119.735623492745 | -7.92362119274482 |
| 46 | 119.9689463 | 121.156173298729 | -1.18722699872907 |
| 47 | 117.018539 | 121.914876036016 | -4.89633703601609 |
| 48 | 132.4743387 | 121.672736864542 | 10.8016018354585 |
| 49 | 116.3369106 | 122.657436161871 | -6.32052556187149 |
| 50 | 124.6405636 | 123.609850236338 | 1.03071336366181 |
| 51 | 121.025249 | 124.174841636446 | -3.14959263644554 |
| 52 | 137.2054829 | 126.354094179717 | 10.8513887202832 |
| 53 | 120.0187687 | 129.195193791685 | -9.17642509168526 |
| 54 | 127.0443429 | 132.278432575128 | -5.23408967512832 |
| 55 | 124.349043 | 133.779695438271 | -9.43065243827073 |
| 56 | 143.6114438 | 132.423716078013 | 11.1877277219869 |
| Goldfeld-Quandt test for Heteroskedasticity | |||
| p-values | Alternative Hypothesis | ||
| breakpoint index | greater | 2-sided | less |
| 5 | 0.753466226164995 | 0.493067547670009 | 0.246533773835005 |
| 6 | 0.611667619349238 | 0.776664761301524 | 0.388332380650762 |
| 7 | 0.467554213735781 | 0.935108427471563 | 0.532445786264219 |
| 8 | 0.65934024140233 | 0.68131951719534 | 0.34065975859767 |
| 9 | 0.691579757638288 | 0.616840484723424 | 0.308420242361712 |
| 10 | 0.586060967305494 | 0.827878065389012 | 0.413939032694506 |
| 11 | 0.484733267465191 | 0.969466534930382 | 0.515266732534809 |
| 12 | 0.474684324922186 | 0.949368649844371 | 0.525315675077815 |
| 13 | 0.453309820044304 | 0.906619640088609 | 0.546690179955696 |
| 14 | 0.364926450397829 | 0.729852900795659 | 0.63507354960217 |
| 15 | 0.285659393052765 | 0.571318786105529 | 0.714340606947235 |
| 16 | 0.457843204079954 | 0.915686408159908 | 0.542156795920046 |
| 17 | 0.435886760961314 | 0.871773521922628 | 0.564113239038686 |
| 18 | 0.353453930929204 | 0.706907861858408 | 0.646546069070796 |
| 19 | 0.281906802114932 | 0.563813604229863 | 0.718093197885068 |
| 20 | 0.44540689856288 | 0.89081379712576 | 0.55459310143712 |
| 21 | 0.477694130936846 | 0.955388261873692 | 0.522305869063154 |
| 22 | 0.41401348703048 | 0.82802697406096 | 0.58598651296952 |
| 23 | 0.373647883287073 | 0.747295766574147 | 0.626352116712927 |
| 24 | 0.393093550455493 | 0.786187100910987 | 0.606906449544507 |
| 25 | 0.419705384611607 | 0.839410769223214 | 0.580294615388393 |
| 26 | 0.352950245262099 | 0.705900490524198 | 0.647049754737901 |
| 27 | 0.295937127460256 | 0.591874254920511 | 0.704062872539744 |
| 28 | 0.380142969143599 | 0.760285938287198 | 0.619857030856401 |
| 29 | 0.366773100365042 | 0.733546200730083 | 0.633226899634958 |
| 30 | 0.296131185534756 | 0.592262371069513 | 0.703868814465244 |
| 31 | 0.234953846508761 | 0.469907693017523 | 0.765046153491239 |
| 32 | 0.329107651076494 | 0.658215302152988 | 0.670892348923506 |
| 33 | 0.329592882501272 | 0.659185765002545 | 0.670407117498728 |
| 34 | 0.261645534698039 | 0.523291069396078 | 0.738354465301961 |
| 35 | 0.212055795516086 | 0.424111591032171 | 0.787944204483914 |
| 36 | 0.261907856142785 | 0.52381571228557 | 0.738092143857215 |
| 37 | 0.245569731609281 | 0.491139463218561 | 0.754430268390719 |
| 38 | 0.185376116352387 | 0.370752232704774 | 0.814623883647613 |
| 39 | 0.15294500619706 | 0.305890012394121 | 0.84705499380294 |
| 40 | 0.308696591857702 | 0.617393183715404 | 0.691303408142298 |
| 41 | 0.29673819656623 | 0.59347639313246 | 0.70326180343377 |
| 42 | 0.226310454616637 | 0.452620909233274 | 0.773689545383363 |
| 43 | 0.203439686013746 | 0.406879372027492 | 0.796560313986254 |
| 44 | 0.230672453352898 | 0.461344906705796 | 0.769327546647102 |
| 45 | 0.240253795729694 | 0.480507591459387 | 0.759746204270306 |
| 46 | 0.171052538316603 | 0.342105076633206 | 0.828947461683397 |
| 47 | 0.146533147330338 | 0.293066294660676 | 0.853466852669662 |
| 48 | 0.174910175293795 | 0.349820350587589 | 0.825089824706206 |
| 49 | 0.15167031133807 | 0.303340622676139 | 0.84832968866193 |
| 50 | 0.0860347266067153 | 0.172069453213431 | 0.913965273393285 |
| 51 | 0.0684863175825185 | 0.136972635165037 | 0.931513682417482 |
| Meta Analysis of Goldfeld-Quandt test for Heteroskedasticity | |||
| Description | # significant tests | % significant tests | OK/NOK |
| 1% type I error level | 0 | 0 | OK |
| 5% type I error level | 0 | 0 | OK |
| 10% type I error level | 0 | 0 | OK |