Free Statistics

of Irreproducible Research!

Author's title

Author*The author of this computation has been verified*
R Software Modulerwasp_arimaforecasting.wasp
Title produced by softwareARIMA Forecasting
Date of computationFri, 24 Dec 2010 11:27:40 +0000
Cite this page as followsStatistical Computations at FreeStatistics.org, Office for Research Development and Education, URL https://freestatistics.org/blog/index.php?v=date/2010/Dec/24/t12931899553zl0lryp32d69te.htm/, Retrieved Tue, 30 Apr 2024 00:05:03 +0000
Statistical Computations at FreeStatistics.org, Office for Research Development and Education, URL https://freestatistics.org/blog/index.php?pk=114772, Retrieved Tue, 30 Apr 2024 00:05:03 +0000
QR Codes:

Original text written by user:
IsPrivate?No (this computation is public)
User-defined keywords
Estimated Impact113
Family? (F = Feedback message, R = changed R code, M = changed R Module, P = changed Parameters, D = changed Data)
-       [ARIMA Forecasting] [ARIMA forecast pa...] [2010-12-24 11:27:40] [efffa7146cfe4c2b113f6c7f36d84ca0] [Current]
Feedback Forum

Post a new message
Dataseries X:
14544
15116
17413
16181
15607
17160
14915
13768
17487
16198
17535
16571
16198
16554
19554
15903
18003
18329
16260
14851
18174
18406
18466
16016
17428
17167
19630
17183
18344
19301
18147
16192
18374
20515
18957
16471
18746
19009
19211
20547
19325
20605
20056
16141
20359
19711
15638
14384
13855
14308
15290
14423
13779
15686
14733
12522
16189
16059
16007
15806
15160


Summary of computational transaction
Raw Inputview raw input (R code)
Raw Outputview raw output of R engine
Computing time4 seconds
R Server'Sir Ronald Aylmer Fisher' @ 193.190.124.24

\begin{tabular}{lllllllll}
\hline
Summary of computational transaction \tabularnewline
Raw Input & view raw input (R code)  \tabularnewline
Raw Output & view raw output of R engine  \tabularnewline
Computing time & 4 seconds \tabularnewline
R Server & 'Sir Ronald Aylmer Fisher' @ 193.190.124.24 \tabularnewline
\hline
\end{tabular}
%Source: https://freestatistics.org/blog/index.php?pk=114772&T=0

[TABLE]
[ROW][C]Summary of computational transaction[/C][/ROW]
[ROW][C]Raw Input[/C][C]view raw input (R code) [/C][/ROW]
[ROW][C]Raw Output[/C][C]view raw output of R engine [/C][/ROW]
[ROW][C]Computing time[/C][C]4 seconds[/C][/ROW]
[ROW][C]R Server[/C][C]'Sir Ronald Aylmer Fisher' @ 193.190.124.24[/C][/ROW]
[/TABLE]
Source: https://freestatistics.org/blog/index.php?pk=114772&T=0

Globally Unique Identifier (entire table): ba.freestatistics.org/blog/index.php?pk=114772&T=0

As an alternative you can also use a QR Code:  

The GUIDs for individual cells are displayed in the table below:

Summary of computational transaction
Raw Inputview raw input (R code)
Raw Outputview raw output of R engine
Computing time4 seconds
R Server'Sir Ronald Aylmer Fisher' @ 193.190.124.24


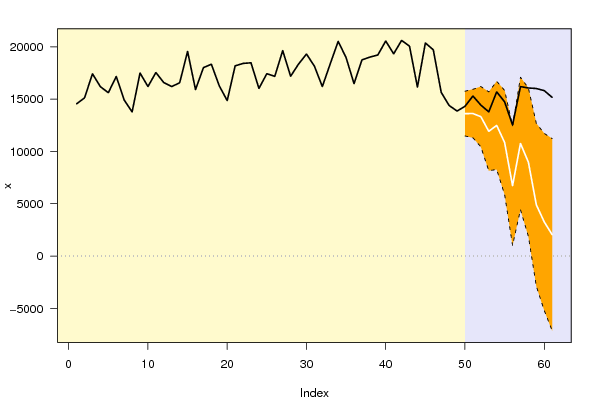
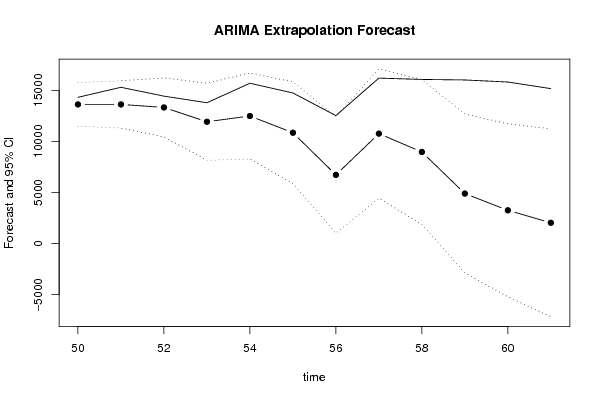
Univariate ARIMA Extrapolation Forecast
timeY[t]F[t]95% LB95% UBp-value(H0: Y[t] = F[t])P(F[t]>Y[t-1])P(F[t]>Y[t-s])P(F[t]>Y[49])
3718746-------
3819009-------
3919211-------
4020547-------
4119325-------
4220605-------
4320056-------
4416141-------
4520359-------
4619711-------
4715638-------
4814384-------
4913855-------
501430813612.44211472.94315751.94110.2620.412100.4121
511529013615.090811299.495515930.6860.07810.278800.4195
521442313315.753610434.144416197.36270.22570.089700.3569
531377911919.40278156.105515682.69990.16640.09611e-040.1567
541568612480.71368265.220116696.20720.06810.2731e-040.2614
551473310845.82585865.794915825.85680.0630.02841e-040.1181
56125226720.12851009.782412430.47460.02320.0036e-040.0072
571618910756.86324429.500117084.22620.04620.29230.00150.1686
58160598963.14171871.918616054.36480.02490.02290.00150.0882
59160074892.2825-2889.414112673.97910.00260.00250.00340.012
60158063257.2085-5202.279111716.69610.00180.00160.0050.007
61151602036.6329-7146.589511219.85530.00250.00160.00580.0058

\begin{tabular}{lllllllll}
\hline
Univariate ARIMA Extrapolation Forecast \tabularnewline
time & Y[t] & F[t] & 95% LB & 95% UB & p-value(H0: Y[t] = F[t]) & P(F[t]>Y[t-1]) & P(F[t]>Y[t-s]) & P(F[t]>Y[49]) \tabularnewline
37 & 18746 & - & - & - & - & - & - & - \tabularnewline
38 & 19009 & - & - & - & - & - & - & - \tabularnewline
39 & 19211 & - & - & - & - & - & - & - \tabularnewline
40 & 20547 & - & - & - & - & - & - & - \tabularnewline
41 & 19325 & - & - & - & - & - & - & - \tabularnewline
42 & 20605 & - & - & - & - & - & - & - \tabularnewline
43 & 20056 & - & - & - & - & - & - & - \tabularnewline
44 & 16141 & - & - & - & - & - & - & - \tabularnewline
45 & 20359 & - & - & - & - & - & - & - \tabularnewline
46 & 19711 & - & - & - & - & - & - & - \tabularnewline
47 & 15638 & - & - & - & - & - & - & - \tabularnewline
48 & 14384 & - & - & - & - & - & - & - \tabularnewline
49 & 13855 & - & - & - & - & - & - & - \tabularnewline
50 & 14308 & 13612.442 & 11472.943 & 15751.9411 & 0.262 & 0.4121 & 0 & 0.4121 \tabularnewline
51 & 15290 & 13615.0908 & 11299.4955 & 15930.686 & 0.0781 & 0.2788 & 0 & 0.4195 \tabularnewline
52 & 14423 & 13315.7536 & 10434.1444 & 16197.3627 & 0.2257 & 0.0897 & 0 & 0.3569 \tabularnewline
53 & 13779 & 11919.4027 & 8156.1055 & 15682.6999 & 0.1664 & 0.0961 & 1e-04 & 0.1567 \tabularnewline
54 & 15686 & 12480.7136 & 8265.2201 & 16696.2072 & 0.0681 & 0.273 & 1e-04 & 0.2614 \tabularnewline
55 & 14733 & 10845.8258 & 5865.7949 & 15825.8568 & 0.063 & 0.0284 & 1e-04 & 0.1181 \tabularnewline
56 & 12522 & 6720.1285 & 1009.7824 & 12430.4746 & 0.0232 & 0.003 & 6e-04 & 0.0072 \tabularnewline
57 & 16189 & 10756.8632 & 4429.5001 & 17084.2262 & 0.0462 & 0.2923 & 0.0015 & 0.1686 \tabularnewline
58 & 16059 & 8963.1417 & 1871.9186 & 16054.3648 & 0.0249 & 0.0229 & 0.0015 & 0.0882 \tabularnewline
59 & 16007 & 4892.2825 & -2889.4141 & 12673.9791 & 0.0026 & 0.0025 & 0.0034 & 0.012 \tabularnewline
60 & 15806 & 3257.2085 & -5202.2791 & 11716.6961 & 0.0018 & 0.0016 & 0.005 & 0.007 \tabularnewline
61 & 15160 & 2036.6329 & -7146.5895 & 11219.8553 & 0.0025 & 0.0016 & 0.0058 & 0.0058 \tabularnewline
\hline
\end{tabular}
%Source: https://freestatistics.org/blog/index.php?pk=114772&T=1

[TABLE]
[ROW][C]Univariate ARIMA Extrapolation Forecast[/C][/ROW]
[ROW][C]time[/C][C]Y[t][/C][C]F[t][/C][C]95% LB[/C][C]95% UB[/C][C]p-value(H0: Y[t] = F[t])[/C][C]P(F[t]>Y[t-1])[/C][C]P(F[t]>Y[t-s])[/C][C]P(F[t]>Y[49])[/C][/ROW]
[ROW][C]37[/C][C]18746[/C][C]-[/C][C]-[/C][C]-[/C][C]-[/C][C]-[/C][C]-[/C][C]-[/C][/ROW]
[ROW][C]38[/C][C]19009[/C][C]-[/C][C]-[/C][C]-[/C][C]-[/C][C]-[/C][C]-[/C][C]-[/C][/ROW]
[ROW][C]39[/C][C]19211[/C][C]-[/C][C]-[/C][C]-[/C][C]-[/C][C]-[/C][C]-[/C][C]-[/C][/ROW]
[ROW][C]40[/C][C]20547[/C][C]-[/C][C]-[/C][C]-[/C][C]-[/C][C]-[/C][C]-[/C][C]-[/C][/ROW]
[ROW][C]41[/C][C]19325[/C][C]-[/C][C]-[/C][C]-[/C][C]-[/C][C]-[/C][C]-[/C][C]-[/C][/ROW]
[ROW][C]42[/C][C]20605[/C][C]-[/C][C]-[/C][C]-[/C][C]-[/C][C]-[/C][C]-[/C][C]-[/C][/ROW]
[ROW][C]43[/C][C]20056[/C][C]-[/C][C]-[/C][C]-[/C][C]-[/C][C]-[/C][C]-[/C][C]-[/C][/ROW]
[ROW][C]44[/C][C]16141[/C][C]-[/C][C]-[/C][C]-[/C][C]-[/C][C]-[/C][C]-[/C][C]-[/C][/ROW]
[ROW][C]45[/C][C]20359[/C][C]-[/C][C]-[/C][C]-[/C][C]-[/C][C]-[/C][C]-[/C][C]-[/C][/ROW]
[ROW][C]46[/C][C]19711[/C][C]-[/C][C]-[/C][C]-[/C][C]-[/C][C]-[/C][C]-[/C][C]-[/C][/ROW]
[ROW][C]47[/C][C]15638[/C][C]-[/C][C]-[/C][C]-[/C][C]-[/C][C]-[/C][C]-[/C][C]-[/C][/ROW]
[ROW][C]48[/C][C]14384[/C][C]-[/C][C]-[/C][C]-[/C][C]-[/C][C]-[/C][C]-[/C][C]-[/C][/ROW]
[ROW][C]49[/C][C]13855[/C][C]-[/C][C]-[/C][C]-[/C][C]-[/C][C]-[/C][C]-[/C][C]-[/C][/ROW]
[ROW][C]50[/C][C]14308[/C][C]13612.442[/C][C]11472.943[/C][C]15751.9411[/C][C]0.262[/C][C]0.4121[/C][C]0[/C][C]0.4121[/C][/ROW]
[ROW][C]51[/C][C]15290[/C][C]13615.0908[/C][C]11299.4955[/C][C]15930.686[/C][C]0.0781[/C][C]0.2788[/C][C]0[/C][C]0.4195[/C][/ROW]
[ROW][C]52[/C][C]14423[/C][C]13315.7536[/C][C]10434.1444[/C][C]16197.3627[/C][C]0.2257[/C][C]0.0897[/C][C]0[/C][C]0.3569[/C][/ROW]
[ROW][C]53[/C][C]13779[/C][C]11919.4027[/C][C]8156.1055[/C][C]15682.6999[/C][C]0.1664[/C][C]0.0961[/C][C]1e-04[/C][C]0.1567[/C][/ROW]
[ROW][C]54[/C][C]15686[/C][C]12480.7136[/C][C]8265.2201[/C][C]16696.2072[/C][C]0.0681[/C][C]0.273[/C][C]1e-04[/C][C]0.2614[/C][/ROW]
[ROW][C]55[/C][C]14733[/C][C]10845.8258[/C][C]5865.7949[/C][C]15825.8568[/C][C]0.063[/C][C]0.0284[/C][C]1e-04[/C][C]0.1181[/C][/ROW]
[ROW][C]56[/C][C]12522[/C][C]6720.1285[/C][C]1009.7824[/C][C]12430.4746[/C][C]0.0232[/C][C]0.003[/C][C]6e-04[/C][C]0.0072[/C][/ROW]
[ROW][C]57[/C][C]16189[/C][C]10756.8632[/C][C]4429.5001[/C][C]17084.2262[/C][C]0.0462[/C][C]0.2923[/C][C]0.0015[/C][C]0.1686[/C][/ROW]
[ROW][C]58[/C][C]16059[/C][C]8963.1417[/C][C]1871.9186[/C][C]16054.3648[/C][C]0.0249[/C][C]0.0229[/C][C]0.0015[/C][C]0.0882[/C][/ROW]
[ROW][C]59[/C][C]16007[/C][C]4892.2825[/C][C]-2889.4141[/C][C]12673.9791[/C][C]0.0026[/C][C]0.0025[/C][C]0.0034[/C][C]0.012[/C][/ROW]
[ROW][C]60[/C][C]15806[/C][C]3257.2085[/C][C]-5202.2791[/C][C]11716.6961[/C][C]0.0018[/C][C]0.0016[/C][C]0.005[/C][C]0.007[/C][/ROW]
[ROW][C]61[/C][C]15160[/C][C]2036.6329[/C][C]-7146.5895[/C][C]11219.8553[/C][C]0.0025[/C][C]0.0016[/C][C]0.0058[/C][C]0.0058[/C][/ROW]
[/TABLE]
Source: https://freestatistics.org/blog/index.php?pk=114772&T=1

Globally Unique Identifier (entire table): ba.freestatistics.org/blog/index.php?pk=114772&T=1

As an alternative you can also use a QR Code:  

The GUIDs for individual cells are displayed in the table below:

Univariate ARIMA Extrapolation Forecast
timeY[t]F[t]95% LB95% UBp-value(H0: Y[t] = F[t])P(F[t]>Y[t-1])P(F[t]>Y[t-s])P(F[t]>Y[49])
3718746-------
3819009-------
3919211-------
4020547-------
4119325-------
4220605-------
4320056-------
4416141-------
4520359-------
4619711-------
4715638-------
4814384-------
4913855-------
501430813612.44211472.94315751.94110.2620.412100.4121
511529013615.090811299.495515930.6860.07810.278800.4195
521442313315.753610434.144416197.36270.22570.089700.3569
531377911919.40278156.105515682.69990.16640.09611e-040.1567
541568612480.71368265.220116696.20720.06810.2731e-040.2614
551473310845.82585865.794915825.85680.0630.02841e-040.1181
56125226720.12851009.782412430.47460.02320.0036e-040.0072
571618910756.86324429.500117084.22620.04620.29230.00150.1686
58160598963.14171871.918616054.36480.02490.02290.00150.0882
59160074892.2825-2889.414112673.97910.00260.00250.00340.012
60158063257.2085-5202.279111716.69610.00180.00160.0050.007
61151602036.6329-7146.589511219.85530.00250.00160.00580.0058


Univariate ARIMA Extrapolation Forecast Performance
time% S.E.PEMAPESq.EMSERMSE
500.08020.05110483800.867500
510.08680.1230.08712805320.8931644560.88031282.4043
520.11040.08320.08581225994.69551505038.81871226.8002
530.16110.1560.10333458101.98611993304.61051411.8444
540.17230.25680.13410273860.69253649415.82691910.3444
550.23430.35840.171415110123.01375559533.69142357.8663
560.43350.86340.270333661712.88799574130.71953094.2092
570.30010.5050.299629508110.653412065878.21123473.5973
580.40360.79170.354350351204.935116319803.40274039.7776
590.81152.27190.546123536945.160927041517.57865200.1459
601.32513.85260.8466157472167.265438898849.36836236.8942
612.30056.44371.3131172222764.729650009175.64847071.7166

\begin{tabular}{lllllllll}
\hline
Univariate ARIMA Extrapolation Forecast Performance \tabularnewline
time & % S.E. & PE & MAPE & Sq.E & MSE & RMSE \tabularnewline
50 & 0.0802 & 0.0511 & 0 & 483800.8675 & 0 & 0 \tabularnewline
51 & 0.0868 & 0.123 & 0.0871 & 2805320.893 & 1644560.8803 & 1282.4043 \tabularnewline
52 & 0.1104 & 0.0832 & 0.0858 & 1225994.6955 & 1505038.8187 & 1226.8002 \tabularnewline
53 & 0.1611 & 0.156 & 0.1033 & 3458101.9861 & 1993304.6105 & 1411.8444 \tabularnewline
54 & 0.1723 & 0.2568 & 0.134 & 10273860.6925 & 3649415.8269 & 1910.3444 \tabularnewline
55 & 0.2343 & 0.3584 & 0.1714 & 15110123.0137 & 5559533.6914 & 2357.8663 \tabularnewline
56 & 0.4335 & 0.8634 & 0.2703 & 33661712.8879 & 9574130.7195 & 3094.2092 \tabularnewline
57 & 0.3001 & 0.505 & 0.2996 & 29508110.6534 & 12065878.2112 & 3473.5973 \tabularnewline
58 & 0.4036 & 0.7917 & 0.3543 & 50351204.9351 & 16319803.4027 & 4039.7776 \tabularnewline
59 & 0.8115 & 2.2719 & 0.546 & 123536945.1609 & 27041517.5786 & 5200.1459 \tabularnewline
60 & 1.3251 & 3.8526 & 0.8466 & 157472167.2654 & 38898849.3683 & 6236.8942 \tabularnewline
61 & 2.3005 & 6.4437 & 1.3131 & 172222764.7296 & 50009175.6484 & 7071.7166 \tabularnewline
\hline
\end{tabular}
%Source: https://freestatistics.org/blog/index.php?pk=114772&T=2

[TABLE]
[ROW][C]Univariate ARIMA Extrapolation Forecast Performance[/C][/ROW]
[ROW][C]time[/C][C]% S.E.[/C][C]PE[/C][C]MAPE[/C][C]Sq.E[/C][C]MSE[/C][C]RMSE[/C][/ROW]
[ROW][C]50[/C][C]0.0802[/C][C]0.0511[/C][C]0[/C][C]483800.8675[/C][C]0[/C][C]0[/C][/ROW]
[ROW][C]51[/C][C]0.0868[/C][C]0.123[/C][C]0.0871[/C][C]2805320.893[/C][C]1644560.8803[/C][C]1282.4043[/C][/ROW]
[ROW][C]52[/C][C]0.1104[/C][C]0.0832[/C][C]0.0858[/C][C]1225994.6955[/C][C]1505038.8187[/C][C]1226.8002[/C][/ROW]
[ROW][C]53[/C][C]0.1611[/C][C]0.156[/C][C]0.1033[/C][C]3458101.9861[/C][C]1993304.6105[/C][C]1411.8444[/C][/ROW]
[ROW][C]54[/C][C]0.1723[/C][C]0.2568[/C][C]0.134[/C][C]10273860.6925[/C][C]3649415.8269[/C][C]1910.3444[/C][/ROW]
[ROW][C]55[/C][C]0.2343[/C][C]0.3584[/C][C]0.1714[/C][C]15110123.0137[/C][C]5559533.6914[/C][C]2357.8663[/C][/ROW]
[ROW][C]56[/C][C]0.4335[/C][C]0.8634[/C][C]0.2703[/C][C]33661712.8879[/C][C]9574130.7195[/C][C]3094.2092[/C][/ROW]
[ROW][C]57[/C][C]0.3001[/C][C]0.505[/C][C]0.2996[/C][C]29508110.6534[/C][C]12065878.2112[/C][C]3473.5973[/C][/ROW]
[ROW][C]58[/C][C]0.4036[/C][C]0.7917[/C][C]0.3543[/C][C]50351204.9351[/C][C]16319803.4027[/C][C]4039.7776[/C][/ROW]
[ROW][C]59[/C][C]0.8115[/C][C]2.2719[/C][C]0.546[/C][C]123536945.1609[/C][C]27041517.5786[/C][C]5200.1459[/C][/ROW]
[ROW][C]60[/C][C]1.3251[/C][C]3.8526[/C][C]0.8466[/C][C]157472167.2654[/C][C]38898849.3683[/C][C]6236.8942[/C][/ROW]
[ROW][C]61[/C][C]2.3005[/C][C]6.4437[/C][C]1.3131[/C][C]172222764.7296[/C][C]50009175.6484[/C][C]7071.7166[/C][/ROW]
[/TABLE]
Source: https://freestatistics.org/blog/index.php?pk=114772&T=2

Globally Unique Identifier (entire table): ba.freestatistics.org/blog/index.php?pk=114772&T=2

As an alternative you can also use a QR Code:  

The GUIDs for individual cells are displayed in the table below:

Univariate ARIMA Extrapolation Forecast Performance
time% S.E.PEMAPESq.EMSERMSE
500.08020.05110483800.867500
510.08680.1230.08712805320.8931644560.88031282.4043
520.11040.08320.08581225994.69551505038.81871226.8002
530.16110.1560.10333458101.98611993304.61051411.8444
540.17230.25680.13410273860.69253649415.82691910.3444
550.23430.35840.171415110123.01375559533.69142357.8663
560.43350.86340.270333661712.88799574130.71953094.2092
570.30010.5050.299629508110.653412065878.21123473.5973
580.40360.79170.354350351204.935116319803.40274039.7776
590.81152.27190.546123536945.160927041517.57865200.1459
601.32513.85260.8466157472167.265438898849.36836236.8942
612.30056.44371.3131172222764.729650009175.64847071.7166


Parameters (Session):
par1 = 12 ; par2 = 1 ; par3 = 1 ; par4 = 1 ; par5 = 12 ; par6 = 3 ; par7 = 1 ; par8 = 2 ; par9 = 0 ; par10 = FALSE ;
Parameters (R input):
par1 = 12 ; par2 = 1 ; par3 = 1 ; par4 = 1 ; par5 = 12 ; par6 = 3 ; par7 = 1 ; par8 = 2 ; par9 = 0 ; par10 = FALSE ;
R code (references can be found in the software module):
par1 <- as.numeric(par1) #cut off periods
par2 <- as.numeric(par2) #lambda
par3 <- as.numeric(par3) #degree of non-seasonal differencing
par4 <- as.numeric(par4) #degree of seasonal differencing
par5 <- as.numeric(par5) #seasonal period
par6 <- as.numeric(par6) #p
par7 <- as.numeric(par7) #q
par8 <- as.numeric(par8) #P
par9 <- as.numeric(par9) #Q
if (par10 == 'TRUE') par10 <- TRUE
if (par10 == 'FALSE') par10 <- FALSE
if (par2 == 0) x <- log(x)
if (par2 != 0) x <- x^par2
lx <- length(x)
first <- lx - 2*par1
nx <- lx - par1
nx1 <- nx + 1
fx <- lx - nx
if (fx < 1) {
fx <- par5
nx1 <- lx + fx - 1
first <- lx - 2*fx
}
first <- 1
if (fx < 3) fx <- round(lx/10,0)
(arima.out <- arima(x[1:nx], order=c(par6,par3,par7), seasonal=list(order=c(par8,par4,par9), period=par5), include.mean=par10, method='ML'))
(forecast <- predict(arima.out,par1))
(lb <- forecast$pred - 1.96 * forecast$se)
(ub <- forecast$pred + 1.96 * forecast$se)
if (par2 == 0) {
x <- exp(x)
forecast$pred <- exp(forecast$pred)
lb <- exp(lb)
ub <- exp(ub)
}
if (par2 != 0) {
x <- x^(1/par2)
forecast$pred <- forecast$pred^(1/par2)
lb <- lb^(1/par2)
ub <- ub^(1/par2)
}
if (par2 < 0) {
olb <- lb
lb <- ub
ub <- olb
}
(actandfor <- c(x[1:nx], forecast$pred))
(perc.se <- (ub-forecast$pred)/1.96/forecast$pred)
bitmap(file='test1.png')
opar <- par(mar=c(4,4,2,2),las=1)
ylim <- c( min(x[first:nx],lb), max(x[first:nx],ub))
plot(x,ylim=ylim,type='n',xlim=c(first,lx))
usr <- par('usr')
rect(usr[1],usr[3],nx+1,usr[4],border=NA,col='lemonchiffon')
rect(nx1,usr[3],usr[2],usr[4],border=NA,col='lavender')
abline(h= (-3:3)*2 , col ='gray', lty =3)
polygon( c(nx1:lx,lx:nx1), c(lb,rev(ub)), col = 'orange', lty=2,border=NA)
lines(nx1:lx, lb , lty=2)
lines(nx1:lx, ub , lty=2)
lines(x, lwd=2)
lines(nx1:lx, forecast$pred , lwd=2 , col ='white')
box()
par(opar)
dev.off()
prob.dec <- array(NA, dim=fx)
prob.sdec <- array(NA, dim=fx)
prob.ldec <- array(NA, dim=fx)
prob.pval <- array(NA, dim=fx)
perf.pe <- array(0, dim=fx)
perf.mape <- array(0, dim=fx)
perf.mape1 <- array(0, dim=fx)
perf.se <- array(0, dim=fx)
perf.mse <- array(0, dim=fx)
perf.mse1 <- array(0, dim=fx)
perf.rmse <- array(0, dim=fx)
for (i in 1:fx) {
locSD <- (ub[i] - forecast$pred[i]) / 1.96
perf.pe[i] = (x[nx+i] - forecast$pred[i]) / forecast$pred[i]
perf.se[i] = (x[nx+i] - forecast$pred[i])^2
prob.dec[i] = pnorm((x[nx+i-1] - forecast$pred[i]) / locSD)
prob.sdec[i] = pnorm((x[nx+i-par5] - forecast$pred[i]) / locSD)
prob.ldec[i] = pnorm((x[nx] - forecast$pred[i]) / locSD)
prob.pval[i] = pnorm(abs(x[nx+i] - forecast$pred[i]) / locSD)
}
perf.mape[1] = abs(perf.pe[1])
perf.mse[1] = abs(perf.se[1])
for (i in 2:fx) {
perf.mape[i] = perf.mape[i-1] + abs(perf.pe[i])
perf.mape1[i] = perf.mape[i] / i
perf.mse[i] = perf.mse[i-1] + perf.se[i]
perf.mse1[i] = perf.mse[i] / i
}
perf.rmse = sqrt(perf.mse1)
bitmap(file='test2.png')
plot(forecast$pred, pch=19, type='b',main='ARIMA Extrapolation Forecast', ylab='Forecast and 95% CI', xlab='time',ylim=c(min(lb),max(ub)))
dum <- forecast$pred
dum[1:par1] <- x[(nx+1):lx]
lines(dum, lty=1)
lines(ub,lty=3)
lines(lb,lty=3)
dev.off()
load(file='createtable')
a<-table.start()
a<-table.row.start(a)
a<-table.element(a,'Univariate ARIMA Extrapolation Forecast',9,TRUE)
a<-table.row.end(a)
a<-table.row.start(a)
a<-table.element(a,'time',1,header=TRUE)
a<-table.element(a,'Y[t]',1,header=TRUE)
a<-table.element(a,'F[t]',1,header=TRUE)
a<-table.element(a,'95% LB',1,header=TRUE)
a<-table.element(a,'95% UB',1,header=TRUE)
a<-table.element(a,'p-value
(H0: Y[t] = F[t])',1,header=TRUE)
a<-table.element(a,'P(F[t]>Y[t-1])',1,header=TRUE)
a<-table.element(a,'P(F[t]>Y[t-s])',1,header=TRUE)
mylab <- paste('P(F[t]>Y[',nx,sep='')
mylab <- paste(mylab,'])',sep='')
a<-table.element(a,mylab,1,header=TRUE)
a<-table.row.end(a)
for (i in (nx-par5):nx) {
a<-table.row.start(a)
a<-table.element(a,i,header=TRUE)
a<-table.element(a,x[i])
a<-table.element(a,'-')
a<-table.row.end(a)
}
for (i in 1:fx) {
a<-table.row.start(a)
a<-table.element(a,nx+i,header=TRUE)
a<-table.element(a,round(x[nx+i],4))
a<-table.element(a,round(forecast$pred[i],4))
a<-table.element(a,round(lb[i],4))
a<-table.element(a,round(ub[i],4))
a<-table.element(a,round((1-prob.pval[i]),4))
a<-table.element(a,round((1-prob.dec[i]),4))
a<-table.element(a,round((1-prob.sdec[i]),4))
a<-table.element(a,round((1-prob.ldec[i]),4))
a<-table.row.end(a)
}
a<-table.end(a)
table.save(a,file='mytable.tab')
a<-table.start()
a<-table.row.start(a)
a<-table.element(a,'Univariate ARIMA Extrapolation Forecast Performance',7,TRUE)
a<-table.row.end(a)
a<-table.row.start(a)
a<-table.element(a,'time',1,header=TRUE)
a<-table.element(a,'% S.E.',1,header=TRUE)
a<-table.element(a,'PE',1,header=TRUE)
a<-table.element(a,'MAPE',1,header=TRUE)
a<-table.element(a,'Sq.E',1,header=TRUE)
a<-table.element(a,'MSE',1,header=TRUE)
a<-table.element(a,'RMSE',1,header=TRUE)
a<-table.row.end(a)
for (i in 1:fx) {
a<-table.row.start(a)
a<-table.element(a,nx+i,header=TRUE)
a<-table.element(a,round(perc.se[i],4))
a<-table.element(a,round(perf.pe[i],4))
a<-table.element(a,round(perf.mape1[i],4))
a<-table.element(a,round(perf.se[i],4))
a<-table.element(a,round(perf.mse1[i],4))
a<-table.element(a,round(perf.rmse[i],4))
a<-table.row.end(a)
}
a<-table.end(a)
table.save(a,file='mytable1.tab')