Free Statistics

of Irreproducible Research!

Author's title

Author*The author of this computation has been verified*
R Software Modulerwasp_smp.wasp
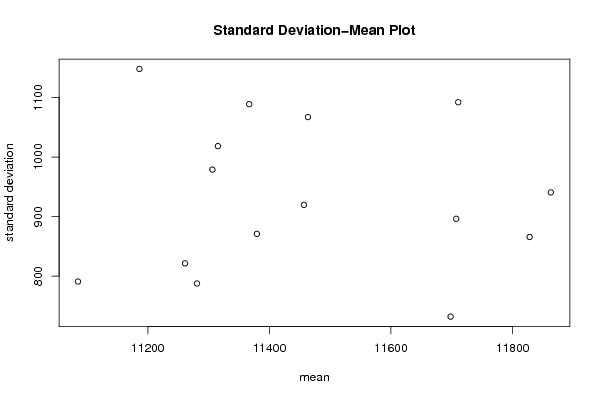
Title produced by softwareStandard Deviation-Mean Plot
Date of computationFri, 24 Dec 2010 11:03:32 +0000
Cite this page as followsStatistical Computations at FreeStatistics.org, Office for Research Development and Education, URL https://freestatistics.org/blog/index.php?v=date/2010/Dec/24/t1293188505tbmzwyrxxzneu5x.htm/, Retrieved Tue, 30 Apr 2024 06:39:03 +0000
Statistical Computations at FreeStatistics.org, Office for Research Development and Education, URL https://freestatistics.org/blog/index.php?pk=114757, Retrieved Tue, 30 Apr 2024 06:39:03 +0000
QR Codes:

Original text written by user:
IsPrivate?No (this computation is public)
User-defined keywords
Estimated Impact102
Family? (F = Feedback message, R = changed R code, M = changed R Module, P = changed Parameters, D = changed Data)
-       [Standard Deviation-Mean Plot] [] [2010-12-24 11:03:32] [3bdb54d050744f47368418ea7c7e8e96] [Current]
Feedback Forum

Post a new message
Dataseries X:
11974
10106
12069
11412
11180
10508
11288
10928
10199
11030
11234
13747
13912
12376
12264
11675
11271
10672
10933
10379
10187
10747
10970
12175
14200
11676
11258
10872
11148
10690
10684
11658
10178
10981
10773
11665
11359
10716
12928
12317
11641
10459
10953
10703
10703
11101
11334
13268
13145
12334
13153
11289
11374
10914
11299
11284
10694
11077
11104
12820
14915
11773
11608
11468
11511
11200
11164
10960
10667
11556
11372
12333
13102
11115
12572
11557
12059
11420
11185
11113
10706
11523
11391
12634
13469
11735
13281
11968
11623
11084
11509
11134
10438
11530
11491
13093
13106
11305
13113
12203
11309
11088
11234
11619
10942
11445
11291
13281
13726
11300
11983
11092
11093
10692
10786
11166
10553
11103
10969
12090
12544
12264
13783
11214
11453
10883
10381
10348
10024
10805
10796
11907
12261
11377
12689
11474
10992
10764
12164
10409
10398
10349
10865
11630
12221
10884
12019
11021
10799
10423
10484
10450
9906
11049
11281
12485
12849
11380
12079
11366
11328
10444
10854
10434
10137
10992
10906
12367
14371
11695
11546
10922
10670
10254
10573
10239
10253
11176
10719
11817


Summary of computational transaction
Raw Inputview raw input (R code)
Raw Outputview raw output of R engine
Computing time2 seconds
R Server'Sir Ronald Aylmer Fisher' @ 193.190.124.24

\begin{tabular}{lllllllll}
\hline
Summary of computational transaction \tabularnewline
Raw Input & view raw input (R code)  \tabularnewline
Raw Output & view raw output of R engine  \tabularnewline
Computing time & 2 seconds \tabularnewline
R Server & 'Sir Ronald Aylmer Fisher' @ 193.190.124.24 \tabularnewline
\hline
\end{tabular}
%Source: https://freestatistics.org/blog/index.php?pk=114757&T=0

[TABLE]
[ROW][C]Summary of computational transaction[/C][/ROW]
[ROW][C]Raw Input[/C][C]view raw input (R code) [/C][/ROW]
[ROW][C]Raw Output[/C][C]view raw output of R engine [/C][/ROW]
[ROW][C]Computing time[/C][C]2 seconds[/C][/ROW]
[ROW][C]R Server[/C][C]'Sir Ronald Aylmer Fisher' @ 193.190.124.24[/C][/ROW]
[/TABLE]
Source: https://freestatistics.org/blog/index.php?pk=114757&T=0

Globally Unique Identifier (entire table): ba.freestatistics.org/blog/index.php?pk=114757&T=0

As an alternative you can also use a QR Code:  

The GUIDs for individual cells are displayed in the table below:

Summary of computational transaction
Raw Inputview raw input (R code)
Raw Outputview raw output of R engine
Computing time2 seconds
R Server'Sir Ronald Aylmer Fisher' @ 193.190.124.24


Standard Deviation-Mean Plot
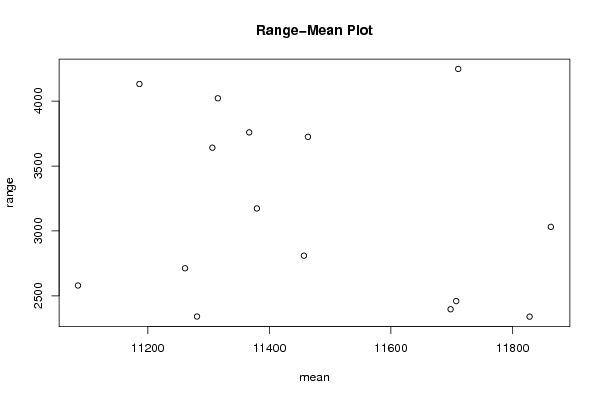
SectionMeanStandard DeviationRange
111306.25978.9050585405943641
211463.41666666671067.155902245303725
311315.251018.374651991194022
411456.8333333333919.714366067812809
511707.25896.3151966904172459
611710.58333333331092.087780215944248
711698.0833333333731.9274005644072396
811862.9166666667940.5687310764633031
911828865.6791343427212339
1011379.4166666667870.9811038899373173
1111366.83333333331088.775194538533759
1211281787.5959970349362340
1311085.1666666667790.9469391849622579
1411261.3333333333821.4514131964372712
1511186.251147.998188547834132

\begin{tabular}{lllllllll}
\hline
Standard Deviation-Mean Plot \tabularnewline
Section & Mean & Standard Deviation & Range \tabularnewline
1 & 11306.25 & 978.905058540594 & 3641 \tabularnewline
2 & 11463.4166666667 & 1067.15590224530 & 3725 \tabularnewline
3 & 11315.25 & 1018.37465199119 & 4022 \tabularnewline
4 & 11456.8333333333 & 919.71436606781 & 2809 \tabularnewline
5 & 11707.25 & 896.315196690417 & 2459 \tabularnewline
6 & 11710.5833333333 & 1092.08778021594 & 4248 \tabularnewline
7 & 11698.0833333333 & 731.927400564407 & 2396 \tabularnewline
8 & 11862.9166666667 & 940.568731076463 & 3031 \tabularnewline
9 & 11828 & 865.679134342721 & 2339 \tabularnewline
10 & 11379.4166666667 & 870.981103889937 & 3173 \tabularnewline
11 & 11366.8333333333 & 1088.77519453853 & 3759 \tabularnewline
12 & 11281 & 787.595997034936 & 2340 \tabularnewline
13 & 11085.1666666667 & 790.946939184962 & 2579 \tabularnewline
14 & 11261.3333333333 & 821.451413196437 & 2712 \tabularnewline
15 & 11186.25 & 1147.99818854783 & 4132 \tabularnewline
\hline
\end{tabular}
%Source: https://freestatistics.org/blog/index.php?pk=114757&T=1

[TABLE]
[ROW][C]Standard Deviation-Mean Plot[/C][/ROW]
[ROW][C]Section[/C][C]Mean[/C][C]Standard Deviation[/C][C]Range[/C][/ROW]
[ROW][C]1[/C][C]11306.25[/C][C]978.905058540594[/C][C]3641[/C][/ROW]
[ROW][C]2[/C][C]11463.4166666667[/C][C]1067.15590224530[/C][C]3725[/C][/ROW]
[ROW][C]3[/C][C]11315.25[/C][C]1018.37465199119[/C][C]4022[/C][/ROW]
[ROW][C]4[/C][C]11456.8333333333[/C][C]919.71436606781[/C][C]2809[/C][/ROW]
[ROW][C]5[/C][C]11707.25[/C][C]896.315196690417[/C][C]2459[/C][/ROW]
[ROW][C]6[/C][C]11710.5833333333[/C][C]1092.08778021594[/C][C]4248[/C][/ROW]
[ROW][C]7[/C][C]11698.0833333333[/C][C]731.927400564407[/C][C]2396[/C][/ROW]
[ROW][C]8[/C][C]11862.9166666667[/C][C]940.568731076463[/C][C]3031[/C][/ROW]
[ROW][C]9[/C][C]11828[/C][C]865.679134342721[/C][C]2339[/C][/ROW]
[ROW][C]10[/C][C]11379.4166666667[/C][C]870.981103889937[/C][C]3173[/C][/ROW]
[ROW][C]11[/C][C]11366.8333333333[/C][C]1088.77519453853[/C][C]3759[/C][/ROW]
[ROW][C]12[/C][C]11281[/C][C]787.595997034936[/C][C]2340[/C][/ROW]
[ROW][C]13[/C][C]11085.1666666667[/C][C]790.946939184962[/C][C]2579[/C][/ROW]
[ROW][C]14[/C][C]11261.3333333333[/C][C]821.451413196437[/C][C]2712[/C][/ROW]
[ROW][C]15[/C][C]11186.25[/C][C]1147.99818854783[/C][C]4132[/C][/ROW]
[/TABLE]
Source: https://freestatistics.org/blog/index.php?pk=114757&T=1

Globally Unique Identifier (entire table): ba.freestatistics.org/blog/index.php?pk=114757&T=1

As an alternative you can also use a QR Code:  

The GUIDs for individual cells are displayed in the table below:

Standard Deviation-Mean Plot
SectionMeanStandard DeviationRange
111306.25978.9050585405943641
211463.41666666671067.155902245303725
311315.251018.374651991194022
411456.8333333333919.714366067812809
511707.25896.3151966904172459
611710.58333333331092.087780215944248
711698.0833333333731.9274005644072396
811862.9166666667940.5687310764633031
911828865.6791343427212339
1011379.4166666667870.9811038899373173
1111366.83333333331088.775194538533759
1211281787.5959970349362340
1311085.1666666667790.9469391849622579
1411261.3333333333821.4514131964372712
1511186.251147.998188547834132


Regression: S.E.(k) = alpha + beta * Mean(k)
alpha1277.19404038628
beta-0.0298963172635848
S.D.0.145337057236038
T-STAT-0.205703334250334
p-value0.840208905821725

\begin{tabular}{lllllllll}
\hline
Regression: S.E.(k) = alpha + beta * Mean(k) \tabularnewline
alpha & 1277.19404038628 \tabularnewline
beta & -0.0298963172635848 \tabularnewline
S.D. & 0.145337057236038 \tabularnewline
T-STAT & -0.205703334250334 \tabularnewline
p-value & 0.840208905821725 \tabularnewline
\hline
\end{tabular}
%Source: https://freestatistics.org/blog/index.php?pk=114757&T=2

[TABLE]
[ROW][C]Regression: S.E.(k) = alpha + beta * Mean(k)[/C][/ROW]
[ROW][C]alpha[/C][C]1277.19404038628[/C][/ROW]
[ROW][C]beta[/C][C]-0.0298963172635848[/C][/ROW]
[ROW][C]S.D.[/C][C]0.145337057236038[/C][/ROW]
[ROW][C]T-STAT[/C][C]-0.205703334250334[/C][/ROW]
[ROW][C]p-value[/C][C]0.840208905821725[/C][/ROW]
[/TABLE]
Source: https://freestatistics.org/blog/index.php?pk=114757&T=2

Globally Unique Identifier (entire table): ba.freestatistics.org/blog/index.php?pk=114757&T=2

As an alternative you can also use a QR Code:  

The GUIDs for individual cells are displayed in the table below:

Regression: S.E.(k) = alpha + beta * Mean(k)
alpha1277.19404038628
beta-0.0298963172635848
S.D.0.145337057236038
T-STAT-0.205703334250334
p-value0.840208905821725


Regression: ln S.E.(k) = alpha + beta * ln Mean(k)
alpha9.32521585709698
beta-0.266822697846112
S.D.1.79594808555766
T-STAT-0.148569271011673
p-value0.88417336779935
Lambda1.26682269784611

\begin{tabular}{lllllllll}
\hline
Regression: ln S.E.(k) = alpha + beta * ln Mean(k) \tabularnewline
alpha & 9.32521585709698 \tabularnewline
beta & -0.266822697846112 \tabularnewline
S.D. & 1.79594808555766 \tabularnewline
T-STAT & -0.148569271011673 \tabularnewline
p-value & 0.88417336779935 \tabularnewline
Lambda & 1.26682269784611 \tabularnewline
\hline
\end{tabular}
%Source: https://freestatistics.org/blog/index.php?pk=114757&T=3

[TABLE]
[ROW][C]Regression: ln S.E.(k) = alpha + beta * ln Mean(k)[/C][/ROW]
[ROW][C]alpha[/C][C]9.32521585709698[/C][/ROW]
[ROW][C]beta[/C][C]-0.266822697846112[/C][/ROW]
[ROW][C]S.D.[/C][C]1.79594808555766[/C][/ROW]
[ROW][C]T-STAT[/C][C]-0.148569271011673[/C][/ROW]
[ROW][C]p-value[/C][C]0.88417336779935[/C][/ROW]
[ROW][C]Lambda[/C][C]1.26682269784611[/C][/ROW]
[/TABLE]
Source: https://freestatistics.org/blog/index.php?pk=114757&T=3

Globally Unique Identifier (entire table): ba.freestatistics.org/blog/index.php?pk=114757&T=3

As an alternative you can also use a QR Code:  

The GUIDs for individual cells are displayed in the table below:

Regression: ln S.E.(k) = alpha + beta * ln Mean(k)
alpha9.32521585709698
beta-0.266822697846112
S.D.1.79594808555766
T-STAT-0.148569271011673
p-value0.88417336779935
Lambda1.26682269784611


Parameters (Session):
par1 = 12 ;
Parameters (R input):
par1 = 12 ;
R code (references can be found in the software module):
par1 <- as.numeric(par1)
(n <- length(x))
(np <- floor(n / par1))
arr <- array(NA,dim=c(par1,np))
j <- 0
k <- 1
for (i in 1:(np*par1))
{
j = j + 1
arr[j,k] <- x[i]
if (j == par1) {
j = 0
k=k+1
}
}
arr
arr.mean <- array(NA,dim=np)
arr.sd <- array(NA,dim=np)
arr.range <- array(NA,dim=np)
for (j in 1:np)
{
arr.mean[j] <- mean(arr[,j],na.rm=TRUE)
arr.sd[j] <- sd(arr[,j],na.rm=TRUE)
arr.range[j] <- max(arr[,j],na.rm=TRUE) - min(arr[,j],na.rm=TRUE)
}
arr.mean
arr.sd
arr.range
(lm1 <- lm(arr.sd~arr.mean))
(lnlm1 <- lm(log(arr.sd)~log(arr.mean)))
(lm2 <- lm(arr.range~arr.mean))
bitmap(file='test1.png')
plot(arr.mean,arr.sd,main='Standard Deviation-Mean Plot',xlab='mean',ylab='standard deviation')
dev.off()
bitmap(file='test2.png')
plot(arr.mean,arr.range,main='Range-Mean Plot',xlab='mean',ylab='range')
dev.off()
load(file='createtable')
a<-table.start()
a<-table.row.start(a)
a<-table.element(a,'Standard Deviation-Mean Plot',4,TRUE)
a<-table.row.end(a)
a<-table.row.start(a)
a<-table.element(a,'Section',header=TRUE)
a<-table.element(a,'Mean',header=TRUE)
a<-table.element(a,'Standard Deviation',header=TRUE)
a<-table.element(a,'Range',header=TRUE)
a<-table.row.end(a)
for (j in 1:np) {
a<-table.row.start(a)
a<-table.element(a,j,header=TRUE)
a<-table.element(a,arr.mean[j])
a<-table.element(a,arr.sd[j] )
a<-table.element(a,arr.range[j] )
a<-table.row.end(a)
}
a<-table.end(a)
table.save(a,file='mytable.tab')
a<-table.start()
a<-table.row.start(a)
a<-table.element(a,'Regression: S.E.(k) = alpha + beta * Mean(k)',2,TRUE)
a<-table.row.end(a)
a<-table.row.start(a)
a<-table.element(a,'alpha',header=TRUE)
a<-table.element(a,lm1$coefficients[[1]])
a<-table.row.end(a)
a<-table.row.start(a)
a<-table.element(a,'beta',header=TRUE)
a<-table.element(a,lm1$coefficients[[2]])
a<-table.row.end(a)
a<-table.row.start(a)
a<-table.element(a,'S.D.',header=TRUE)
a<-table.element(a,summary(lm1)$coefficients[2,2])
a<-table.row.end(a)
a<-table.row.start(a)
a<-table.element(a,'T-STAT',header=TRUE)
a<-table.element(a,summary(lm1)$coefficients[2,3])
a<-table.row.end(a)
a<-table.row.start(a)
a<-table.element(a,'p-value',header=TRUE)
a<-table.element(a,summary(lm1)$coefficients[2,4])
a<-table.row.end(a)
a<-table.end(a)
table.save(a,file='mytable1.tab')
a<-table.start()
a<-table.row.start(a)
a<-table.element(a,'Regression: ln S.E.(k) = alpha + beta * ln Mean(k)',2,TRUE)
a<-table.row.end(a)
a<-table.row.start(a)
a<-table.element(a,'alpha',header=TRUE)
a<-table.element(a,lnlm1$coefficients[[1]])
a<-table.row.end(a)
a<-table.row.start(a)
a<-table.element(a,'beta',header=TRUE)
a<-table.element(a,lnlm1$coefficients[[2]])
a<-table.row.end(a)
a<-table.row.start(a)
a<-table.element(a,'S.D.',header=TRUE)
a<-table.element(a,summary(lnlm1)$coefficients[2,2])
a<-table.row.end(a)
a<-table.row.start(a)
a<-table.element(a,'T-STAT',header=TRUE)
a<-table.element(a,summary(lnlm1)$coefficients[2,3])
a<-table.row.end(a)
a<-table.row.start(a)
a<-table.element(a,'p-value',header=TRUE)
a<-table.element(a,summary(lnlm1)$coefficients[2,4])
a<-table.row.end(a)
a<-table.row.start(a)
a<-table.element(a,'Lambda',header=TRUE)
a<-table.element(a,1-lnlm1$coefficients[[2]])
a<-table.row.end(a)
a<-table.end(a)
table.save(a,file='mytable2.tab')