Free Statistics

of Irreproducible Research!

Author's title

Author*The author of this computation has been verified*
R Software Modulerwasp_arimaforecasting.wasp
Title produced by softwareARIMA Forecasting
Date of computationFri, 24 Dec 2010 11:01:51 +0000
Cite this page as followsStatistical Computations at FreeStatistics.org, Office for Research Development and Education, URL https://freestatistics.org/blog/index.php?v=date/2010/Dec/24/t1293188421mtvfw5juaont848.htm/, Retrieved Tue, 30 Apr 2024 02:32:39 +0000
Statistical Computations at FreeStatistics.org, Office for Research Development and Education, URL https://freestatistics.org/blog/index.php?pk=114753, Retrieved Tue, 30 Apr 2024 02:32:39 +0000
QR Codes:

Original text written by user:
IsPrivate?No (this computation is public)
User-defined keywords
Estimated Impact139
Family? (F = Feedback message, R = changed R code, M = changed R Module, P = changed Parameters, D = changed Data)
-       [ARIMA Forecasting] [Forecast] [2010-12-24 11:01:51] [c2514e24605d0513c6bae17788e1fef3] [Current]
- R       [ARIMA Forecasting] [Arima forecast] [2010-12-29 15:20:40] [e73e9643c012a54583c6a406017b2645]
Feedback Forum

Post a new message
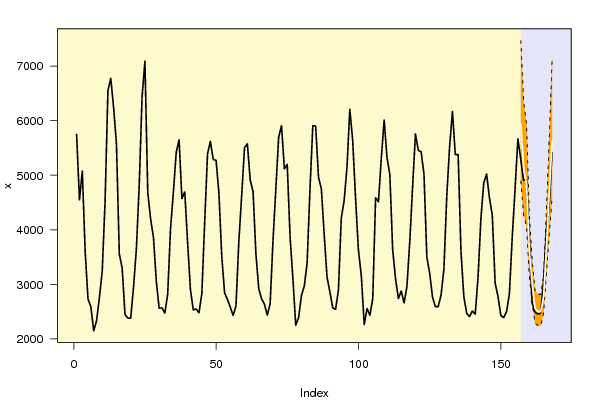
Dataseries X:
5745
4549
5074
3602
2732
2589
2148
2330
2752
3241
4517
6550
6778
6240
5570
3558
3299
2447
2380
2378
2947
3651
4816
6436
7090
4682
4198
3860
3056
2563
2568
2472
2821
4015
4686
5418
5649
4572
4695
3766
2900
2528
2549
2478
2828
4139
5390
5621
5291
5272
4677
3520
2842
2723
2581
2429
2606
3787
4630
5505
5577
4911
4701
3557
2921
2734
2636
2433
2640
3794
4745
5698
5909
5119
5200
3876
3104
2251
2386
2794
2967
3392
4741
5909
5901
4962
4751
3909
3130
2860
2568
2540
2894
4216
4530
5144
6206
5645
4601
3645
3140
2264
2557
2431
2747
4587
4512
5313
6011
5328
5014
3630
3102
2739
2877
2659
2957
3785
4785
5757
5458
5427
5018
3498
3204
2763
2589
2591
2805
3278
4615
5524
6167
5380
5377
3603
2774
2470
2407
2512
2451
3134
4210
4859
5022
4584
4267
3022
2777
2428
2389
2496
2820
3854
4748
5666
5293
4905
4920
3854
2659
2491
2455
2472
3030
3987
4453
5417


Summary of computational transaction
Raw Inputview raw input (R code)
Raw Outputview raw output of R engine
Computing time4 seconds
R Server'Gwilym Jenkins' @ 72.249.127.135

\begin{tabular}{lllllllll}
\hline
Summary of computational transaction \tabularnewline
Raw Input & view raw input (R code)  \tabularnewline
Raw Output & view raw output of R engine  \tabularnewline
Computing time & 4 seconds \tabularnewline
R Server & 'Gwilym Jenkins' @ 72.249.127.135 \tabularnewline
\hline
\end{tabular}
%Source: https://freestatistics.org/blog/index.php?pk=114753&T=0

[TABLE]
[ROW][C]Summary of computational transaction[/C][/ROW]
[ROW][C]Raw Input[/C][C]view raw input (R code) [/C][/ROW]
[ROW][C]Raw Output[/C][C]view raw output of R engine [/C][/ROW]
[ROW][C]Computing time[/C][C]4 seconds[/C][/ROW]
[ROW][C]R Server[/C][C]'Gwilym Jenkins' @ 72.249.127.135[/C][/ROW]
[/TABLE]
Source: https://freestatistics.org/blog/index.php?pk=114753&T=0

Globally Unique Identifier (entire table): ba.freestatistics.org/blog/index.php?pk=114753&T=0

As an alternative you can also use a QR Code:  

The GUIDs for individual cells are displayed in the table below:

Summary of computational transaction
Raw Inputview raw input (R code)
Raw Outputview raw output of R engine
Computing time4 seconds
R Server'Gwilym Jenkins' @ 72.249.127.135


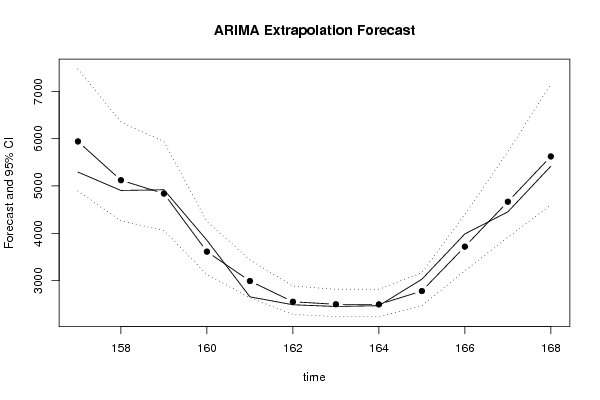
Univariate ARIMA Extrapolation Forecast
timeY[t]F[t]95% LB95% UBp-value(H0: Y[t] = F[t])P(F[t]>Y[t-1])P(F[t]>Y[t-s])P(F[t]>Y[156])
1444859-------
1455022-------
1464584-------
1474267-------
1483022-------
1492777-------
1502428-------
1512389-------
1522496-------
1532820-------
1543854-------
1554748-------
1565666-------
15752935940.32624894.35057471.22580.20360.63730.88010.6373
15849055121.2164263.75566348.30040.36490.39190.80460.1921
15949204839.52334059.76025937.60230.44290.45350.84660.0701
16038543613.27873129.67254250.30650.229500.96560
16126592992.28452640.22553438.90760.07181e-040.82760
16224912554.89862286.58162885.7470.35250.26870.77390
16324552500.91352242.0982818.96510.38860.52440.75480
16424722498.68032240.16322816.34620.43460.60620.50660
16530302781.00492470.16143170.11920.10490.94020.42210
16639873718.61393207.79914397.14790.21910.97670.34790
16744534667.273916.99895722.8230.34540.89670.44040.0318
16854175623.45324598.49287148.38930.39540.93380.47820.4782

\begin{tabular}{lllllllll}
\hline
Univariate ARIMA Extrapolation Forecast \tabularnewline
time & Y[t] & F[t] & 95% LB & 95% UB & p-value(H0: Y[t] = F[t]) & P(F[t]>Y[t-1]) & P(F[t]>Y[t-s]) & P(F[t]>Y[156]) \tabularnewline
144 & 4859 & - & - & - & - & - & - & - \tabularnewline
145 & 5022 & - & - & - & - & - & - & - \tabularnewline
146 & 4584 & - & - & - & - & - & - & - \tabularnewline
147 & 4267 & - & - & - & - & - & - & - \tabularnewline
148 & 3022 & - & - & - & - & - & - & - \tabularnewline
149 & 2777 & - & - & - & - & - & - & - \tabularnewline
150 & 2428 & - & - & - & - & - & - & - \tabularnewline
151 & 2389 & - & - & - & - & - & - & - \tabularnewline
152 & 2496 & - & - & - & - & - & - & - \tabularnewline
153 & 2820 & - & - & - & - & - & - & - \tabularnewline
154 & 3854 & - & - & - & - & - & - & - \tabularnewline
155 & 4748 & - & - & - & - & - & - & - \tabularnewline
156 & 5666 & - & - & - & - & - & - & - \tabularnewline
157 & 5293 & 5940.3262 & 4894.3505 & 7471.2258 & 0.2036 & 0.6373 & 0.8801 & 0.6373 \tabularnewline
158 & 4905 & 5121.216 & 4263.7556 & 6348.3004 & 0.3649 & 0.3919 & 0.8046 & 0.1921 \tabularnewline
159 & 4920 & 4839.5233 & 4059.7602 & 5937.6023 & 0.4429 & 0.4535 & 0.8466 & 0.0701 \tabularnewline
160 & 3854 & 3613.2787 & 3129.6725 & 4250.3065 & 0.2295 & 0 & 0.9656 & 0 \tabularnewline
161 & 2659 & 2992.2845 & 2640.2255 & 3438.9076 & 0.0718 & 1e-04 & 0.8276 & 0 \tabularnewline
162 & 2491 & 2554.8986 & 2286.5816 & 2885.747 & 0.3525 & 0.2687 & 0.7739 & 0 \tabularnewline
163 & 2455 & 2500.9135 & 2242.098 & 2818.9651 & 0.3886 & 0.5244 & 0.7548 & 0 \tabularnewline
164 & 2472 & 2498.6803 & 2240.1632 & 2816.3462 & 0.4346 & 0.6062 & 0.5066 & 0 \tabularnewline
165 & 3030 & 2781.0049 & 2470.1614 & 3170.1192 & 0.1049 & 0.9402 & 0.4221 & 0 \tabularnewline
166 & 3987 & 3718.6139 & 3207.7991 & 4397.1479 & 0.2191 & 0.9767 & 0.3479 & 0 \tabularnewline
167 & 4453 & 4667.27 & 3916.9989 & 5722.823 & 0.3454 & 0.8967 & 0.4404 & 0.0318 \tabularnewline
168 & 5417 & 5623.4532 & 4598.4928 & 7148.3893 & 0.3954 & 0.9338 & 0.4782 & 0.4782 \tabularnewline
\hline
\end{tabular}
%Source: https://freestatistics.org/blog/index.php?pk=114753&T=1

[TABLE]
[ROW][C]Univariate ARIMA Extrapolation Forecast[/C][/ROW]
[ROW][C]time[/C][C]Y[t][/C][C]F[t][/C][C]95% LB[/C][C]95% UB[/C][C]p-value(H0: Y[t] = F[t])[/C][C]P(F[t]>Y[t-1])[/C][C]P(F[t]>Y[t-s])[/C][C]P(F[t]>Y[156])[/C][/ROW]
[ROW][C]144[/C][C]4859[/C][C]-[/C][C]-[/C][C]-[/C][C]-[/C][C]-[/C][C]-[/C][C]-[/C][/ROW]
[ROW][C]145[/C][C]5022[/C][C]-[/C][C]-[/C][C]-[/C][C]-[/C][C]-[/C][C]-[/C][C]-[/C][/ROW]
[ROW][C]146[/C][C]4584[/C][C]-[/C][C]-[/C][C]-[/C][C]-[/C][C]-[/C][C]-[/C][C]-[/C][/ROW]
[ROW][C]147[/C][C]4267[/C][C]-[/C][C]-[/C][C]-[/C][C]-[/C][C]-[/C][C]-[/C][C]-[/C][/ROW]
[ROW][C]148[/C][C]3022[/C][C]-[/C][C]-[/C][C]-[/C][C]-[/C][C]-[/C][C]-[/C][C]-[/C][/ROW]
[ROW][C]149[/C][C]2777[/C][C]-[/C][C]-[/C][C]-[/C][C]-[/C][C]-[/C][C]-[/C][C]-[/C][/ROW]
[ROW][C]150[/C][C]2428[/C][C]-[/C][C]-[/C][C]-[/C][C]-[/C][C]-[/C][C]-[/C][C]-[/C][/ROW]
[ROW][C]151[/C][C]2389[/C][C]-[/C][C]-[/C][C]-[/C][C]-[/C][C]-[/C][C]-[/C][C]-[/C][/ROW]
[ROW][C]152[/C][C]2496[/C][C]-[/C][C]-[/C][C]-[/C][C]-[/C][C]-[/C][C]-[/C][C]-[/C][/ROW]
[ROW][C]153[/C][C]2820[/C][C]-[/C][C]-[/C][C]-[/C][C]-[/C][C]-[/C][C]-[/C][C]-[/C][/ROW]
[ROW][C]154[/C][C]3854[/C][C]-[/C][C]-[/C][C]-[/C][C]-[/C][C]-[/C][C]-[/C][C]-[/C][/ROW]
[ROW][C]155[/C][C]4748[/C][C]-[/C][C]-[/C][C]-[/C][C]-[/C][C]-[/C][C]-[/C][C]-[/C][/ROW]
[ROW][C]156[/C][C]5666[/C][C]-[/C][C]-[/C][C]-[/C][C]-[/C][C]-[/C][C]-[/C][C]-[/C][/ROW]
[ROW][C]157[/C][C]5293[/C][C]5940.3262[/C][C]4894.3505[/C][C]7471.2258[/C][C]0.2036[/C][C]0.6373[/C][C]0.8801[/C][C]0.6373[/C][/ROW]
[ROW][C]158[/C][C]4905[/C][C]5121.216[/C][C]4263.7556[/C][C]6348.3004[/C][C]0.3649[/C][C]0.3919[/C][C]0.8046[/C][C]0.1921[/C][/ROW]
[ROW][C]159[/C][C]4920[/C][C]4839.5233[/C][C]4059.7602[/C][C]5937.6023[/C][C]0.4429[/C][C]0.4535[/C][C]0.8466[/C][C]0.0701[/C][/ROW]
[ROW][C]160[/C][C]3854[/C][C]3613.2787[/C][C]3129.6725[/C][C]4250.3065[/C][C]0.2295[/C][C]0[/C][C]0.9656[/C][C]0[/C][/ROW]
[ROW][C]161[/C][C]2659[/C][C]2992.2845[/C][C]2640.2255[/C][C]3438.9076[/C][C]0.0718[/C][C]1e-04[/C][C]0.8276[/C][C]0[/C][/ROW]
[ROW][C]162[/C][C]2491[/C][C]2554.8986[/C][C]2286.5816[/C][C]2885.747[/C][C]0.3525[/C][C]0.2687[/C][C]0.7739[/C][C]0[/C][/ROW]
[ROW][C]163[/C][C]2455[/C][C]2500.9135[/C][C]2242.098[/C][C]2818.9651[/C][C]0.3886[/C][C]0.5244[/C][C]0.7548[/C][C]0[/C][/ROW]
[ROW][C]164[/C][C]2472[/C][C]2498.6803[/C][C]2240.1632[/C][C]2816.3462[/C][C]0.4346[/C][C]0.6062[/C][C]0.5066[/C][C]0[/C][/ROW]
[ROW][C]165[/C][C]3030[/C][C]2781.0049[/C][C]2470.1614[/C][C]3170.1192[/C][C]0.1049[/C][C]0.9402[/C][C]0.4221[/C][C]0[/C][/ROW]
[ROW][C]166[/C][C]3987[/C][C]3718.6139[/C][C]3207.7991[/C][C]4397.1479[/C][C]0.2191[/C][C]0.9767[/C][C]0.3479[/C][C]0[/C][/ROW]
[ROW][C]167[/C][C]4453[/C][C]4667.27[/C][C]3916.9989[/C][C]5722.823[/C][C]0.3454[/C][C]0.8967[/C][C]0.4404[/C][C]0.0318[/C][/ROW]
[ROW][C]168[/C][C]5417[/C][C]5623.4532[/C][C]4598.4928[/C][C]7148.3893[/C][C]0.3954[/C][C]0.9338[/C][C]0.4782[/C][C]0.4782[/C][/ROW]
[/TABLE]
Source: https://freestatistics.org/blog/index.php?pk=114753&T=1

Globally Unique Identifier (entire table): ba.freestatistics.org/blog/index.php?pk=114753&T=1

As an alternative you can also use a QR Code:  

The GUIDs for individual cells are displayed in the table below:

Univariate ARIMA Extrapolation Forecast
timeY[t]F[t]95% LB95% UBp-value(H0: Y[t] = F[t])P(F[t]>Y[t-1])P(F[t]>Y[t-s])P(F[t]>Y[156])
1444859-------
1455022-------
1464584-------
1474267-------
1483022-------
1492777-------
1502428-------
1512389-------
1522496-------
1532820-------
1543854-------
1554748-------
1565666-------
15752935940.32624894.35057471.22580.20360.63730.88010.6373
15849055121.2164263.75566348.30040.36490.39190.80460.1921
15949204839.52334059.76025937.60230.44290.45350.84660.0701
16038543613.27873129.67254250.30650.229500.96560
16126592992.28452640.22553438.90760.07181e-040.82760
16224912554.89862286.58162885.7470.35250.26870.77390
16324552500.91352242.0982818.96510.38860.52440.75480
16424722498.68032240.16322816.34620.43460.60620.50660
16530302781.00492470.16143170.11920.10490.94020.42210
16639873718.61393207.79914397.14790.21910.97670.34790
16744534667.273916.99895722.8230.34540.89670.44040.0318
16854175623.45324598.49287148.38930.39540.93380.47820.4782


Univariate ARIMA Extrapolation Forecast Performance
time% S.E.PEMAPESq.EMSERMSE
1570.1315-0.1090419031.203800
1580.1222-0.04220.075646749.3518232890.2778482.5871
1590.11580.01660.05596476.4983157419.0179396.7607
1600.08990.06660.058657946.7252132550.9448364.0755
1610.0762-0.11140.0692111078.588128256.4734358.1291
1620.0661-0.0250.06184083.0331107560.9327.9648
1630.0649-0.01840.05562108.053692496.2077304.1319
1640.0649-0.01070.05711.837481023.1614284.6457
1650.07140.08950.054461998.568578909.3177280.908
1660.09310.07220.056272031.121478221.4981279.6811
1670.1154-0.04590.055245911.626575284.237274.3797
1680.1384-0.03670.053742622.919872562.4606269.3742

\begin{tabular}{lllllllll}
\hline
Univariate ARIMA Extrapolation Forecast Performance \tabularnewline
time & % S.E. & PE & MAPE & Sq.E & MSE & RMSE \tabularnewline
157 & 0.1315 & -0.109 & 0 & 419031.2038 & 0 & 0 \tabularnewline
158 & 0.1222 & -0.0422 & 0.0756 & 46749.3518 & 232890.2778 & 482.5871 \tabularnewline
159 & 0.1158 & 0.0166 & 0.0559 & 6476.4983 & 157419.0179 & 396.7607 \tabularnewline
160 & 0.0899 & 0.0666 & 0.0586 & 57946.7252 & 132550.9448 & 364.0755 \tabularnewline
161 & 0.0762 & -0.1114 & 0.0692 & 111078.588 & 128256.4734 & 358.1291 \tabularnewline
162 & 0.0661 & -0.025 & 0.0618 & 4083.0331 & 107560.9 & 327.9648 \tabularnewline
163 & 0.0649 & -0.0184 & 0.0556 & 2108.0536 & 92496.2077 & 304.1319 \tabularnewline
164 & 0.0649 & -0.0107 & 0.05 & 711.8374 & 81023.1614 & 284.6457 \tabularnewline
165 & 0.0714 & 0.0895 & 0.0544 & 61998.5685 & 78909.3177 & 280.908 \tabularnewline
166 & 0.0931 & 0.0722 & 0.0562 & 72031.1214 & 78221.4981 & 279.6811 \tabularnewline
167 & 0.1154 & -0.0459 & 0.0552 & 45911.6265 & 75284.237 & 274.3797 \tabularnewline
168 & 0.1384 & -0.0367 & 0.0537 & 42622.9198 & 72562.4606 & 269.3742 \tabularnewline
\hline
\end{tabular}
%Source: https://freestatistics.org/blog/index.php?pk=114753&T=2

[TABLE]
[ROW][C]Univariate ARIMA Extrapolation Forecast Performance[/C][/ROW]
[ROW][C]time[/C][C]% S.E.[/C][C]PE[/C][C]MAPE[/C][C]Sq.E[/C][C]MSE[/C][C]RMSE[/C][/ROW]
[ROW][C]157[/C][C]0.1315[/C][C]-0.109[/C][C]0[/C][C]419031.2038[/C][C]0[/C][C]0[/C][/ROW]
[ROW][C]158[/C][C]0.1222[/C][C]-0.0422[/C][C]0.0756[/C][C]46749.3518[/C][C]232890.2778[/C][C]482.5871[/C][/ROW]
[ROW][C]159[/C][C]0.1158[/C][C]0.0166[/C][C]0.0559[/C][C]6476.4983[/C][C]157419.0179[/C][C]396.7607[/C][/ROW]
[ROW][C]160[/C][C]0.0899[/C][C]0.0666[/C][C]0.0586[/C][C]57946.7252[/C][C]132550.9448[/C][C]364.0755[/C][/ROW]
[ROW][C]161[/C][C]0.0762[/C][C]-0.1114[/C][C]0.0692[/C][C]111078.588[/C][C]128256.4734[/C][C]358.1291[/C][/ROW]
[ROW][C]162[/C][C]0.0661[/C][C]-0.025[/C][C]0.0618[/C][C]4083.0331[/C][C]107560.9[/C][C]327.9648[/C][/ROW]
[ROW][C]163[/C][C]0.0649[/C][C]-0.0184[/C][C]0.0556[/C][C]2108.0536[/C][C]92496.2077[/C][C]304.1319[/C][/ROW]
[ROW][C]164[/C][C]0.0649[/C][C]-0.0107[/C][C]0.05[/C][C]711.8374[/C][C]81023.1614[/C][C]284.6457[/C][/ROW]
[ROW][C]165[/C][C]0.0714[/C][C]0.0895[/C][C]0.0544[/C][C]61998.5685[/C][C]78909.3177[/C][C]280.908[/C][/ROW]
[ROW][C]166[/C][C]0.0931[/C][C]0.0722[/C][C]0.0562[/C][C]72031.1214[/C][C]78221.4981[/C][C]279.6811[/C][/ROW]
[ROW][C]167[/C][C]0.1154[/C][C]-0.0459[/C][C]0.0552[/C][C]45911.6265[/C][C]75284.237[/C][C]274.3797[/C][/ROW]
[ROW][C]168[/C][C]0.1384[/C][C]-0.0367[/C][C]0.0537[/C][C]42622.9198[/C][C]72562.4606[/C][C]269.3742[/C][/ROW]
[/TABLE]
Source: https://freestatistics.org/blog/index.php?pk=114753&T=2

Globally Unique Identifier (entire table): ba.freestatistics.org/blog/index.php?pk=114753&T=2

As an alternative you can also use a QR Code:  

The GUIDs for individual cells are displayed in the table below:

Univariate ARIMA Extrapolation Forecast Performance
time% S.E.PEMAPESq.EMSERMSE
1570.1315-0.1090419031.203800
1580.1222-0.04220.075646749.3518232890.2778482.5871
1590.11580.01660.05596476.4983157419.0179396.7607
1600.08990.06660.058657946.7252132550.9448364.0755
1610.0762-0.11140.0692111078.588128256.4734358.1291
1620.0661-0.0250.06184083.0331107560.9327.9648
1630.0649-0.01840.05562108.053692496.2077304.1319
1640.0649-0.01070.05711.837481023.1614284.6457
1650.07140.08950.054461998.568578909.3177280.908
1660.09310.07220.056272031.121478221.4981279.6811
1670.1154-0.04590.055245911.626575284.237274.3797
1680.1384-0.03670.053742622.919872562.4606269.3742


Parameters (Session):
par1 = 12 ; par2 = -0.8 ; par3 = 0 ; par4 = 1 ; par5 = 12 ; par6 = 3 ; par7 = 1 ; par8 = 0 ; par9 = 1 ; par10 = FALSE ;
Parameters (R input):
par1 = 12 ; par2 = -0.8 ; par3 = 0 ; par4 = 1 ; par5 = 12 ; par6 = 3 ; par7 = 1 ; par8 = 0 ; par9 = 1 ; par10 = FALSE ;
R code (references can be found in the software module):
par1 <- as.numeric(par1) #cut off periods
par2 <- as.numeric(par2) #lambda
par3 <- as.numeric(par3) #degree of non-seasonal differencing
par4 <- as.numeric(par4) #degree of seasonal differencing
par5 <- as.numeric(par5) #seasonal period
par6 <- as.numeric(par6) #p
par7 <- as.numeric(par7) #q
par8 <- as.numeric(par8) #P
par9 <- as.numeric(par9) #Q
if (par10 == 'TRUE') par10 <- TRUE
if (par10 == 'FALSE') par10 <- FALSE
if (par2 == 0) x <- log(x)
if (par2 != 0) x <- x^par2
lx <- length(x)
first <- lx - 2*par1
nx <- lx - par1
nx1 <- nx + 1
fx <- lx - nx
if (fx < 1) {
fx <- par5
nx1 <- lx + fx - 1
first <- lx - 2*fx
}
first <- 1
if (fx < 3) fx <- round(lx/10,0)
(arima.out <- arima(x[1:nx], order=c(par6,par3,par7), seasonal=list(order=c(par8,par4,par9), period=par5), include.mean=par10, method='ML'))
(forecast <- predict(arima.out,par1))
(lb <- forecast$pred - 1.96 * forecast$se)
(ub <- forecast$pred + 1.96 * forecast$se)
if (par2 == 0) {
x <- exp(x)
forecast$pred <- exp(forecast$pred)
lb <- exp(lb)
ub <- exp(ub)
}
if (par2 != 0) {
x <- x^(1/par2)
forecast$pred <- forecast$pred^(1/par2)
lb <- lb^(1/par2)
ub <- ub^(1/par2)
}
if (par2 < 0) {
olb <- lb
lb <- ub
ub <- olb
}
(actandfor <- c(x[1:nx], forecast$pred))
(perc.se <- (ub-forecast$pred)/1.96/forecast$pred)
bitmap(file='test1.png')
opar <- par(mar=c(4,4,2,2),las=1)
ylim <- c( min(x[first:nx],lb), max(x[first:nx],ub))
plot(x,ylim=ylim,type='n',xlim=c(first,lx))
usr <- par('usr')
rect(usr[1],usr[3],nx+1,usr[4],border=NA,col='lemonchiffon')
rect(nx1,usr[3],usr[2],usr[4],border=NA,col='lavender')
abline(h= (-3:3)*2 , col ='gray', lty =3)
polygon( c(nx1:lx,lx:nx1), c(lb,rev(ub)), col = 'orange', lty=2,border=NA)
lines(nx1:lx, lb , lty=2)
lines(nx1:lx, ub , lty=2)
lines(x, lwd=2)
lines(nx1:lx, forecast$pred , lwd=2 , col ='white')
box()
par(opar)
dev.off()
prob.dec <- array(NA, dim=fx)
prob.sdec <- array(NA, dim=fx)
prob.ldec <- array(NA, dim=fx)
prob.pval <- array(NA, dim=fx)
perf.pe <- array(0, dim=fx)
perf.mape <- array(0, dim=fx)
perf.mape1 <- array(0, dim=fx)
perf.se <- array(0, dim=fx)
perf.mse <- array(0, dim=fx)
perf.mse1 <- array(0, dim=fx)
perf.rmse <- array(0, dim=fx)
for (i in 1:fx) {
locSD <- (ub[i] - forecast$pred[i]) / 1.96
perf.pe[i] = (x[nx+i] - forecast$pred[i]) / forecast$pred[i]
perf.se[i] = (x[nx+i] - forecast$pred[i])^2
prob.dec[i] = pnorm((x[nx+i-1] - forecast$pred[i]) / locSD)
prob.sdec[i] = pnorm((x[nx+i-par5] - forecast$pred[i]) / locSD)
prob.ldec[i] = pnorm((x[nx] - forecast$pred[i]) / locSD)
prob.pval[i] = pnorm(abs(x[nx+i] - forecast$pred[i]) / locSD)
}
perf.mape[1] = abs(perf.pe[1])
perf.mse[1] = abs(perf.se[1])
for (i in 2:fx) {
perf.mape[i] = perf.mape[i-1] + abs(perf.pe[i])
perf.mape1[i] = perf.mape[i] / i
perf.mse[i] = perf.mse[i-1] + perf.se[i]
perf.mse1[i] = perf.mse[i] / i
}
perf.rmse = sqrt(perf.mse1)
bitmap(file='test2.png')
plot(forecast$pred, pch=19, type='b',main='ARIMA Extrapolation Forecast', ylab='Forecast and 95% CI', xlab='time',ylim=c(min(lb),max(ub)))
dum <- forecast$pred
dum[1:par1] <- x[(nx+1):lx]
lines(dum, lty=1)
lines(ub,lty=3)
lines(lb,lty=3)
dev.off()
load(file='createtable')
a<-table.start()
a<-table.row.start(a)
a<-table.element(a,'Univariate ARIMA Extrapolation Forecast',9,TRUE)
a<-table.row.end(a)
a<-table.row.start(a)
a<-table.element(a,'time',1,header=TRUE)
a<-table.element(a,'Y[t]',1,header=TRUE)
a<-table.element(a,'F[t]',1,header=TRUE)
a<-table.element(a,'95% LB',1,header=TRUE)
a<-table.element(a,'95% UB',1,header=TRUE)
a<-table.element(a,'p-value
(H0: Y[t] = F[t])',1,header=TRUE)
a<-table.element(a,'P(F[t]>Y[t-1])',1,header=TRUE)
a<-table.element(a,'P(F[t]>Y[t-s])',1,header=TRUE)
mylab <- paste('P(F[t]>Y[',nx,sep='')
mylab <- paste(mylab,'])',sep='')
a<-table.element(a,mylab,1,header=TRUE)
a<-table.row.end(a)
for (i in (nx-par5):nx) {
a<-table.row.start(a)
a<-table.element(a,i,header=TRUE)
a<-table.element(a,x[i])
a<-table.element(a,'-')
a<-table.row.end(a)
}
for (i in 1:fx) {
a<-table.row.start(a)
a<-table.element(a,nx+i,header=TRUE)
a<-table.element(a,round(x[nx+i],4))
a<-table.element(a,round(forecast$pred[i],4))
a<-table.element(a,round(lb[i],4))
a<-table.element(a,round(ub[i],4))
a<-table.element(a,round((1-prob.pval[i]),4))
a<-table.element(a,round((1-prob.dec[i]),4))
a<-table.element(a,round((1-prob.sdec[i]),4))
a<-table.element(a,round((1-prob.ldec[i]),4))
a<-table.row.end(a)
}
a<-table.end(a)
table.save(a,file='mytable.tab')
a<-table.start()
a<-table.row.start(a)
a<-table.element(a,'Univariate ARIMA Extrapolation Forecast Performance',7,TRUE)
a<-table.row.end(a)
a<-table.row.start(a)
a<-table.element(a,'time',1,header=TRUE)
a<-table.element(a,'% S.E.',1,header=TRUE)
a<-table.element(a,'PE',1,header=TRUE)
a<-table.element(a,'MAPE',1,header=TRUE)
a<-table.element(a,'Sq.E',1,header=TRUE)
a<-table.element(a,'MSE',1,header=TRUE)
a<-table.element(a,'RMSE',1,header=TRUE)
a<-table.row.end(a)
for (i in 1:fx) {
a<-table.row.start(a)
a<-table.element(a,nx+i,header=TRUE)
a<-table.element(a,round(perc.se[i],4))
a<-table.element(a,round(perf.pe[i],4))
a<-table.element(a,round(perf.mape1[i],4))
a<-table.element(a,round(perf.se[i],4))
a<-table.element(a,round(perf.mse1[i],4))
a<-table.element(a,round(perf.rmse[i],4))
a<-table.row.end(a)
}
a<-table.end(a)
table.save(a,file='mytable1.tab')