| Multiple Linear Regression - Estimated Regression Equation |
| werkloosheid[t] = + 54.688868086339 + 15.4672034890724X[t] + 0.867182913866395Y1[t] + 0.0182351757154025Y2[t] + 0.0901575020601514Y3[t] -0.0792498762689881Y4[t] -6.32635130262516M1[t] -1.98379057484731M2[t] -9.38552483421278M3[t] + 6.24483290359042M4[t] + 55.5025039171427M5[t] + 18.4493878081356M6[t] -5.3793087605908M7[t] -15.4976086152822M8[t] -10.2896605094049M9[t] + 9.22862675771806M10[t] + 10.6463475101817M11[t] -0.326596864040714t + e[t] |
| Multiple Linear Regression - Ordinary Least Squares | |||||
| Variable | Parameter | S.D. | T-STAT H0: parameter = 0 | 2-tail p-value | 1-tail p-value |
| (Intercept) | 54.688868086339 | 19.801389 | 2.7619 | 0.008719 | 0.00436 |
| X | 15.4672034890724 | 5.117263 | 3.0226 | 0.004413 | 0.002207 |
| Y1 | 0.867182913866395 | 0.163559 | 5.302 | 5e-06 | 2e-06 |
| Y2 | 0.0182351757154025 | 0.210214 | 0.0867 | 0.931318 | 0.465659 |
| Y3 | 0.0901575020601514 | 0.209349 | 0.4307 | 0.669089 | 0.334544 |
| Y4 | -0.0792498762689881 | 0.144881 | -0.547 | 0.587496 | 0.293748 |
| M1 | -6.32635130262516 | 5.172696 | -1.223 | 0.228658 | 0.114329 |
| M2 | -1.98379057484731 | 5.65065 | -0.3511 | 0.727423 | 0.363712 |
| M3 | -9.38552483421278 | 5.221505 | -1.7975 | 0.080006 | 0.040003 |
| M4 | 6.24483290359042 | 5.407752 | 1.1548 | 0.255202 | 0.127601 |
| M5 | 55.5025039171427 | 5.176836 | 10.7213 | 0 | 0 |
| M6 | 18.4493878081356 | 8.624358 | 2.1392 | 0.038734 | 0.019367 |
| M7 | -5.3793087605908 | 8.72921 | -0.6162 | 0.541315 | 0.270658 |
| M8 | -15.4976086152822 | 10.869989 | -1.4257 | 0.161903 | 0.080952 |
| M9 | -10.2896605094049 | 7.227696 | -1.4236 | 0.162501 | 0.081251 |
| M10 | 9.22862675771806 | 6.585941 | 1.4013 | 0.169044 | 0.084522 |
| M11 | 10.6463475101817 | 5.258996 | 2.0244 | 0.049815 | 0.024908 |
| t | -0.326596864040714 | 0.131138 | -2.4905 | 0.017124 | 0.008562 |
| Multiple Linear Regression - Regression Statistics | |
| Multiple R | 0.990000066468989 |
| R-squared | 0.980100131608602 |
| Adjusted R-squared | 0.971425830002095 |
| F-TEST (value) | 112.988938599207 |
| F-TEST (DF numerator) | 17 |
| F-TEST (DF denominator) | 39 |
| p-value | 0 |
| Multiple Linear Regression - Residual Statistics | |
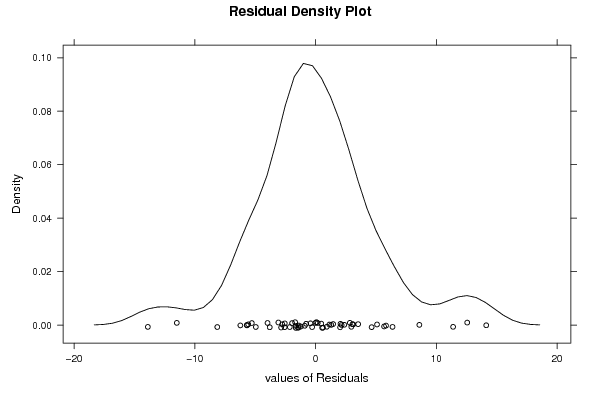
| Residual Standard Deviation | 6.12271996026891 |
| Sum Squared Residuals | 1462.02028876314 |
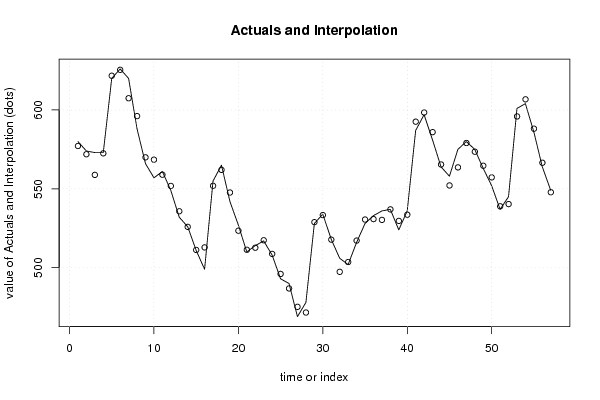
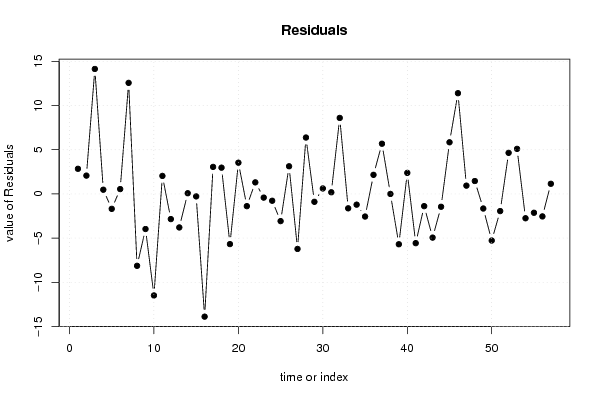
| Multiple Linear Regression - Actuals, Interpolation, and Residuals | |||
| Time or Index | Actuals | Interpolation Forecast | Residuals Prediction Error |
| 1 | 580 | 577.157650649944 | 2.84234935005625 |
| 2 | 574 | 571.927950087091 | 2.07204991290907 |
| 3 | 573 | 558.860696722228 | 14.1393032777724 |
| 4 | 573 | 572.524038236037 | 0.475961763963054 |
| 5 | 620 | 621.688430960162 | -1.68843096016204 |
| 6 | 626 | 625.451656694388 | 0.548343305611468 |
| 7 | 620 | 607.435763879713 | 12.5642361202872 |
| 8 | 588 | 596.134583328902 | -8.13458332890183 |
| 9 | 566 | 569.97287110044 | -3.9728711004398 |
| 10 | 557 | 568.486567505594 | -11.4865675055936 |
| 11 | 561 | 558.962330495169 | 2.03766950483076 |
| 12 | 549 | 551.846532190258 | -2.84653219025809 |
| 13 | 532 | 535.792409519433 | -3.79240951943347 |
| 14 | 526 | 525.921320633519 | 0.0786793664814366 |
| 15 | 511 | 511.281004509954 | -0.281004509954394 |
| 16 | 499 | 512.885931601634 | -13.8859316016338 |
| 17 | 555 | 551.94358603323 | 3.05641396677045 |
| 18 | 565 | 562.030430854827 | 2.96956914517342 |
| 19 | 542 | 547.674994520099 | -5.67499452009903 |
| 20 | 527 | 523.46706117019 | 3.53293882980978 |
| 21 | 510 | 511.384841612115 | -1.38484161211476 |
| 22 | 514 | 512.694773533664 | 1.30522646633610 |
| 23 | 517 | 517.415015713675 | -0.415015713675013 |
| 24 | 508 | 508.772631392926 | -0.772631392925657 |
| 25 | 493 | 496.077620433422 | -3.07762043342185 |
| 26 | 490 | 486.875197008829 | 3.12480299117106 |
| 27 | 469 | 475.222622360744 | -6.22262236074419 |
| 28 | 478 | 471.621722871685 | 6.37827712831518 |
| 29 | 528 | 528.892780193825 | -0.892780193824865 |
| 30 | 534 | 533.380771581079 | 0.619228418920864 |
| 31 | 518 | 517.815999337471 | 0.184000662529309 |
| 32 | 506 | 497.400213267755 | 8.59978673224463 |
| 33 | 502 | 503.629261419733 | -1.62926141973265 |
| 34 | 516 | 517.215378768188 | -1.21537876818814 |
| 35 | 528 | 530.560230743461 | -2.56023074346098 |
| 36 | 533 | 530.839142302638 | 2.16085769736180 |
| 37 | 536 | 530.320135347807 | 5.67986465219281 |
| 38 | 537 | 537.001215588676 | -0.00121558867650695 |
| 39 | 524 | 529.694561901356 | -5.69456190135582 |
| 40 | 536 | 533.617403195406 | 2.38259680459390 |
| 41 | 587 | 592.570022900267 | -5.57002290026737 |
| 42 | 597 | 598.38416323994 | -1.38416323993952 |
| 43 | 581 | 585.94283132354 | -4.94283132354058 |
| 44 | 564 | 565.45239382994 | -1.45239382994006 |
| 45 | 558 | 552.159704055485 | 5.84029594451544 |
| 46 | 575 | 563.603280192554 | 11.3967198074457 |
| 47 | 580 | 579.062423047695 | 0.937576952305238 |
| 48 | 575 | 573.541694114178 | 1.45830588582193 |
| 49 | 563 | 564.652184049394 | -1.65218404939374 |
| 50 | 552 | 557.274316681885 | -5.27431668188508 |
| 51 | 537 | 538.941114505718 | -1.94111450571803 |
| 52 | 545 | 540.350904095238 | 4.64909590476171 |
| 53 | 601 | 595.905179912516 | 5.09482008748383 |
| 54 | 604 | 606.752977629766 | -2.75297762976624 |
| 55 | 586 | 588.130410939177 | -2.13041093917693 |
| 56 | 564 | 566.545748403213 | -2.54574840321251 |
| 57 | 549 | 547.853321812228 | 1.14667818777177 |
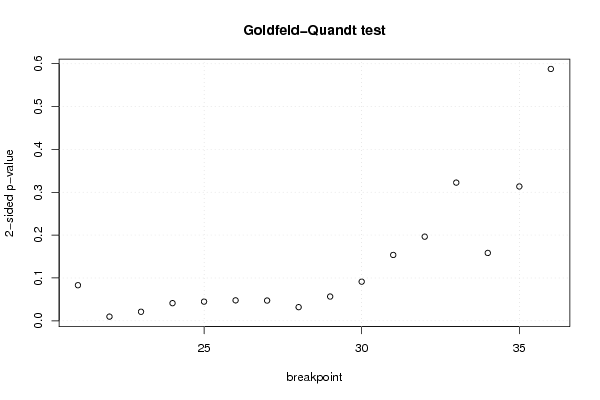
| Goldfeld-Quandt test for Heteroskedasticity | |||
| p-values | Alternative Hypothesis | ||
| breakpoint index | greater | 2-sided | less |
| 21 | 0.958437404485573 | 0.0831251910288544 | 0.0415625955144272 |
| 22 | 0.995133601511774 | 0.00973279697645296 | 0.00486639848822648 |
| 23 | 0.9894390889178 | 0.0211218221644008 | 0.0105609110822004 |
| 24 | 0.979387998807026 | 0.0412240023859472 | 0.0206120011929736 |
| 25 | 0.97760034509806 | 0.0447993098038802 | 0.0223996549019401 |
| 26 | 0.976110877515844 | 0.047778244968311 | 0.0238891224841555 |
| 27 | 0.976363648594834 | 0.0472727028103321 | 0.0236363514051661 |
| 28 | 0.984058213961216 | 0.0318835720775677 | 0.0159417860387838 |
| 29 | 0.971675086585397 | 0.0566498268292051 | 0.0283249134146026 |
| 30 | 0.954319686113465 | 0.0913606277730695 | 0.0456803138865347 |
| 31 | 0.923151445357877 | 0.153697109284246 | 0.0768485546421231 |
| 32 | 0.901811530573639 | 0.196376938852722 | 0.098188469426361 |
| 33 | 0.838750033797894 | 0.322499932404211 | 0.161249966202106 |
| 34 | 0.920795600211375 | 0.158408799577250 | 0.0792043997886252 |
| 35 | 0.843259445394139 | 0.313481109211723 | 0.156740554605861 |
| 36 | 0.706121654652964 | 0.587756690694072 | 0.293878345347036 |
| Meta Analysis of Goldfeld-Quandt test for Heteroskedasticity | |||
| Description | # significant tests | % significant tests | OK/NOK |
| 1% type I error level | 1 | 0.0625 | NOK |
| 5% type I error level | 7 | 0.4375 | NOK |
| 10% type I error level | 10 | 0.625 | NOK |