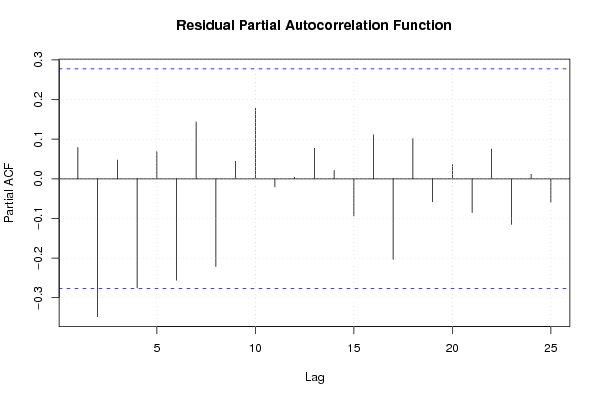
| Multiple Linear Regression - Estimated Regression Equation |
| Wealth[t] = -216241.33931436 + 5.27817321004937Dividends[t] -230.700757875951Trades[t] + 28.3041837527339Costs[t] + e[t] |
| Multiple Linear Regression - Ordinary Least Squares | |||||
| Variable | Parameter | S.D. | T-STAT H0: parameter = 0 | 2-tail p-value | 1-tail p-value |
| (Intercept) | -216241.33931436 | 260735.548091 | -0.8294 | 0.411189 | 0.205594 |
| Dividends | 5.27817321004937 | 1.794062 | 2.942 | 0.005092 | 0.002546 |
| Trades | -230.700757875951 | 834.369671 | -0.2765 | 0.783405 | 0.391702 |
| Costs | 28.3041837527339 | 6.437106 | 4.397 | 6.4e-05 | 3.2e-05 |
| Multiple Linear Regression - Regression Statistics | |
| Multiple R | 0.721039475305495 |
| R-squared | 0.519897924948823 |
| Adjusted R-squared | 0.488586920054181 |
| F-TEST (value) | 16.6043193662491 |
| F-TEST (DF numerator) | 3 |
| F-TEST (DF denominator) | 46 |
| p-value | 1.89261485483705e-07 |
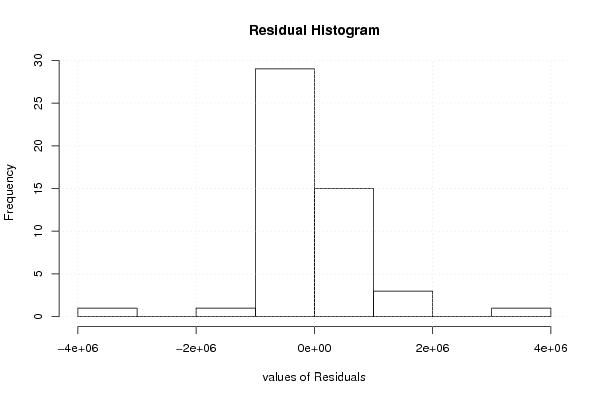
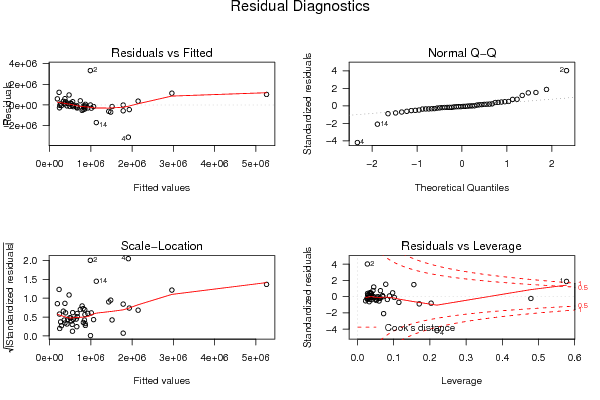
| Multiple Linear Regression - Residual Statistics | |
| Residual Standard Deviation | 843234.15063263 |
| Sum Squared Residuals | 32708016308484.1 |
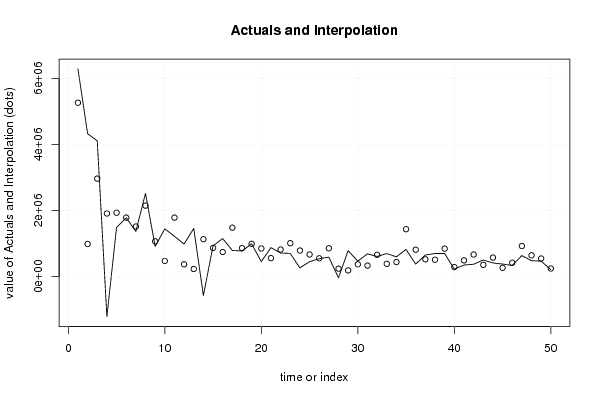
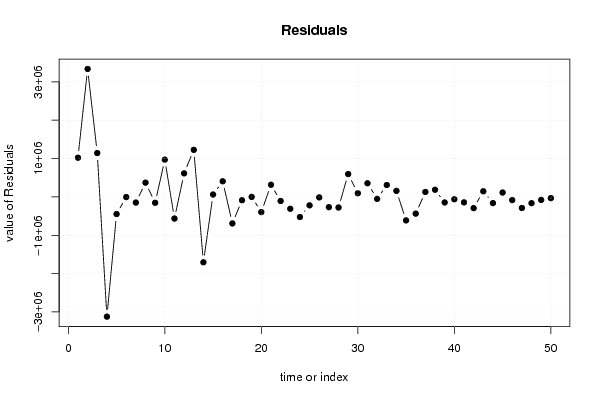
| Multiple Linear Regression - Actuals, Interpolation, and Residuals | |||
| Time or Index | Actuals | Interpolation Forecast | Residuals Prediction Error |
| 1 | 6282929 | 5260259.75371044 | 1022669.24628956 |
| 2 | 4324047 | 987234.149362023 | 3336812.85063798 |
| 3 | 4108272 | 2964734.58056345 | 1143537.41943655 |
| 4 | -1212617 | 1909277.08721999 | -3121894.08721999 |
| 5 | 1485329 | 1931907.68163525 | -446578.681635252 |
| 6 | 1779876 | 1784292.63561575 | -4416.63561574885 |
| 7 | 1367203 | 1514561.87770431 | -147358.877704313 |
| 8 | 2519076 | 2146253.73750155 | 372822.262498454 |
| 9 | 912684 | 1065717.87653985 | -153033.876539853 |
| 10 | 1443586 | 471654.555211046 | 971931.444788954 |
| 11 | 1220017 | 1784359.45889780 | -564342.458897803 |
| 12 | 984885 | 370708.200666769 | 614176.799333231 |
| 13 | 1457425 | 229467.069485852 | 1227957.93051415 |
| 14 | -572920 | 1131914.39998605 | -1704834.39998605 |
| 15 | 929144 | 866506.001951546 | 62637.9980484542 |
| 16 | 1151176 | 743741.482584666 | 407434.517415334 |
| 17 | 790090 | 1481234.15288781 | -691144.15288781 |
| 18 | 774497 | 860532.346994978 | -86035.3469949775 |
| 19 | 990576 | 990655.58317345 | -79.583173450461 |
| 20 | 454195 | 850508.046470685 | -396313.046470685 |
| 21 | 876607 | 558524.791194374 | 318082.208805626 |
| 22 | 711969 | 817615.720557757 | -105646.720557757 |
| 23 | 702380 | 1011199.75464848 | -308819.754648477 |
| 24 | 264449 | 788213.278763628 | -523764.278763628 |
| 25 | 450033 | 669219.777202197 | -219186.777202197 |
| 26 | 541063 | 553827.237267971 | -12764.2372679711 |
| 27 | 588864 | 856402.982134945 | -267538.982134945 |
| 28 | -37216 | 238617.071471440 | -275833.071471440 |
| 29 | 783310 | 187521.254858521 | 595788.745141479 |
| 30 | 467359 | 371662.681805265 | 95696.3181947352 |
| 31 | 688779 | 332706.689689186 | 356072.310310814 |
| 32 | 608419 | 658759.037877714 | -50340.0378777138 |
| 33 | 696348 | 386243.939315873 | 310104.060684127 |
| 34 | 597793 | 439415.481697454 | 158377.518302546 |
| 35 | 821730 | 1433785.04421903 | -612055.044219029 |
| 36 | 377934 | 813408.037672894 | -435474.037672894 |
| 37 | 651939 | 522586.945759953 | 129352.054240047 |
| 38 | 697458 | 509776.111948998 | 187681.888051002 |
| 39 | 700368 | 844710.197265502 | -144342.197265502 |
| 40 | 225986 | 286696.109338281 | -60710.1093382805 |
| 41 | 348695 | 490890.052802516 | -142195.052802516 |
| 42 | 373683 | 667031.956938051 | -293348.956938051 |
| 43 | 501709 | 354847.427894736 | 146861.572105264 |
| 44 | 413743 | 574247.434951195 | -160504.434951195 |
| 45 | 379825 | 265480.157138787 | 114344.842861213 |
| 46 | 336260 | 418892.833142698 | -82632.8331426981 |
| 47 | 636765 | 924979.609921747 | -288214.609921747 |
| 48 | 481231 | 644531.66585773 | -163300.665857730 |
| 49 | 469107 | 546613.479365427 | -77506.4793654269 |
| 50 | 211928 | 244060.559134379 | -32132.559134379 |
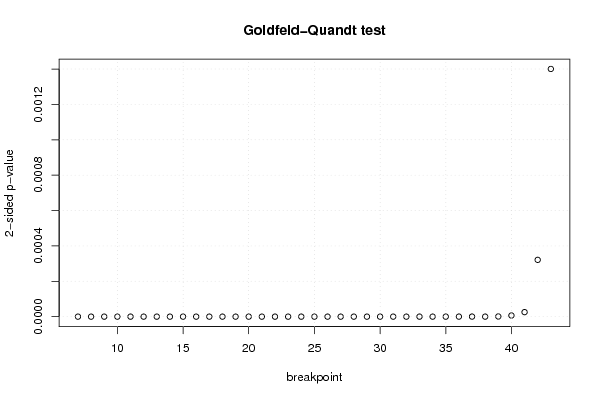
| Goldfeld-Quandt test for Heteroskedasticity | |||
| p-values | Alternative Hypothesis | ||
| breakpoint index | greater | 2-sided | less |
| 7 | 0.9999999959842 | 8.031599993387e-09 | 4.0157999966935e-09 |
| 8 | 0.999999999972723 | 5.4554394701337e-11 | 2.72771973506685e-11 |
| 9 | 0.999999999874883 | 2.50235015477770e-10 | 1.25117507738885e-10 |
| 10 | 0.99999999997513 | 4.97396308670504e-11 | 2.48698154335252e-11 |
| 11 | 0.999999999994918 | 1.01644405554525e-11 | 5.08222027772623e-12 |
| 12 | 0.999999999989315 | 2.13694855513371e-11 | 1.06847427756685e-11 |
| 13 | 0.999999999999702 | 5.95564203285812e-13 | 2.97782101642906e-13 |
| 14 | 1 | 8.54398056652114e-17 | 4.27199028326057e-17 |
| 15 | 1 | 1.61287117539092e-16 | 8.06435587695458e-17 |
| 16 | 1 | 3.35283701050966e-17 | 1.67641850525483e-17 |
| 17 | 1 | 7.28514433037711e-17 | 3.64257216518855e-17 |
| 18 | 1 | 2.65667961995887e-16 | 1.32833980997944e-16 |
| 19 | 1 | 5.45953629383485e-16 | 2.72976814691742e-16 |
| 20 | 0.999999999999998 | 3.31301813495944e-15 | 1.65650906747972e-15 |
| 21 | 0.999999999999998 | 3.73430084398991e-15 | 1.86715042199495e-15 |
| 22 | 0.99999999999999 | 1.89370901551996e-14 | 9.4685450775998e-15 |
| 23 | 0.999999999999944 | 1.12319236372707e-13 | 5.61596181863533e-14 |
| 24 | 0.999999999999838 | 3.23248861417049e-13 | 1.61624430708524e-13 |
| 25 | 0.999999999999054 | 1.89219820308593e-12 | 9.46099101542965e-13 |
| 26 | 0.999999999993876 | 1.22481942924936e-11 | 6.12409714624678e-12 |
| 27 | 0.999999999968538 | 6.29236179496501e-11 | 3.14618089748251e-11 |
| 28 | 0.999999999989076 | 2.18477857889081e-11 | 1.09238928944541e-11 |
| 29 | 0.999999999993036 | 1.39278135215315e-11 | 6.96390676076577e-12 |
| 30 | 0.99999999995875 | 8.24994804329799e-11 | 4.12497402164899e-11 |
| 31 | 0.999999999897176 | 2.05648437832462e-10 | 1.02824218916231e-10 |
| 32 | 0.99999999940928 | 1.18144140057883e-09 | 5.90720700289415e-10 |
| 33 | 0.999999999249994 | 1.50001231948556e-09 | 7.5000615974278e-10 |
| 34 | 0.99999999689505 | 6.20990099601257e-09 | 3.10495049800629e-09 |
| 35 | 0.999999980739143 | 3.85217139968214e-08 | 1.92608569984107e-08 |
| 36 | 0.999999909920896 | 1.80158207267686e-07 | 9.00791036338429e-08 |
| 37 | 0.99999983333779 | 3.33324420138176e-07 | 1.66662210069088e-07 |
| 38 | 0.999999934560217 | 1.30879567015064e-07 | 6.54397835075318e-08 |
| 39 | 0.999999501278378 | 9.97443244377578e-07 | 4.98721622188789e-07 |
| 40 | 0.99999673524599 | 6.52950802144258e-06 | 3.26475401072129e-06 |
| 41 | 0.99998725520848 | 2.54895830394685e-05 | 1.27447915197342e-05 |
| 42 | 0.999839458393447 | 0.000321083213105298 | 0.000160541606552649 |
| 43 | 0.999299853996546 | 0.00140029200690877 | 0.000700146003454385 |
| Meta Analysis of Goldfeld-Quandt test for Heteroskedasticity | |||
| Description | # significant tests | % significant tests | OK/NOK |
| 1% type I error level | 37 | 1 | NOK |
| 5% type I error level | 37 | 1 | NOK |
| 10% type I error level | 37 | 1 | NOK |