Free Statistics

of Irreproducible Research!

Author's title

Author*The author of this computation has been verified*
R Software Modulerwasp_multipleregression.wasp
Title produced by softwareMultiple Regression
Date of computationFri, 24 Dec 2010 10:50:01 +0000
Cite this page as followsStatistical Computations at FreeStatistics.org, Office for Research Development and Education, URL https://freestatistics.org/blog/index.php?v=date/2010/Dec/24/t1293187901u9thvsokagkjwio.htm/, Retrieved Tue, 30 Apr 2024 07:53:12 +0000
Statistical Computations at FreeStatistics.org, Office for Research Development and Education, URL https://freestatistics.org/blog/index.php?pk=114741, Retrieved Tue, 30 Apr 2024 07:53:12 +0000
QR Codes:

Original text written by user:
IsPrivate?No (this computation is public)
User-defined keywords
Estimated Impact145
Family? (F = Feedback message, R = changed R code, M = changed R Module, P = changed Parameters, D = changed Data)
-     [Multiple Regression] [Competence to learn] [2010-11-17 07:43:53] [b98453cac15ba1066b407e146608df68]
-   PD  [Multiple Regression] [workshop 4 probee...] [2010-11-30 12:02:39] [17d39bb3ec485d4ce196f61215d11ba1]
-         [Multiple Regression] [Workshop 4 ] [2010-11-30 13:44:41] [442b6d00ecbe55ac6a674160c9c5510a]
-   PD      [Multiple Regression] [Workshop 4 Multip...] [2010-12-02 10:27:32] [f1bd7399181c649098ca7b814ee0e027]
-   PD          [Multiple Regression] [Workshop 7] [2010-12-24 10:50:01] [d5e0edb7e0239841e94676417b2a1e2e] [Current]
Feedback Forum

Post a new message
Dataseries X:
6282929	213118	1081	162556
4324047	81767	309	29790
4108272	153198	458	87550
-1212617	-26007	588	84738
1485329	126942	299	54660
1779876	157214	156	42634
1367203	129352	481	40949
2519076	234817	323	42312
912684	60448	452	37704
1443586	47818	109	16275
1220017	245546	115	25830
984885	48020	110	12679
1457425	-1710	239	18014
-572920	32648	247	43556
929144	95350	497	24524
1151176	151352	103	6532
790090	288170	109	7123
774497	114337	502	20813
990576	37884	248	37597
454195	122844	373	17821
876607	82340	119	12988
711969	79801	84	22330
702380	165548	102	13326
264449	116384	295	16189
450033	134028	105	7146
541063	63838	64	15824
588864	74996	267	26088
-37216	31080	129	11326
783310	32168	37	8568
467359	49857	361	14416
688779	87161	28	3369
608419	106113	85	11819
696348	80570	44	6620
597793	102129	49	4519
821730	301670	22	2220
377934	102313	155	18562
651939	88577	91	10327
697458	112477	81	5336
700368	191778	79	2365
225986	79804	145	4069
348695	128294	816	7710
373683	96448	61	13718
501709	93811	226	4525
413743	117520	105	6869
379825	69159	62	4628
336260	101792	24	3653
636765	210568	26	1265
481231	136996	322	7489
469107	121920	84	4901
211928	76403	33	2284


Summary of computational transaction
Raw Inputview raw input (R code)
Raw Outputview raw output of R engine
Computing time7 seconds
R Server'Gwilym Jenkins' @ 72.249.127.135

\begin{tabular}{lllllllll}
\hline
Summary of computational transaction \tabularnewline
Raw Input & view raw input (R code)  \tabularnewline
Raw Output & view raw output of R engine  \tabularnewline
Computing time & 7 seconds \tabularnewline
R Server & 'Gwilym Jenkins' @ 72.249.127.135 \tabularnewline
\hline
\end{tabular}
%Source: https://freestatistics.org/blog/index.php?pk=114741&T=0

[TABLE]
[ROW][C]Summary of computational transaction[/C][/ROW]
[ROW][C]Raw Input[/C][C]view raw input (R code) [/C][/ROW]
[ROW][C]Raw Output[/C][C]view raw output of R engine [/C][/ROW]
[ROW][C]Computing time[/C][C]7 seconds[/C][/ROW]
[ROW][C]R Server[/C][C]'Gwilym Jenkins' @ 72.249.127.135[/C][/ROW]
[/TABLE]
Source: https://freestatistics.org/blog/index.php?pk=114741&T=0

Globally Unique Identifier (entire table): ba.freestatistics.org/blog/index.php?pk=114741&T=0

As an alternative you can also use a QR Code:  

The GUIDs for individual cells are displayed in the table below:

Summary of computational transaction
Raw Inputview raw input (R code)
Raw Outputview raw output of R engine
Computing time7 seconds
R Server'Gwilym Jenkins' @ 72.249.127.135


Multiple Linear Regression - Estimated Regression Equation
Wealth[t] = -216241.33931436 + 5.27817321004937Dividends[t] -230.700757875951Trades[t] + 28.3041837527339Costs[t] + e[t]

\begin{tabular}{lllllllll}
\hline
Multiple Linear Regression - Estimated Regression Equation \tabularnewline
Wealth[t] =  -216241.33931436 +  5.27817321004937Dividends[t] -230.700757875951Trades[t] +  28.3041837527339Costs[t]  + e[t] \tabularnewline
\hline
\end{tabular}
%Source: https://freestatistics.org/blog/index.php?pk=114741&T=1

[TABLE]
[ROW][C]Multiple Linear Regression - Estimated Regression Equation[/C][/ROW]
[ROW][C]Wealth[t] =  -216241.33931436 +  5.27817321004937Dividends[t] -230.700757875951Trades[t] +  28.3041837527339Costs[t]  + e[t][/C][/ROW]
[/TABLE]
Source: https://freestatistics.org/blog/index.php?pk=114741&T=1

Globally Unique Identifier (entire table): ba.freestatistics.org/blog/index.php?pk=114741&T=1

As an alternative you can also use a QR Code:  

The GUIDs for individual cells are displayed in the table below:

Multiple Linear Regression - Estimated Regression Equation
Wealth[t] = -216241.33931436 + 5.27817321004937Dividends[t] -230.700757875951Trades[t] + 28.3041837527339Costs[t] + e[t]


Multiple Linear Regression - Ordinary Least Squares
VariableParameterS.D.T-STATH0: parameter = 02-tail p-value1-tail p-value
(Intercept)-216241.33931436260735.548091-0.82940.4111890.205594
Dividends5.278173210049371.7940622.9420.0050920.002546
Trades-230.700757875951834.369671-0.27650.7834050.391702
Costs28.30418375273396.4371064.3976.4e-053.2e-05

\begin{tabular}{lllllllll}
\hline
Multiple Linear Regression - Ordinary Least Squares \tabularnewline
Variable & Parameter & S.D. & T-STATH0: parameter = 0 & 2-tail p-value & 1-tail p-value \tabularnewline
(Intercept) & -216241.33931436 & 260735.548091 & -0.8294 & 0.411189 & 0.205594 \tabularnewline
Dividends & 5.27817321004937 & 1.794062 & 2.942 & 0.005092 & 0.002546 \tabularnewline
Trades & -230.700757875951 & 834.369671 & -0.2765 & 0.783405 & 0.391702 \tabularnewline
Costs & 28.3041837527339 & 6.437106 & 4.397 & 6.4e-05 & 3.2e-05 \tabularnewline
\hline
\end{tabular}
%Source: https://freestatistics.org/blog/index.php?pk=114741&T=2

[TABLE]
[ROW][C]Multiple Linear Regression - Ordinary Least Squares[/C][/ROW]
[ROW][C]Variable[/C][C]Parameter[/C][C]S.D.[/C][C]T-STATH0: parameter = 0[/C][C]2-tail p-value[/C][C]1-tail p-value[/C][/ROW]
[ROW][C](Intercept)[/C][C]-216241.33931436[/C][C]260735.548091[/C][C]-0.8294[/C][C]0.411189[/C][C]0.205594[/C][/ROW]
[ROW][C]Dividends[/C][C]5.27817321004937[/C][C]1.794062[/C][C]2.942[/C][C]0.005092[/C][C]0.002546[/C][/ROW]
[ROW][C]Trades[/C][C]-230.700757875951[/C][C]834.369671[/C][C]-0.2765[/C][C]0.783405[/C][C]0.391702[/C][/ROW]
[ROW][C]Costs[/C][C]28.3041837527339[/C][C]6.437106[/C][C]4.397[/C][C]6.4e-05[/C][C]3.2e-05[/C][/ROW]
[/TABLE]
Source: https://freestatistics.org/blog/index.php?pk=114741&T=2

Globally Unique Identifier (entire table): ba.freestatistics.org/blog/index.php?pk=114741&T=2

As an alternative you can also use a QR Code:  

The GUIDs for individual cells are displayed in the table below:

Multiple Linear Regression - Ordinary Least Squares
VariableParameterS.D.T-STATH0: parameter = 02-tail p-value1-tail p-value
(Intercept)-216241.33931436260735.548091-0.82940.4111890.205594
Dividends5.278173210049371.7940622.9420.0050920.002546
Trades-230.700757875951834.369671-0.27650.7834050.391702
Costs28.30418375273396.4371064.3976.4e-053.2e-05


Multiple Linear Regression - Regression Statistics
Multiple R0.721039475305495
R-squared0.519897924948823
Adjusted R-squared0.488586920054181
F-TEST (value)16.6043193662491
F-TEST (DF numerator)3
F-TEST (DF denominator)46
p-value1.89261485483705e-07
Multiple Linear Regression - Residual Statistics
Residual Standard Deviation843234.15063263
Sum Squared Residuals32708016308484.1

\begin{tabular}{lllllllll}
\hline
Multiple Linear Regression - Regression Statistics \tabularnewline
Multiple R & 0.721039475305495 \tabularnewline
R-squared & 0.519897924948823 \tabularnewline
Adjusted R-squared & 0.488586920054181 \tabularnewline
F-TEST (value) & 16.6043193662491 \tabularnewline
F-TEST (DF numerator) & 3 \tabularnewline
F-TEST (DF denominator) & 46 \tabularnewline
p-value & 1.89261485483705e-07 \tabularnewline
Multiple Linear Regression - Residual Statistics \tabularnewline
Residual Standard Deviation & 843234.15063263 \tabularnewline
Sum Squared Residuals & 32708016308484.1 \tabularnewline
\hline
\end{tabular}
%Source: https://freestatistics.org/blog/index.php?pk=114741&T=3

[TABLE]
[ROW][C]Multiple Linear Regression - Regression Statistics[/C][/ROW]
[ROW][C]Multiple R[/C][C]0.721039475305495[/C][/ROW]
[ROW][C]R-squared[/C][C]0.519897924948823[/C][/ROW]
[ROW][C]Adjusted R-squared[/C][C]0.488586920054181[/C][/ROW]
[ROW][C]F-TEST (value)[/C][C]16.6043193662491[/C][/ROW]
[ROW][C]F-TEST (DF numerator)[/C][C]3[/C][/ROW]
[ROW][C]F-TEST (DF denominator)[/C][C]46[/C][/ROW]
[ROW][C]p-value[/C][C]1.89261485483705e-07[/C][/ROW]
[ROW][C]Multiple Linear Regression - Residual Statistics[/C][/ROW]
[ROW][C]Residual Standard Deviation[/C][C]843234.15063263[/C][/ROW]
[ROW][C]Sum Squared Residuals[/C][C]32708016308484.1[/C][/ROW]
[/TABLE]
Source: https://freestatistics.org/blog/index.php?pk=114741&T=3

Globally Unique Identifier (entire table): ba.freestatistics.org/blog/index.php?pk=114741&T=3

As an alternative you can also use a QR Code:  

The GUIDs for individual cells are displayed in the table below:

Multiple Linear Regression - Regression Statistics
Multiple R0.721039475305495
R-squared0.519897924948823
Adjusted R-squared0.488586920054181
F-TEST (value)16.6043193662491
F-TEST (DF numerator)3
F-TEST (DF denominator)46
p-value1.89261485483705e-07
Multiple Linear Regression - Residual Statistics
Residual Standard Deviation843234.15063263
Sum Squared Residuals32708016308484.1


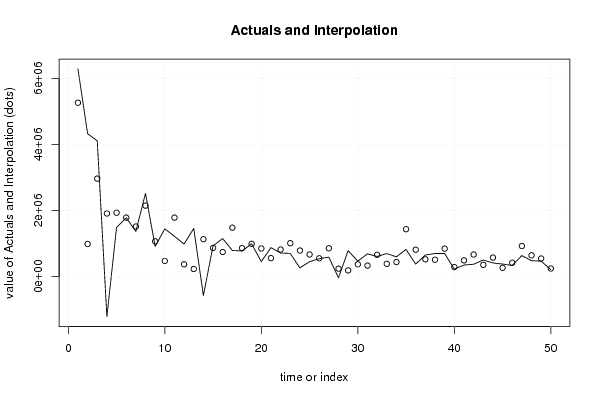
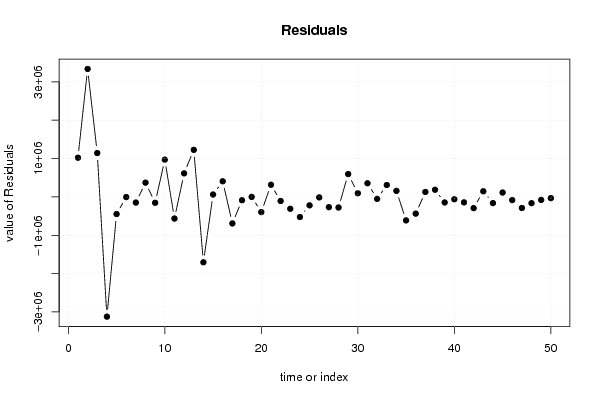
Multiple Linear Regression - Actuals, Interpolation, and Residuals
Time or IndexActualsInterpolationForecastResidualsPrediction Error
162829295260259.753710441022669.24628956
24324047987234.1493620233336812.85063798
341082722964734.580563451143537.41943655
4-12126171909277.08721999-3121894.08721999
514853291931907.68163525-446578.681635252
617798761784292.63561575-4416.63561574885
713672031514561.87770431-147358.877704313
825190762146253.73750155372822.262498454
99126841065717.87653985-153033.876539853
101443586471654.555211046971931.444788954
1112200171784359.45889780-564342.458897803
12984885370708.200666769614176.799333231
131457425229467.0694858521227957.93051415
14-5729201131914.39998605-1704834.39998605
15929144866506.00195154662637.9980484542
161151176743741.482584666407434.517415334
177900901481234.15288781-691144.15288781
18774497860532.346994978-86035.3469949775
19990576990655.58317345-79.583173450461
20454195850508.046470685-396313.046470685
21876607558524.791194374318082.208805626
22711969817615.720557757-105646.720557757
237023801011199.75464848-308819.754648477
24264449788213.278763628-523764.278763628
25450033669219.777202197-219186.777202197
26541063553827.237267971-12764.2372679711
27588864856402.982134945-267538.982134945
28-37216238617.071471440-275833.071471440
29783310187521.254858521595788.745141479
30467359371662.68180526595696.3181947352
31688779332706.689689186356072.310310814
32608419658759.037877714-50340.0378777138
33696348386243.939315873310104.060684127
34597793439415.481697454158377.518302546
358217301433785.04421903-612055.044219029
36377934813408.037672894-435474.037672894
37651939522586.945759953129352.054240047
38697458509776.111948998187681.888051002
39700368844710.197265502-144342.197265502
40225986286696.109338281-60710.1093382805
41348695490890.052802516-142195.052802516
42373683667031.956938051-293348.956938051
43501709354847.427894736146861.572105264
44413743574247.434951195-160504.434951195
45379825265480.157138787114344.842861213
46336260418892.833142698-82632.8331426981
47636765924979.609921747-288214.609921747
48481231644531.66585773-163300.665857730
49469107546613.479365427-77506.4793654269
50211928244060.559134379-32132.559134379

\begin{tabular}{lllllllll}
\hline
Multiple Linear Regression - Actuals, Interpolation, and Residuals \tabularnewline
Time or Index & Actuals & InterpolationForecast & ResidualsPrediction Error \tabularnewline
1 & 6282929 & 5260259.75371044 & 1022669.24628956 \tabularnewline
2 & 4324047 & 987234.149362023 & 3336812.85063798 \tabularnewline
3 & 4108272 & 2964734.58056345 & 1143537.41943655 \tabularnewline
4 & -1212617 & 1909277.08721999 & -3121894.08721999 \tabularnewline
5 & 1485329 & 1931907.68163525 & -446578.681635252 \tabularnewline
6 & 1779876 & 1784292.63561575 & -4416.63561574885 \tabularnewline
7 & 1367203 & 1514561.87770431 & -147358.877704313 \tabularnewline
8 & 2519076 & 2146253.73750155 & 372822.262498454 \tabularnewline
9 & 912684 & 1065717.87653985 & -153033.876539853 \tabularnewline
10 & 1443586 & 471654.555211046 & 971931.444788954 \tabularnewline
11 & 1220017 & 1784359.45889780 & -564342.458897803 \tabularnewline
12 & 984885 & 370708.200666769 & 614176.799333231 \tabularnewline
13 & 1457425 & 229467.069485852 & 1227957.93051415 \tabularnewline
14 & -572920 & 1131914.39998605 & -1704834.39998605 \tabularnewline
15 & 929144 & 866506.001951546 & 62637.9980484542 \tabularnewline
16 & 1151176 & 743741.482584666 & 407434.517415334 \tabularnewline
17 & 790090 & 1481234.15288781 & -691144.15288781 \tabularnewline
18 & 774497 & 860532.346994978 & -86035.3469949775 \tabularnewline
19 & 990576 & 990655.58317345 & -79.583173450461 \tabularnewline
20 & 454195 & 850508.046470685 & -396313.046470685 \tabularnewline
21 & 876607 & 558524.791194374 & 318082.208805626 \tabularnewline
22 & 711969 & 817615.720557757 & -105646.720557757 \tabularnewline
23 & 702380 & 1011199.75464848 & -308819.754648477 \tabularnewline
24 & 264449 & 788213.278763628 & -523764.278763628 \tabularnewline
25 & 450033 & 669219.777202197 & -219186.777202197 \tabularnewline
26 & 541063 & 553827.237267971 & -12764.2372679711 \tabularnewline
27 & 588864 & 856402.982134945 & -267538.982134945 \tabularnewline
28 & -37216 & 238617.071471440 & -275833.071471440 \tabularnewline
29 & 783310 & 187521.254858521 & 595788.745141479 \tabularnewline
30 & 467359 & 371662.681805265 & 95696.3181947352 \tabularnewline
31 & 688779 & 332706.689689186 & 356072.310310814 \tabularnewline
32 & 608419 & 658759.037877714 & -50340.0378777138 \tabularnewline
33 & 696348 & 386243.939315873 & 310104.060684127 \tabularnewline
34 & 597793 & 439415.481697454 & 158377.518302546 \tabularnewline
35 & 821730 & 1433785.04421903 & -612055.044219029 \tabularnewline
36 & 377934 & 813408.037672894 & -435474.037672894 \tabularnewline
37 & 651939 & 522586.945759953 & 129352.054240047 \tabularnewline
38 & 697458 & 509776.111948998 & 187681.888051002 \tabularnewline
39 & 700368 & 844710.197265502 & -144342.197265502 \tabularnewline
40 & 225986 & 286696.109338281 & -60710.1093382805 \tabularnewline
41 & 348695 & 490890.052802516 & -142195.052802516 \tabularnewline
42 & 373683 & 667031.956938051 & -293348.956938051 \tabularnewline
43 & 501709 & 354847.427894736 & 146861.572105264 \tabularnewline
44 & 413743 & 574247.434951195 & -160504.434951195 \tabularnewline
45 & 379825 & 265480.157138787 & 114344.842861213 \tabularnewline
46 & 336260 & 418892.833142698 & -82632.8331426981 \tabularnewline
47 & 636765 & 924979.609921747 & -288214.609921747 \tabularnewline
48 & 481231 & 644531.66585773 & -163300.665857730 \tabularnewline
49 & 469107 & 546613.479365427 & -77506.4793654269 \tabularnewline
50 & 211928 & 244060.559134379 & -32132.559134379 \tabularnewline
\hline
\end{tabular}
%Source: https://freestatistics.org/blog/index.php?pk=114741&T=4

[TABLE]
[ROW][C]Multiple Linear Regression - Actuals, Interpolation, and Residuals[/C][/ROW]
[ROW][C]Time or Index[/C][C]Actuals[/C][C]InterpolationForecast[/C][C]ResidualsPrediction Error[/C][/ROW]
[ROW][C]1[/C][C]6282929[/C][C]5260259.75371044[/C][C]1022669.24628956[/C][/ROW]
[ROW][C]2[/C][C]4324047[/C][C]987234.149362023[/C][C]3336812.85063798[/C][/ROW]
[ROW][C]3[/C][C]4108272[/C][C]2964734.58056345[/C][C]1143537.41943655[/C][/ROW]
[ROW][C]4[/C][C]-1212617[/C][C]1909277.08721999[/C][C]-3121894.08721999[/C][/ROW]
[ROW][C]5[/C][C]1485329[/C][C]1931907.68163525[/C][C]-446578.681635252[/C][/ROW]
[ROW][C]6[/C][C]1779876[/C][C]1784292.63561575[/C][C]-4416.63561574885[/C][/ROW]
[ROW][C]7[/C][C]1367203[/C][C]1514561.87770431[/C][C]-147358.877704313[/C][/ROW]
[ROW][C]8[/C][C]2519076[/C][C]2146253.73750155[/C][C]372822.262498454[/C][/ROW]
[ROW][C]9[/C][C]912684[/C][C]1065717.87653985[/C][C]-153033.876539853[/C][/ROW]
[ROW][C]10[/C][C]1443586[/C][C]471654.555211046[/C][C]971931.444788954[/C][/ROW]
[ROW][C]11[/C][C]1220017[/C][C]1784359.45889780[/C][C]-564342.458897803[/C][/ROW]
[ROW][C]12[/C][C]984885[/C][C]370708.200666769[/C][C]614176.799333231[/C][/ROW]
[ROW][C]13[/C][C]1457425[/C][C]229467.069485852[/C][C]1227957.93051415[/C][/ROW]
[ROW][C]14[/C][C]-572920[/C][C]1131914.39998605[/C][C]-1704834.39998605[/C][/ROW]
[ROW][C]15[/C][C]929144[/C][C]866506.001951546[/C][C]62637.9980484542[/C][/ROW]
[ROW][C]16[/C][C]1151176[/C][C]743741.482584666[/C][C]407434.517415334[/C][/ROW]
[ROW][C]17[/C][C]790090[/C][C]1481234.15288781[/C][C]-691144.15288781[/C][/ROW]
[ROW][C]18[/C][C]774497[/C][C]860532.346994978[/C][C]-86035.3469949775[/C][/ROW]
[ROW][C]19[/C][C]990576[/C][C]990655.58317345[/C][C]-79.583173450461[/C][/ROW]
[ROW][C]20[/C][C]454195[/C][C]850508.046470685[/C][C]-396313.046470685[/C][/ROW]
[ROW][C]21[/C][C]876607[/C][C]558524.791194374[/C][C]318082.208805626[/C][/ROW]
[ROW][C]22[/C][C]711969[/C][C]817615.720557757[/C][C]-105646.720557757[/C][/ROW]
[ROW][C]23[/C][C]702380[/C][C]1011199.75464848[/C][C]-308819.754648477[/C][/ROW]
[ROW][C]24[/C][C]264449[/C][C]788213.278763628[/C][C]-523764.278763628[/C][/ROW]
[ROW][C]25[/C][C]450033[/C][C]669219.777202197[/C][C]-219186.777202197[/C][/ROW]
[ROW][C]26[/C][C]541063[/C][C]553827.237267971[/C][C]-12764.2372679711[/C][/ROW]
[ROW][C]27[/C][C]588864[/C][C]856402.982134945[/C][C]-267538.982134945[/C][/ROW]
[ROW][C]28[/C][C]-37216[/C][C]238617.071471440[/C][C]-275833.071471440[/C][/ROW]
[ROW][C]29[/C][C]783310[/C][C]187521.254858521[/C][C]595788.745141479[/C][/ROW]
[ROW][C]30[/C][C]467359[/C][C]371662.681805265[/C][C]95696.3181947352[/C][/ROW]
[ROW][C]31[/C][C]688779[/C][C]332706.689689186[/C][C]356072.310310814[/C][/ROW]
[ROW][C]32[/C][C]608419[/C][C]658759.037877714[/C][C]-50340.0378777138[/C][/ROW]
[ROW][C]33[/C][C]696348[/C][C]386243.939315873[/C][C]310104.060684127[/C][/ROW]
[ROW][C]34[/C][C]597793[/C][C]439415.481697454[/C][C]158377.518302546[/C][/ROW]
[ROW][C]35[/C][C]821730[/C][C]1433785.04421903[/C][C]-612055.044219029[/C][/ROW]
[ROW][C]36[/C][C]377934[/C][C]813408.037672894[/C][C]-435474.037672894[/C][/ROW]
[ROW][C]37[/C][C]651939[/C][C]522586.945759953[/C][C]129352.054240047[/C][/ROW]
[ROW][C]38[/C][C]697458[/C][C]509776.111948998[/C][C]187681.888051002[/C][/ROW]
[ROW][C]39[/C][C]700368[/C][C]844710.197265502[/C][C]-144342.197265502[/C][/ROW]
[ROW][C]40[/C][C]225986[/C][C]286696.109338281[/C][C]-60710.1093382805[/C][/ROW]
[ROW][C]41[/C][C]348695[/C][C]490890.052802516[/C][C]-142195.052802516[/C][/ROW]
[ROW][C]42[/C][C]373683[/C][C]667031.956938051[/C][C]-293348.956938051[/C][/ROW]
[ROW][C]43[/C][C]501709[/C][C]354847.427894736[/C][C]146861.572105264[/C][/ROW]
[ROW][C]44[/C][C]413743[/C][C]574247.434951195[/C][C]-160504.434951195[/C][/ROW]
[ROW][C]45[/C][C]379825[/C][C]265480.157138787[/C][C]114344.842861213[/C][/ROW]
[ROW][C]46[/C][C]336260[/C][C]418892.833142698[/C][C]-82632.8331426981[/C][/ROW]
[ROW][C]47[/C][C]636765[/C][C]924979.609921747[/C][C]-288214.609921747[/C][/ROW]
[ROW][C]48[/C][C]481231[/C][C]644531.66585773[/C][C]-163300.665857730[/C][/ROW]
[ROW][C]49[/C][C]469107[/C][C]546613.479365427[/C][C]-77506.4793654269[/C][/ROW]
[ROW][C]50[/C][C]211928[/C][C]244060.559134379[/C][C]-32132.559134379[/C][/ROW]
[/TABLE]
Source: https://freestatistics.org/blog/index.php?pk=114741&T=4

Globally Unique Identifier (entire table): ba.freestatistics.org/blog/index.php?pk=114741&T=4

As an alternative you can also use a QR Code:  

The GUIDs for individual cells are displayed in the table below:

Multiple Linear Regression - Actuals, Interpolation, and Residuals
Time or IndexActualsInterpolationForecastResidualsPrediction Error
162829295260259.753710441022669.24628956
24324047987234.1493620233336812.85063798
341082722964734.580563451143537.41943655
4-12126171909277.08721999-3121894.08721999
514853291931907.68163525-446578.681635252
617798761784292.63561575-4416.63561574885
713672031514561.87770431-147358.877704313
825190762146253.73750155372822.262498454
99126841065717.87653985-153033.876539853
101443586471654.555211046971931.444788954
1112200171784359.45889780-564342.458897803
12984885370708.200666769614176.799333231
131457425229467.0694858521227957.93051415
14-5729201131914.39998605-1704834.39998605
15929144866506.00195154662637.9980484542
161151176743741.482584666407434.517415334
177900901481234.15288781-691144.15288781
18774497860532.346994978-86035.3469949775
19990576990655.58317345-79.583173450461
20454195850508.046470685-396313.046470685
21876607558524.791194374318082.208805626
22711969817615.720557757-105646.720557757
237023801011199.75464848-308819.754648477
24264449788213.278763628-523764.278763628
25450033669219.777202197-219186.777202197
26541063553827.237267971-12764.2372679711
27588864856402.982134945-267538.982134945
28-37216238617.071471440-275833.071471440
29783310187521.254858521595788.745141479
30467359371662.68180526595696.3181947352
31688779332706.689689186356072.310310814
32608419658759.037877714-50340.0378777138
33696348386243.939315873310104.060684127
34597793439415.481697454158377.518302546
358217301433785.04421903-612055.044219029
36377934813408.037672894-435474.037672894
37651939522586.945759953129352.054240047
38697458509776.111948998187681.888051002
39700368844710.197265502-144342.197265502
40225986286696.109338281-60710.1093382805
41348695490890.052802516-142195.052802516
42373683667031.956938051-293348.956938051
43501709354847.427894736146861.572105264
44413743574247.434951195-160504.434951195
45379825265480.157138787114344.842861213
46336260418892.833142698-82632.8331426981
47636765924979.609921747-288214.609921747
48481231644531.66585773-163300.665857730
49469107546613.479365427-77506.4793654269
50211928244060.559134379-32132.559134379


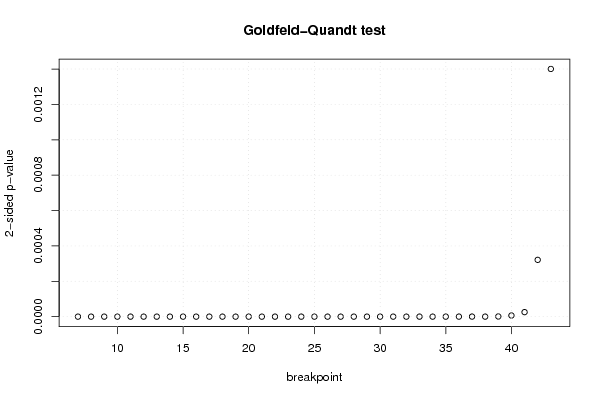
Goldfeld-Quandt test for Heteroskedasticity
p-valuesAlternative Hypothesis
breakpoint indexgreater2-sidedless
70.99999999598428.031599993387e-094.0157999966935e-09
80.9999999999727235.4554394701337e-112.72771973506685e-11
90.9999999998748832.50235015477770e-101.25117507738885e-10
100.999999999975134.97396308670504e-112.48698154335252e-11
110.9999999999949181.01644405554525e-115.08222027772623e-12
120.9999999999893152.13694855513371e-111.06847427756685e-11
130.9999999999997025.95564203285812e-132.97782101642906e-13
1418.54398056652114e-174.27199028326057e-17
1511.61287117539092e-168.06435587695458e-17
1613.35283701050966e-171.67641850525483e-17
1717.28514433037711e-173.64257216518855e-17
1812.65667961995887e-161.32833980997944e-16
1915.45953629383485e-162.72976814691742e-16
200.9999999999999983.31301813495944e-151.65650906747972e-15
210.9999999999999983.73430084398991e-151.86715042199495e-15
220.999999999999991.89370901551996e-149.4685450775998e-15
230.9999999999999441.12319236372707e-135.61596181863533e-14
240.9999999999998383.23248861417049e-131.61624430708524e-13
250.9999999999990541.89219820308593e-129.46099101542965e-13
260.9999999999938761.22481942924936e-116.12409714624678e-12
270.9999999999685386.29236179496501e-113.14618089748251e-11
280.9999999999890762.18477857889081e-111.09238928944541e-11
290.9999999999930361.39278135215315e-116.96390676076577e-12
300.999999999958758.24994804329799e-114.12497402164899e-11
310.9999999998971762.05648437832462e-101.02824218916231e-10
320.999999999409281.18144140057883e-095.90720700289415e-10
330.9999999992499941.50001231948556e-097.5000615974278e-10
340.999999996895056.20990099601257e-093.10495049800629e-09
350.9999999807391433.85217139968214e-081.92608569984107e-08
360.9999999099208961.80158207267686e-079.00791036338429e-08
370.999999833337793.33324420138176e-071.66662210069088e-07
380.9999999345602171.30879567015064e-076.54397835075318e-08
390.9999995012783789.97443244377578e-074.98721622188789e-07
400.999996735245996.52950802144258e-063.26475401072129e-06
410.999987255208482.54895830394685e-051.27447915197342e-05
420.9998394583934470.0003210832131052980.000160541606552649
430.9992998539965460.001400292006908770.000700146003454385

\begin{tabular}{lllllllll}
\hline
Goldfeld-Quandt test for Heteroskedasticity \tabularnewline
p-values & Alternative Hypothesis \tabularnewline
breakpoint index & greater & 2-sided & less \tabularnewline
7 & 0.9999999959842 & 8.031599993387e-09 & 4.0157999966935e-09 \tabularnewline
8 & 0.999999999972723 & 5.4554394701337e-11 & 2.72771973506685e-11 \tabularnewline
9 & 0.999999999874883 & 2.50235015477770e-10 & 1.25117507738885e-10 \tabularnewline
10 & 0.99999999997513 & 4.97396308670504e-11 & 2.48698154335252e-11 \tabularnewline
11 & 0.999999999994918 & 1.01644405554525e-11 & 5.08222027772623e-12 \tabularnewline
12 & 0.999999999989315 & 2.13694855513371e-11 & 1.06847427756685e-11 \tabularnewline
13 & 0.999999999999702 & 5.95564203285812e-13 & 2.97782101642906e-13 \tabularnewline
14 & 1 & 8.54398056652114e-17 & 4.27199028326057e-17 \tabularnewline
15 & 1 & 1.61287117539092e-16 & 8.06435587695458e-17 \tabularnewline
16 & 1 & 3.35283701050966e-17 & 1.67641850525483e-17 \tabularnewline
17 & 1 & 7.28514433037711e-17 & 3.64257216518855e-17 \tabularnewline
18 & 1 & 2.65667961995887e-16 & 1.32833980997944e-16 \tabularnewline
19 & 1 & 5.45953629383485e-16 & 2.72976814691742e-16 \tabularnewline
20 & 0.999999999999998 & 3.31301813495944e-15 & 1.65650906747972e-15 \tabularnewline
21 & 0.999999999999998 & 3.73430084398991e-15 & 1.86715042199495e-15 \tabularnewline
22 & 0.99999999999999 & 1.89370901551996e-14 & 9.4685450775998e-15 \tabularnewline
23 & 0.999999999999944 & 1.12319236372707e-13 & 5.61596181863533e-14 \tabularnewline
24 & 0.999999999999838 & 3.23248861417049e-13 & 1.61624430708524e-13 \tabularnewline
25 & 0.999999999999054 & 1.89219820308593e-12 & 9.46099101542965e-13 \tabularnewline
26 & 0.999999999993876 & 1.22481942924936e-11 & 6.12409714624678e-12 \tabularnewline
27 & 0.999999999968538 & 6.29236179496501e-11 & 3.14618089748251e-11 \tabularnewline
28 & 0.999999999989076 & 2.18477857889081e-11 & 1.09238928944541e-11 \tabularnewline
29 & 0.999999999993036 & 1.39278135215315e-11 & 6.96390676076577e-12 \tabularnewline
30 & 0.99999999995875 & 8.24994804329799e-11 & 4.12497402164899e-11 \tabularnewline
31 & 0.999999999897176 & 2.05648437832462e-10 & 1.02824218916231e-10 \tabularnewline
32 & 0.99999999940928 & 1.18144140057883e-09 & 5.90720700289415e-10 \tabularnewline
33 & 0.999999999249994 & 1.50001231948556e-09 & 7.5000615974278e-10 \tabularnewline
34 & 0.99999999689505 & 6.20990099601257e-09 & 3.10495049800629e-09 \tabularnewline
35 & 0.999999980739143 & 3.85217139968214e-08 & 1.92608569984107e-08 \tabularnewline
36 & 0.999999909920896 & 1.80158207267686e-07 & 9.00791036338429e-08 \tabularnewline
37 & 0.99999983333779 & 3.33324420138176e-07 & 1.66662210069088e-07 \tabularnewline
38 & 0.999999934560217 & 1.30879567015064e-07 & 6.54397835075318e-08 \tabularnewline
39 & 0.999999501278378 & 9.97443244377578e-07 & 4.98721622188789e-07 \tabularnewline
40 & 0.99999673524599 & 6.52950802144258e-06 & 3.26475401072129e-06 \tabularnewline
41 & 0.99998725520848 & 2.54895830394685e-05 & 1.27447915197342e-05 \tabularnewline
42 & 0.999839458393447 & 0.000321083213105298 & 0.000160541606552649 \tabularnewline
43 & 0.999299853996546 & 0.00140029200690877 & 0.000700146003454385 \tabularnewline
\hline
\end{tabular}
%Source: https://freestatistics.org/blog/index.php?pk=114741&T=5

[TABLE]
[ROW][C]Goldfeld-Quandt test for Heteroskedasticity[/C][/ROW]
[ROW][C]p-values[/C][C]Alternative Hypothesis[/C][/ROW]
[ROW][C]breakpoint index[/C][C]greater[/C][C]2-sided[/C][C]less[/C][/ROW]
[ROW][C]7[/C][C]0.9999999959842[/C][C]8.031599993387e-09[/C][C]4.0157999966935e-09[/C][/ROW]
[ROW][C]8[/C][C]0.999999999972723[/C][C]5.4554394701337e-11[/C][C]2.72771973506685e-11[/C][/ROW]
[ROW][C]9[/C][C]0.999999999874883[/C][C]2.50235015477770e-10[/C][C]1.25117507738885e-10[/C][/ROW]
[ROW][C]10[/C][C]0.99999999997513[/C][C]4.97396308670504e-11[/C][C]2.48698154335252e-11[/C][/ROW]
[ROW][C]11[/C][C]0.999999999994918[/C][C]1.01644405554525e-11[/C][C]5.08222027772623e-12[/C][/ROW]
[ROW][C]12[/C][C]0.999999999989315[/C][C]2.13694855513371e-11[/C][C]1.06847427756685e-11[/C][/ROW]
[ROW][C]13[/C][C]0.999999999999702[/C][C]5.95564203285812e-13[/C][C]2.97782101642906e-13[/C][/ROW]
[ROW][C]14[/C][C]1[/C][C]8.54398056652114e-17[/C][C]4.27199028326057e-17[/C][/ROW]
[ROW][C]15[/C][C]1[/C][C]1.61287117539092e-16[/C][C]8.06435587695458e-17[/C][/ROW]
[ROW][C]16[/C][C]1[/C][C]3.35283701050966e-17[/C][C]1.67641850525483e-17[/C][/ROW]
[ROW][C]17[/C][C]1[/C][C]7.28514433037711e-17[/C][C]3.64257216518855e-17[/C][/ROW]
[ROW][C]18[/C][C]1[/C][C]2.65667961995887e-16[/C][C]1.32833980997944e-16[/C][/ROW]
[ROW][C]19[/C][C]1[/C][C]5.45953629383485e-16[/C][C]2.72976814691742e-16[/C][/ROW]
[ROW][C]20[/C][C]0.999999999999998[/C][C]3.31301813495944e-15[/C][C]1.65650906747972e-15[/C][/ROW]
[ROW][C]21[/C][C]0.999999999999998[/C][C]3.73430084398991e-15[/C][C]1.86715042199495e-15[/C][/ROW]
[ROW][C]22[/C][C]0.99999999999999[/C][C]1.89370901551996e-14[/C][C]9.4685450775998e-15[/C][/ROW]
[ROW][C]23[/C][C]0.999999999999944[/C][C]1.12319236372707e-13[/C][C]5.61596181863533e-14[/C][/ROW]
[ROW][C]24[/C][C]0.999999999999838[/C][C]3.23248861417049e-13[/C][C]1.61624430708524e-13[/C][/ROW]
[ROW][C]25[/C][C]0.999999999999054[/C][C]1.89219820308593e-12[/C][C]9.46099101542965e-13[/C][/ROW]
[ROW][C]26[/C][C]0.999999999993876[/C][C]1.22481942924936e-11[/C][C]6.12409714624678e-12[/C][/ROW]
[ROW][C]27[/C][C]0.999999999968538[/C][C]6.29236179496501e-11[/C][C]3.14618089748251e-11[/C][/ROW]
[ROW][C]28[/C][C]0.999999999989076[/C][C]2.18477857889081e-11[/C][C]1.09238928944541e-11[/C][/ROW]
[ROW][C]29[/C][C]0.999999999993036[/C][C]1.39278135215315e-11[/C][C]6.96390676076577e-12[/C][/ROW]
[ROW][C]30[/C][C]0.99999999995875[/C][C]8.24994804329799e-11[/C][C]4.12497402164899e-11[/C][/ROW]
[ROW][C]31[/C][C]0.999999999897176[/C][C]2.05648437832462e-10[/C][C]1.02824218916231e-10[/C][/ROW]
[ROW][C]32[/C][C]0.99999999940928[/C][C]1.18144140057883e-09[/C][C]5.90720700289415e-10[/C][/ROW]
[ROW][C]33[/C][C]0.999999999249994[/C][C]1.50001231948556e-09[/C][C]7.5000615974278e-10[/C][/ROW]
[ROW][C]34[/C][C]0.99999999689505[/C][C]6.20990099601257e-09[/C][C]3.10495049800629e-09[/C][/ROW]
[ROW][C]35[/C][C]0.999999980739143[/C][C]3.85217139968214e-08[/C][C]1.92608569984107e-08[/C][/ROW]
[ROW][C]36[/C][C]0.999999909920896[/C][C]1.80158207267686e-07[/C][C]9.00791036338429e-08[/C][/ROW]
[ROW][C]37[/C][C]0.99999983333779[/C][C]3.33324420138176e-07[/C][C]1.66662210069088e-07[/C][/ROW]
[ROW][C]38[/C][C]0.999999934560217[/C][C]1.30879567015064e-07[/C][C]6.54397835075318e-08[/C][/ROW]
[ROW][C]39[/C][C]0.999999501278378[/C][C]9.97443244377578e-07[/C][C]4.98721622188789e-07[/C][/ROW]
[ROW][C]40[/C][C]0.99999673524599[/C][C]6.52950802144258e-06[/C][C]3.26475401072129e-06[/C][/ROW]
[ROW][C]41[/C][C]0.99998725520848[/C][C]2.54895830394685e-05[/C][C]1.27447915197342e-05[/C][/ROW]
[ROW][C]42[/C][C]0.999839458393447[/C][C]0.000321083213105298[/C][C]0.000160541606552649[/C][/ROW]
[ROW][C]43[/C][C]0.999299853996546[/C][C]0.00140029200690877[/C][C]0.000700146003454385[/C][/ROW]
[/TABLE]
Source: https://freestatistics.org/blog/index.php?pk=114741&T=5

Globally Unique Identifier (entire table): ba.freestatistics.org/blog/index.php?pk=114741&T=5

As an alternative you can also use a QR Code:  

The GUIDs for individual cells are displayed in the table below:

Goldfeld-Quandt test for Heteroskedasticity
p-valuesAlternative Hypothesis
breakpoint indexgreater2-sidedless
70.99999999598428.031599993387e-094.0157999966935e-09
80.9999999999727235.4554394701337e-112.72771973506685e-11
90.9999999998748832.50235015477770e-101.25117507738885e-10
100.999999999975134.97396308670504e-112.48698154335252e-11
110.9999999999949181.01644405554525e-115.08222027772623e-12
120.9999999999893152.13694855513371e-111.06847427756685e-11
130.9999999999997025.95564203285812e-132.97782101642906e-13
1418.54398056652114e-174.27199028326057e-17
1511.61287117539092e-168.06435587695458e-17
1613.35283701050966e-171.67641850525483e-17
1717.28514433037711e-173.64257216518855e-17
1812.65667961995887e-161.32833980997944e-16
1915.45953629383485e-162.72976814691742e-16
200.9999999999999983.31301813495944e-151.65650906747972e-15
210.9999999999999983.73430084398991e-151.86715042199495e-15
220.999999999999991.89370901551996e-149.4685450775998e-15
230.9999999999999441.12319236372707e-135.61596181863533e-14
240.9999999999998383.23248861417049e-131.61624430708524e-13
250.9999999999990541.89219820308593e-129.46099101542965e-13
260.9999999999938761.22481942924936e-116.12409714624678e-12
270.9999999999685386.29236179496501e-113.14618089748251e-11
280.9999999999890762.18477857889081e-111.09238928944541e-11
290.9999999999930361.39278135215315e-116.96390676076577e-12
300.999999999958758.24994804329799e-114.12497402164899e-11
310.9999999998971762.05648437832462e-101.02824218916231e-10
320.999999999409281.18144140057883e-095.90720700289415e-10
330.9999999992499941.50001231948556e-097.5000615974278e-10
340.999999996895056.20990099601257e-093.10495049800629e-09
350.9999999807391433.85217139968214e-081.92608569984107e-08
360.9999999099208961.80158207267686e-079.00791036338429e-08
370.999999833337793.33324420138176e-071.66662210069088e-07
380.9999999345602171.30879567015064e-076.54397835075318e-08
390.9999995012783789.97443244377578e-074.98721622188789e-07
400.999996735245996.52950802144258e-063.26475401072129e-06
410.999987255208482.54895830394685e-051.27447915197342e-05
420.9998394583934470.0003210832131052980.000160541606552649
430.9992998539965460.001400292006908770.000700146003454385


Meta Analysis of Goldfeld-Quandt test for Heteroskedasticity
Description# significant tests% significant testsOK/NOK
1% type I error level371NOK
5% type I error level371NOK
10% type I error level371NOK

\begin{tabular}{lllllllll}
\hline
Meta Analysis of Goldfeld-Quandt test for Heteroskedasticity \tabularnewline
Description & # significant tests & % significant tests & OK/NOK \tabularnewline
1% type I error level & 37 & 1 & NOK \tabularnewline
5% type I error level & 37 & 1 & NOK \tabularnewline
10% type I error level & 37 & 1 & NOK \tabularnewline
\hline
\end{tabular}
%Source: https://freestatistics.org/blog/index.php?pk=114741&T=6

[TABLE]
[ROW][C]Meta Analysis of Goldfeld-Quandt test for Heteroskedasticity[/C][/ROW]
[ROW][C]Description[/C][C]# significant tests[/C][C]% significant tests[/C][C]OK/NOK[/C][/ROW]
[ROW][C]1% type I error level[/C][C]37[/C][C]1[/C][C]NOK[/C][/ROW]
[ROW][C]5% type I error level[/C][C]37[/C][C]1[/C][C]NOK[/C][/ROW]
[ROW][C]10% type I error level[/C][C]37[/C][C]1[/C][C]NOK[/C][/ROW]
[/TABLE]
Source: https://freestatistics.org/blog/index.php?pk=114741&T=6

Globally Unique Identifier (entire table): ba.freestatistics.org/blog/index.php?pk=114741&T=6

As an alternative you can also use a QR Code:  

The GUIDs for individual cells are displayed in the table below:

Meta Analysis of Goldfeld-Quandt test for Heteroskedasticity
Description# significant tests% significant testsOK/NOK
1% type I error level371NOK
5% type I error level371NOK
10% type I error level371NOK


Parameters (Session):
par1 = 1 ; par2 = Do not include Seasonal Dummies ; par3 = No Linear Trend ;
Parameters (R input):
par1 = 1 ; par2 = Do not include Seasonal Dummies ; par3 = No Linear Trend ;
R code (references can be found in the software module):
library(lattice)
library(lmtest)
n25 <- 25 #minimum number of obs. for Goldfeld-Quandt test
par1 <- as.numeric(par1)
x <- t(y)
k <- length(x[1,])
n <- length(x[,1])
x1 <- cbind(x[,par1], x[,1:k!=par1])
mycolnames <- c(colnames(x)[par1], colnames(x)[1:k!=par1])
colnames(x1) <- mycolnames #colnames(x)[par1]
x <- x1
if (par3 == 'First Differences'){
x2 <- array(0, dim=c(n-1,k), dimnames=list(1:(n-1), paste('(1-B)',colnames(x),sep='')))
for (i in 1:n-1) {
for (j in 1:k) {
x2[i,j] <- x[i+1,j] - x[i,j]
}
}
x <- x2
}
if (par2 == 'Include Monthly Dummies'){
x2 <- array(0, dim=c(n,11), dimnames=list(1:n, paste('M', seq(1:11), sep ='')))
for (i in 1:11){
x2[seq(i,n,12),i] <- 1
}
x <- cbind(x, x2)
}
if (par2 == 'Include Quarterly Dummies'){
x2 <- array(0, dim=c(n,3), dimnames=list(1:n, paste('Q', seq(1:3), sep ='')))
for (i in 1:3){
x2[seq(i,n,4),i] <- 1
}
x <- cbind(x, x2)
}
k <- length(x[1,])
if (par3 == 'Linear Trend'){
x <- cbind(x, c(1:n))
colnames(x)[k+1] <- 't'
}
x
k <- length(x[1,])
df <- as.data.frame(x)
(mylm <- lm(df))
(mysum <- summary(mylm))
if (n > n25) {
kp3 <- k + 3
nmkm3 <- n - k - 3
gqarr <- array(NA, dim=c(nmkm3-kp3+1,3))
numgqtests <- 0
numsignificant1 <- 0
numsignificant5 <- 0
numsignificant10 <- 0
for (mypoint in kp3:nmkm3) {
j <- 0
numgqtests <- numgqtests + 1
for (myalt in c('greater', 'two.sided', 'less')) {
j <- j + 1
gqarr[mypoint-kp3+1,j] <- gqtest(mylm, point=mypoint, alternative=myalt)$p.value
}
if (gqarr[mypoint-kp3+1,2] < 0.01) numsignificant1 <- numsignificant1 + 1
if (gqarr[mypoint-kp3+1,2] < 0.05) numsignificant5 <- numsignificant5 + 1
if (gqarr[mypoint-kp3+1,2] < 0.10) numsignificant10 <- numsignificant10 + 1
}
gqarr
}
bitmap(file='test0.png')
plot(x[,1], type='l', main='Actuals and Interpolation', ylab='value of Actuals and Interpolation (dots)', xlab='time or index')
points(x[,1]-mysum$resid)
grid()
dev.off()
bitmap(file='test1.png')
plot(mysum$resid, type='b', pch=19, main='Residuals', ylab='value of Residuals', xlab='time or index')
grid()
dev.off()
bitmap(file='test2.png')
hist(mysum$resid, main='Residual Histogram', xlab='values of Residuals')
grid()
dev.off()
bitmap(file='test3.png')
densityplot(~mysum$resid,col='black',main='Residual Density Plot', xlab='values of Residuals')
dev.off()
bitmap(file='test4.png')
qqnorm(mysum$resid, main='Residual Normal Q-Q Plot')
qqline(mysum$resid)
grid()
dev.off()
(myerror <- as.ts(mysum$resid))
bitmap(file='test5.png')
dum <- cbind(lag(myerror,k=1),myerror)
dum
dum1 <- dum[2:length(myerror),]
dum1
z <- as.data.frame(dum1)
z
plot(z,main=paste('Residual Lag plot, lowess, and regression line'), ylab='values of Residuals', xlab='lagged values of Residuals')
lines(lowess(z))
abline(lm(z))
grid()
dev.off()
bitmap(file='test6.png')
acf(mysum$resid, lag.max=length(mysum$resid)/2, main='Residual Autocorrelation Function')
grid()
dev.off()
bitmap(file='test7.png')
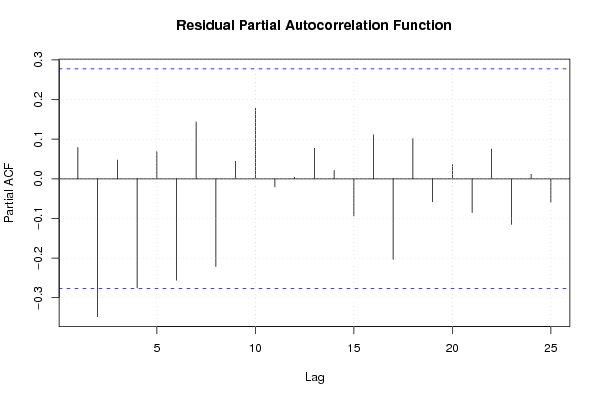
pacf(mysum$resid, lag.max=length(mysum$resid)/2, main='Residual Partial Autocorrelation Function')
grid()
dev.off()
bitmap(file='test8.png')
opar <- par(mfrow = c(2,2), oma = c(0, 0, 1.1, 0))
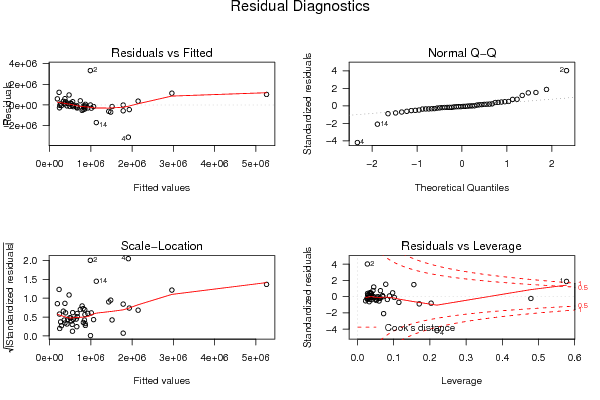
plot(mylm, las = 1, sub='Residual Diagnostics')
par(opar)
dev.off()
if (n > n25) {
bitmap(file='test9.png')
plot(kp3:nmkm3,gqarr[,2], main='Goldfeld-Quandt test',ylab='2-sided p-value',xlab='breakpoint')
grid()
dev.off()
}
load(file='createtable')
a<-table.start()
a<-table.row.start(a)
a<-table.element(a, 'Multiple Linear Regression - Estimated Regression Equation', 1, TRUE)
a<-table.row.end(a)
myeq <- colnames(x)[1]
myeq <- paste(myeq, '[t] = ', sep='')
for (i in 1:k){
if (mysum$coefficients[i,1] > 0) myeq <- paste(myeq, '+', '')
myeq <- paste(myeq, mysum$coefficients[i,1], sep=' ')
if (rownames(mysum$coefficients)[i] != '(Intercept)') {
myeq <- paste(myeq, rownames(mysum$coefficients)[i], sep='')
if (rownames(mysum$coefficients)[i] != 't') myeq <- paste(myeq, '[t]', sep='')
}
}
myeq <- paste(myeq, ' + e[t]')
a<-table.row.start(a)
a<-table.element(a, myeq)
a<-table.row.end(a)
a<-table.end(a)
table.save(a,file='mytable1.tab')
a<-table.start()
a<-table.row.start(a)
a<-table.element(a,hyperlink('ols1.htm','Multiple Linear Regression - Ordinary Least Squares',''), 6, TRUE)
a<-table.row.end(a)
a<-table.row.start(a)
a<-table.element(a,'Variable',header=TRUE)
a<-table.element(a,'Parameter',header=TRUE)
a<-table.element(a,'S.D.',header=TRUE)
a<-table.element(a,'T-STAT
H0: parameter = 0',header=TRUE)
a<-table.element(a,'2-tail p-value',header=TRUE)
a<-table.element(a,'1-tail p-value',header=TRUE)
a<-table.row.end(a)
for (i in 1:k){
a<-table.row.start(a)
a<-table.element(a,rownames(mysum$coefficients)[i],header=TRUE)
a<-table.element(a,mysum$coefficients[i,1])
a<-table.element(a, round(mysum$coefficients[i,2],6))
a<-table.element(a, round(mysum$coefficients[i,3],4))
a<-table.element(a, round(mysum$coefficients[i,4],6))
a<-table.element(a, round(mysum$coefficients[i,4]/2,6))
a<-table.row.end(a)
}
a<-table.end(a)
table.save(a,file='mytable2.tab')
a<-table.start()
a<-table.row.start(a)
a<-table.element(a, 'Multiple Linear Regression - Regression Statistics', 2, TRUE)
a<-table.row.end(a)
a<-table.row.start(a)
a<-table.element(a, 'Multiple R',1,TRUE)
a<-table.element(a, sqrt(mysum$r.squared))
a<-table.row.end(a)
a<-table.row.start(a)
a<-table.element(a, 'R-squared',1,TRUE)
a<-table.element(a, mysum$r.squared)
a<-table.row.end(a)
a<-table.row.start(a)
a<-table.element(a, 'Adjusted R-squared',1,TRUE)
a<-table.element(a, mysum$adj.r.squared)
a<-table.row.end(a)
a<-table.row.start(a)
a<-table.element(a, 'F-TEST (value)',1,TRUE)
a<-table.element(a, mysum$fstatistic[1])
a<-table.row.end(a)
a<-table.row.start(a)
a<-table.element(a, 'F-TEST (DF numerator)',1,TRUE)
a<-table.element(a, mysum$fstatistic[2])
a<-table.row.end(a)
a<-table.row.start(a)
a<-table.element(a, 'F-TEST (DF denominator)',1,TRUE)
a<-table.element(a, mysum$fstatistic[3])
a<-table.row.end(a)
a<-table.row.start(a)
a<-table.element(a, 'p-value',1,TRUE)
a<-table.element(a, 1-pf(mysum$fstatistic[1],mysum$fstatistic[2],mysum$fstatistic[3]))
a<-table.row.end(a)
a<-table.row.start(a)
a<-table.element(a, 'Multiple Linear Regression - Residual Statistics', 2, TRUE)
a<-table.row.end(a)
a<-table.row.start(a)
a<-table.element(a, 'Residual Standard Deviation',1,TRUE)
a<-table.element(a, mysum$sigma)
a<-table.row.end(a)
a<-table.row.start(a)
a<-table.element(a, 'Sum Squared Residuals',1,TRUE)
a<-table.element(a, sum(myerror*myerror))
a<-table.row.end(a)
a<-table.end(a)
table.save(a,file='mytable3.tab')
a<-table.start()
a<-table.row.start(a)
a<-table.element(a, 'Multiple Linear Regression - Actuals, Interpolation, and Residuals', 4, TRUE)
a<-table.row.end(a)
a<-table.row.start(a)
a<-table.element(a, 'Time or Index', 1, TRUE)
a<-table.element(a, 'Actuals', 1, TRUE)
a<-table.element(a, 'Interpolation
Forecast', 1, TRUE)
a<-table.element(a, 'Residuals
Prediction Error', 1, TRUE)
a<-table.row.end(a)
for (i in 1:n) {
a<-table.row.start(a)
a<-table.element(a,i, 1, TRUE)
a<-table.element(a,x[i])
a<-table.element(a,x[i]-mysum$resid[i])
a<-table.element(a,mysum$resid[i])
a<-table.row.end(a)
}
a<-table.end(a)
table.save(a,file='mytable4.tab')
if (n > n25) {
a<-table.start()
a<-table.row.start(a)
a<-table.element(a,'Goldfeld-Quandt test for Heteroskedasticity',4,TRUE)
a<-table.row.end(a)
a<-table.row.start(a)
a<-table.element(a,'p-values',header=TRUE)
a<-table.element(a,'Alternative Hypothesis',3,header=TRUE)
a<-table.row.end(a)
a<-table.row.start(a)
a<-table.element(a,'breakpoint index',header=TRUE)
a<-table.element(a,'greater',header=TRUE)
a<-table.element(a,'2-sided',header=TRUE)
a<-table.element(a,'less',header=TRUE)
a<-table.row.end(a)
for (mypoint in kp3:nmkm3) {
a<-table.row.start(a)
a<-table.element(a,mypoint,header=TRUE)
a<-table.element(a,gqarr[mypoint-kp3+1,1])
a<-table.element(a,gqarr[mypoint-kp3+1,2])
a<-table.element(a,gqarr[mypoint-kp3+1,3])
a<-table.row.end(a)
}
a<-table.end(a)
table.save(a,file='mytable5.tab')
a<-table.start()
a<-table.row.start(a)
a<-table.element(a,'Meta Analysis of Goldfeld-Quandt test for Heteroskedasticity',4,TRUE)
a<-table.row.end(a)
a<-table.row.start(a)
a<-table.element(a,'Description',header=TRUE)
a<-table.element(a,'# significant tests',header=TRUE)
a<-table.element(a,'% significant tests',header=TRUE)
a<-table.element(a,'OK/NOK',header=TRUE)
a<-table.row.end(a)
a<-table.row.start(a)
a<-table.element(a,'1% type I error level',header=TRUE)
a<-table.element(a,numsignificant1)
a<-table.element(a,numsignificant1/numgqtests)
if (numsignificant1/numgqtests < 0.01) dum <- 'OK' else dum <- 'NOK'
a<-table.element(a,dum)
a<-table.row.end(a)
a<-table.row.start(a)
a<-table.element(a,'5% type I error level',header=TRUE)
a<-table.element(a,numsignificant5)
a<-table.element(a,numsignificant5/numgqtests)
if (numsignificant5/numgqtests < 0.05) dum <- 'OK' else dum <- 'NOK'
a<-table.element(a,dum)
a<-table.row.end(a)
a<-table.row.start(a)
a<-table.element(a,'10% type I error level',header=TRUE)
a<-table.element(a,numsignificant10)
a<-table.element(a,numsignificant10/numgqtests)
if (numsignificant10/numgqtests < 0.1) dum <- 'OK' else dum <- 'NOK'
a<-table.element(a,dum)
a<-table.row.end(a)
a<-table.end(a)
table.save(a,file='mytable6.tab')
}