| Multiple Linear Regression - Estimated Regression Equation |
| werkloosheid[t] = + 602.685897435897 + 84.275641025641X[t] -23.588141025641M1[t] -22.0544871794872M2[t] -15.6490384615385M3[t] -18.0435897435897M4[t] -25.838141025641M5[t] -28.4326923076923M6[t] -39.0272435897436M7[t] -33.2217948717949M8[t] + 21.1836538461539M9[t] + 30.5891025641026M10[t] + 17.1945512820513M11[t] -2.40544871794872t + e[t] |
| Multiple Linear Regression - Ordinary Least Squares | |||||
| Variable | Parameter | S.D. | T-STAT H0: parameter = 0 | 2-tail p-value | 1-tail p-value |
| (Intercept) | 602.685897435897 | 15.2911 | 39.4142 | 0 | 0 |
| X | 84.275641025641 | 13.810657 | 6.1022 | 0 | 0 |
| M1 | -23.588141025641 | 16.343373 | -1.4433 | 0.155573 | 0.077786 |
| M2 | -22.0544871794872 | 17.184701 | -1.2834 | 0.205651 | 0.102826 |
| M3 | -15.6490384615385 | 17.100071 | -0.9151 | 0.364787 | 0.182394 |
| M4 | -18.0435897435897 | 17.023993 | -1.0599 | 0.29461 | 0.147305 |
| M5 | -25.838141025641 | 16.956581 | -1.5238 | 0.134264 | 0.067132 |
| M6 | -28.4326923076923 | 16.89794 | -1.6826 | 0.099083 | 0.049541 |
| M7 | -39.0272435897436 | 16.848162 | -2.3164 | 0.024945 | 0.012473 |
| M8 | -33.2217948717949 | 16.807324 | -1.9766 | 0.053968 | 0.026984 |
| M9 | 21.1836538461539 | 16.775493 | 1.2628 | 0.2129 | 0.10645 |
| M10 | 30.5891025641026 | 16.752719 | 1.8259 | 0.074219 | 0.03711 |
| M11 | 17.1945512820513 | 16.73904 | 1.0272 | 0.309578 | 0.154789 |
| t | -2.40544871794872 | 0.390784 | -6.1554 | 0 | 0 |
| Multiple Linear Regression - Regression Statistics | |
| Multiple R | 0.771536397422824 |
| R-squared | 0.59526841254819 |
| Adjusted R-squared | 0.483321377721094 |
| F-TEST (value) | 5.31741116205168 |
| F-TEST (DF numerator) | 13 |
| F-TEST (DF denominator) | 47 |
| p-value | 9.67196184298302e-06 |
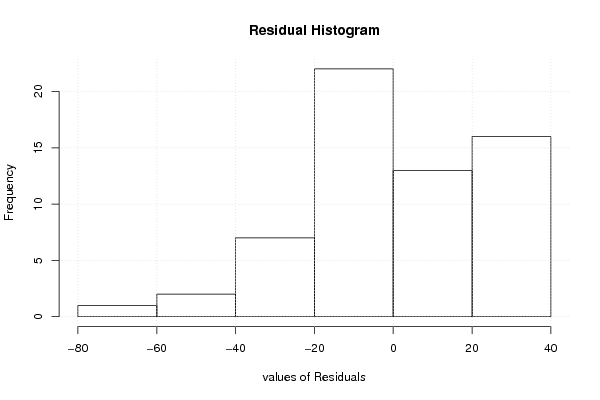
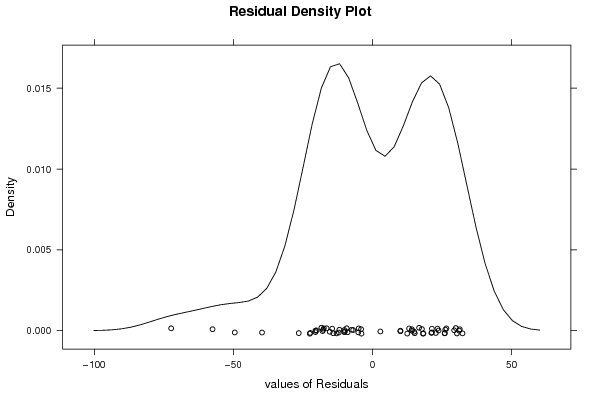
| Multiple Linear Regression - Residual Statistics | |
| Residual Standard Deviation | 26.4595327618816 |
| Sum Squared Residuals | 32905.0230769231 |
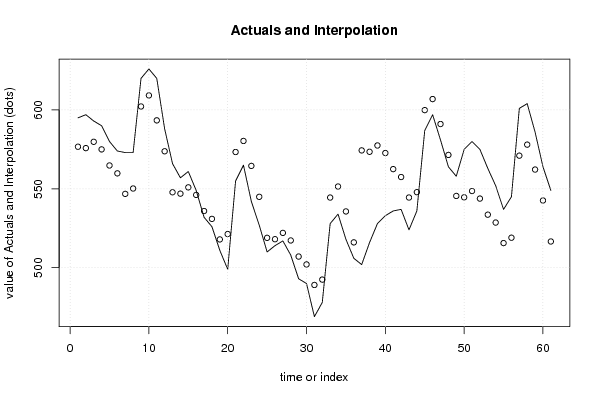
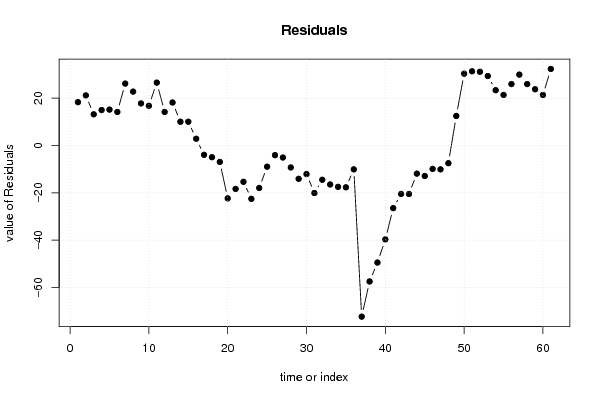
| Multiple Linear Regression - Actuals, Interpolation, and Residuals | |||
| Time or Index | Actuals | Interpolation Forecast | Residuals Prediction Error |
| 1 | 595 | 576.692307692308 | 18.3076923076922 |
| 2 | 597 | 575.820512820513 | 21.1794871794872 |
| 3 | 593 | 579.820512820513 | 13.1794871794872 |
| 4 | 590 | 575.020512820513 | 14.9794871794872 |
| 5 | 580 | 564.820512820513 | 15.1794871794872 |
| 6 | 574 | 559.820512820513 | 14.1794871794872 |
| 7 | 573 | 546.820512820513 | 26.1794871794872 |
| 8 | 573 | 550.220512820513 | 22.7794871794872 |
| 9 | 620 | 602.220512820513 | 17.7794871794872 |
| 10 | 626 | 609.220512820513 | 16.7794871794872 |
| 11 | 620 | 593.420512820513 | 26.5794871794872 |
| 12 | 588 | 573.820512820513 | 14.1794871794872 |
| 13 | 566 | 547.826923076923 | 18.1730769230769 |
| 14 | 557 | 546.955128205128 | 10.0448717948718 |
| 15 | 561 | 550.955128205128 | 10.0448717948718 |
| 16 | 549 | 546.155128205128 | 2.8448717948718 |
| 17 | 532 | 535.955128205128 | -3.95512820512821 |
| 18 | 526 | 530.955128205128 | -4.95512820512821 |
| 19 | 511 | 517.955128205128 | -6.95512820512821 |
| 20 | 499 | 521.355128205128 | -22.3551282051282 |
| 21 | 555 | 573.355128205128 | -18.3551282051282 |
| 22 | 565 | 580.355128205128 | -15.3551282051282 |
| 23 | 542 | 564.555128205128 | -22.5551282051282 |
| 24 | 527 | 544.955128205128 | -17.9551282051282 |
| 25 | 510 | 518.961538461538 | -8.96153846153846 |
| 26 | 514 | 518.089743589744 | -4.08974358974359 |
| 27 | 517 | 522.089743589744 | -5.08974358974359 |
| 28 | 508 | 517.289743589744 | -9.28974358974358 |
| 29 | 493 | 507.089743589744 | -14.0897435897436 |
| 30 | 490 | 502.089743589744 | -12.0897435897436 |
| 31 | 469 | 489.089743589744 | -20.0897435897436 |
| 32 | 478 | 492.489743589744 | -14.4897435897436 |
| 33 | 528 | 544.489743589744 | -16.4897435897436 |
| 34 | 534 | 551.489743589744 | -17.4897435897436 |
| 35 | 518 | 535.689743589744 | -17.6897435897436 |
| 36 | 506 | 516.089743589744 | -10.0897435897436 |
| 37 | 502 | 574.371794871795 | -72.3717948717948 |
| 38 | 516 | 573.5 | -57.5 |
| 39 | 528 | 577.5 | -49.5 |
| 40 | 533 | 572.7 | -39.7 |
| 41 | 536 | 562.5 | -26.5 |
| 42 | 537 | 557.5 | -20.5 |
| 43 | 524 | 544.5 | -20.5 |
| 44 | 536 | 547.9 | -11.9 |
| 45 | 587 | 599.9 | -12.9 |
| 46 | 597 | 606.9 | -9.9 |
| 47 | 581 | 591.1 | -10.1 |
| 48 | 564 | 571.5 | -7.5 |
| 49 | 558 | 545.50641025641 | 12.4935897435898 |
| 50 | 575 | 544.634615384615 | 30.3653846153846 |
| 51 | 580 | 548.634615384615 | 31.3653846153846 |
| 52 | 575 | 543.834615384615 | 31.1653846153846 |
| 53 | 563 | 533.634615384615 | 29.3653846153846 |
| 54 | 552 | 528.634615384615 | 23.3653846153846 |
| 55 | 537 | 515.634615384615 | 21.3653846153846 |
| 56 | 545 | 519.034615384615 | 25.9653846153846 |
| 57 | 601 | 571.034615384615 | 29.9653846153846 |
| 58 | 604 | 578.034615384615 | 25.9653846153846 |
| 59 | 586 | 562.234615384615 | 23.7653846153846 |
| 60 | 564 | 542.634615384615 | 21.3653846153846 |
| 61 | 549 | 516.641025641026 | 32.3589743589744 |
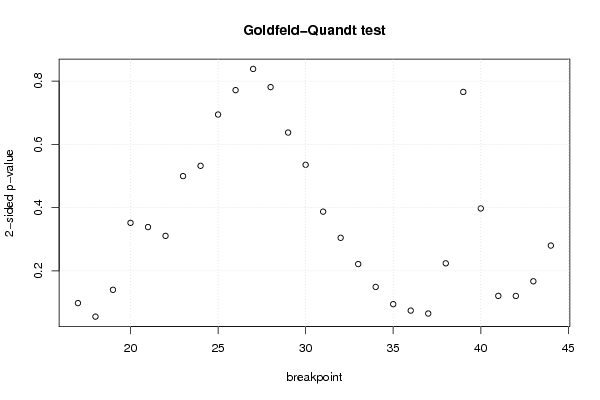
| Goldfeld-Quandt test for Heteroskedasticity | |||
| p-values | Alternative Hypothesis | ||
| breakpoint index | greater | 2-sided | less |
| 17 | 0.0492289757806347 | 0.0984579515612694 | 0.950771024219365 |
| 18 | 0.0277662392097252 | 0.0555324784194503 | 0.972233760790275 |
| 19 | 0.0701624381648925 | 0.140324876329785 | 0.929837561835107 |
| 20 | 0.175936254006816 | 0.351872508013633 | 0.824063745993184 |
| 21 | 0.169314894047161 | 0.338629788094322 | 0.83068510595284 |
| 22 | 0.155392268248701 | 0.310784536497403 | 0.844607731751299 |
| 23 | 0.249834754527521 | 0.499669509055043 | 0.750165245472479 |
| 24 | 0.266068000880031 | 0.532136001760062 | 0.733931999119969 |
| 25 | 0.347047031166653 | 0.694094062333306 | 0.652952968833347 |
| 26 | 0.38560873808002 | 0.771217476160041 | 0.61439126191998 |
| 27 | 0.419068192380137 | 0.838136384760274 | 0.580931807619863 |
| 28 | 0.390375806227709 | 0.780751612455419 | 0.609624193772291 |
| 29 | 0.318594113195091 | 0.637188226390181 | 0.68140588680491 |
| 30 | 0.267678680397589 | 0.535357360795178 | 0.732321319602411 |
| 31 | 0.193652170750432 | 0.387304341500863 | 0.806347829249568 |
| 32 | 0.152334385759281 | 0.304668771518561 | 0.84766561424072 |
| 33 | 0.110827801255978 | 0.221655602511957 | 0.889172198744022 |
| 34 | 0.0747266561803682 | 0.149453312360736 | 0.925273343819632 |
| 35 | 0.0474762473451781 | 0.0949524946903562 | 0.952523752654822 |
| 36 | 0.0373802881395213 | 0.0747605762790425 | 0.962619711860479 |
| 37 | 0.0327085150857523 | 0.0654170301715046 | 0.967291484914248 |
| 38 | 0.112011732241895 | 0.224023464483791 | 0.887988267758105 |
| 39 | 0.382764302188942 | 0.765528604377885 | 0.617235697811058 |
| 40 | 0.801271036620773 | 0.397457926758455 | 0.198728963379227 |
| 41 | 0.939399610478372 | 0.121200779043256 | 0.0606003895216282 |
| 42 | 0.93954362238339 | 0.120912755233221 | 0.0604563776166104 |
| 43 | 0.916371534367843 | 0.167256931264315 | 0.0836284656321574 |
| 44 | 0.85994475579212 | 0.280110488415759 | 0.14005524420788 |
| Meta Analysis of Goldfeld-Quandt test for Heteroskedasticity | |||
| Description | # significant tests | % significant tests | OK/NOK |
| 1% type I error level | 0 | 0 | OK |
| 5% type I error level | 0 | 0 | OK |
| 10% type I error level | 5 | 0.178571428571429 | NOK |