Free Statistics

of Irreproducible Research!

Author's title

Author*The author of this computation has been verified*
R Software Modulerwasp_pairs.wasp
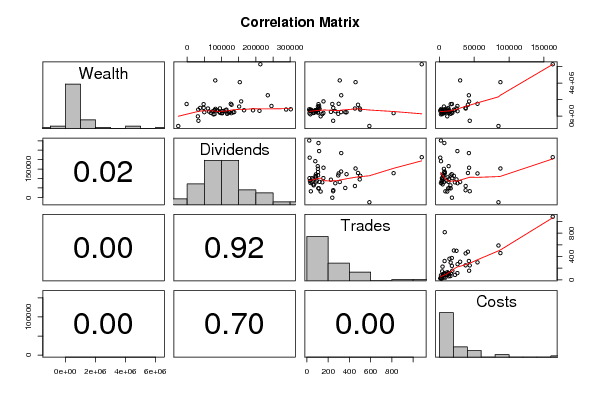
Title produced by softwareKendall tau Correlation Matrix
Date of computationFri, 24 Dec 2010 10:30:21 +0000
Cite this page as followsStatistical Computations at FreeStatistics.org, Office for Research Development and Education, URL https://freestatistics.org/blog/index.php?v=date/2010/Dec/24/t12931867454ggl750k6iex3z0.htm/, Retrieved Tue, 30 Apr 2024 02:25:11 +0000
Statistical Computations at FreeStatistics.org, Office for Research Development and Education, URL https://freestatistics.org/blog/index.php?pk=114718, Retrieved Tue, 30 Apr 2024 02:25:11 +0000
QR Codes:

Original text written by user:
IsPrivate?No (this computation is public)
User-defined keywords
Estimated Impact140
Family? (F = Feedback message, R = changed R code, M = changed R Module, P = changed Parameters, D = changed Data)
-     [Kendall tau Correlation Matrix] [] [2010-12-05 17:44:33] [b98453cac15ba1066b407e146608df68]
-   PD  [Kendall tau Correlation Matrix] [Pearson Correlation] [2010-12-21 14:12:00] [f1bd7399181c649098ca7b814ee0e027]
- RM D      [Kendall tau Correlation Matrix] [workshop 7] [2010-12-24 10:30:21] [d5e0edb7e0239841e94676417b2a1e2e] [Current]
Feedback Forum

Post a new message
Dataseries X:
6282929	213118	1081	162556
4324047	81767	309	29790
4108272	153198	458	87550
-1212617	-26007	588	84738
1485329	126942	299	54660
1779876	157214	156	42634
1367203	129352	481	40949
2519076	234817	323	42312
912684	60448	452	37704
1443586	47818	109	16275
1220017	245546	115	25830
984885	48020	110	12679
1457425	-1710	239	18014
-572920	32648	247	43556
929144	95350	497	24524
1151176	151352	103	6532
790090	288170	109	7123
774497	114337	502	20813
990576	37884	248	37597
454195	122844	373	17821
876607	82340	119	12988
711969	79801	84	22330
702380	165548	102	13326
264449	116384	295	16189
450033	134028	105	7146
541063	63838	64	15824
588864	74996	267	26088
-37216	31080	129	11326
783310	32168	37	8568
467359	49857	361	14416
688779	87161	28	3369
608419	106113	85	11819
696348	80570	44	6620
597793	102129	49	4519
821730	301670	22	2220
377934	102313	155	18562
651939	88577	91	10327
697458	112477	81	5336
700368	191778	79	2365
225986	79804	145	4069
348695	128294	816	7710
373683	96448	61	13718
501709	93811	226	4525
413743	117520	105	6869
379825	69159	62	4628
336260	101792	24	3653
636765	210568	26	1265
481231	136996	322	7489
469107	121920	84	4901
211928	76403	33	2284


Summary of computational transaction
Raw Inputview raw input (R code)
Raw Outputview raw output of R engine
Computing time2 seconds
R Server'Sir Ronald Aylmer Fisher' @ 193.190.124.24

\begin{tabular}{lllllllll}
\hline
Summary of computational transaction \tabularnewline
Raw Input & view raw input (R code)  \tabularnewline
Raw Output & view raw output of R engine  \tabularnewline
Computing time & 2 seconds \tabularnewline
R Server & 'Sir Ronald Aylmer Fisher' @ 193.190.124.24 \tabularnewline
\hline
\end{tabular}
%Source: https://freestatistics.org/blog/index.php?pk=114718&T=0

[TABLE]
[ROW][C]Summary of computational transaction[/C][/ROW]
[ROW][C]Raw Input[/C][C]view raw input (R code) [/C][/ROW]
[ROW][C]Raw Output[/C][C]view raw output of R engine [/C][/ROW]
[ROW][C]Computing time[/C][C]2 seconds[/C][/ROW]
[ROW][C]R Server[/C][C]'Sir Ronald Aylmer Fisher' @ 193.190.124.24[/C][/ROW]
[/TABLE]
Source: https://freestatistics.org/blog/index.php?pk=114718&T=0

Globally Unique Identifier (entire table): ba.freestatistics.org/blog/index.php?pk=114718&T=0

As an alternative you can also use a QR Code:  

The GUIDs for individual cells are displayed in the table below:

Summary of computational transaction
Raw Inputview raw input (R code)
Raw Outputview raw output of R engine
Computing time2 seconds
R Server'Sir Ronald Aylmer Fisher' @ 193.190.124.24


Correlations for all pairs of data series (method=pearson)
WealthDividendsTradesCosts
Wealth10.3380.4570.654
Dividends0.33810.0150.056
Trades0.4570.01510.739
Costs0.6540.0560.7391

\begin{tabular}{lllllllll}
\hline
Correlations for all pairs of data series (method=pearson) \tabularnewline
  & Wealth & Dividends & Trades & Costs \tabularnewline
Wealth & 1 & 0.338 & 0.457 & 0.654 \tabularnewline
Dividends & 0.338 & 1 & 0.015 & 0.056 \tabularnewline
Trades & 0.457 & 0.015 & 1 & 0.739 \tabularnewline
Costs & 0.654 & 0.056 & 0.739 & 1 \tabularnewline
\hline
\end{tabular}
%Source: https://freestatistics.org/blog/index.php?pk=114718&T=1

[TABLE]
[ROW][C]Correlations for all pairs of data series (method=pearson)[/C][/ROW]
[ROW][C] [/C][C]Wealth[/C][C]Dividends[/C][C]Trades[/C][C]Costs[/C][/ROW]
[ROW][C]Wealth[/C][C]1[/C][C]0.338[/C][C]0.457[/C][C]0.654[/C][/ROW]
[ROW][C]Dividends[/C][C]0.338[/C][C]1[/C][C]0.015[/C][C]0.056[/C][/ROW]
[ROW][C]Trades[/C][C]0.457[/C][C]0.015[/C][C]1[/C][C]0.739[/C][/ROW]
[ROW][C]Costs[/C][C]0.654[/C][C]0.056[/C][C]0.739[/C][C]1[/C][/ROW]
[/TABLE]
Source: https://freestatistics.org/blog/index.php?pk=114718&T=1

Globally Unique Identifier (entire table): ba.freestatistics.org/blog/index.php?pk=114718&T=1

As an alternative you can also use a QR Code:  

The GUIDs for individual cells are displayed in the table below:

Correlations for all pairs of data series (method=pearson)
WealthDividendsTradesCosts
Wealth10.3380.4570.654
Dividends0.33810.0150.056
Trades0.4570.01510.739
Costs0.6540.0560.7391


Correlations for all pairs of data series with p-values
pairPearson rSpearman rhoKendall tau
Wealth;Dividends0.33770.28590.1918
p-value(0.0165)(0.0445)(0.0493)
Wealth;Trades0.45680.21310.1602
p-value(9e-04)(0.1373)(0.1011)
Wealth;Costs0.65420.41620.3045
p-value(0)(0.0029)(0.0018)
Dividends;Trades0.01540.01110.0114
p-value(0.9157)(0.9391)(0.9068)
Dividends;Costs0.0556-0.106-0.0792
p-value(0.7016)(0.4627)(0.4171)
Trades;Costs0.73930.74040.5591
p-value(0)(0)(0)

\begin{tabular}{lllllllll}
\hline
Correlations for all pairs of data series with p-values \tabularnewline
pair & Pearson r & Spearman rho & Kendall tau \tabularnewline
Wealth;Dividends & 0.3377 & 0.2859 & 0.1918 \tabularnewline
p-value & (0.0165) & (0.0445) & (0.0493) \tabularnewline
Wealth;Trades & 0.4568 & 0.2131 & 0.1602 \tabularnewline
p-value & (9e-04) & (0.1373) & (0.1011) \tabularnewline
Wealth;Costs & 0.6542 & 0.4162 & 0.3045 \tabularnewline
p-value & (0) & (0.0029) & (0.0018) \tabularnewline
Dividends;Trades & 0.0154 & 0.0111 & 0.0114 \tabularnewline
p-value & (0.9157) & (0.9391) & (0.9068) \tabularnewline
Dividends;Costs & 0.0556 & -0.106 & -0.0792 \tabularnewline
p-value & (0.7016) & (0.4627) & (0.4171) \tabularnewline
Trades;Costs & 0.7393 & 0.7404 & 0.5591 \tabularnewline
p-value & (0) & (0) & (0) \tabularnewline
\hline
\end{tabular}
%Source: https://freestatistics.org/blog/index.php?pk=114718&T=2

[TABLE]
[ROW][C]Correlations for all pairs of data series with p-values[/C][/ROW]
[ROW][C]pair[/C][C]Pearson r[/C][C]Spearman rho[/C][C]Kendall tau[/C][/ROW]
[ROW][C]Wealth;Dividends[/C][C]0.3377[/C][C]0.2859[/C][C]0.1918[/C][/ROW]
[ROW][C]p-value[/C][C](0.0165)[/C][C](0.0445)[/C][C](0.0493)[/C][/ROW]
[ROW][C]Wealth;Trades[/C][C]0.4568[/C][C]0.2131[/C][C]0.1602[/C][/ROW]
[ROW][C]p-value[/C][C](9e-04)[/C][C](0.1373)[/C][C](0.1011)[/C][/ROW]
[ROW][C]Wealth;Costs[/C][C]0.6542[/C][C]0.4162[/C][C]0.3045[/C][/ROW]
[ROW][C]p-value[/C][C](0)[/C][C](0.0029)[/C][C](0.0018)[/C][/ROW]
[ROW][C]Dividends;Trades[/C][C]0.0154[/C][C]0.0111[/C][C]0.0114[/C][/ROW]
[ROW][C]p-value[/C][C](0.9157)[/C][C](0.9391)[/C][C](0.9068)[/C][/ROW]
[ROW][C]Dividends;Costs[/C][C]0.0556[/C][C]-0.106[/C][C]-0.0792[/C][/ROW]
[ROW][C]p-value[/C][C](0.7016)[/C][C](0.4627)[/C][C](0.4171)[/C][/ROW]
[ROW][C]Trades;Costs[/C][C]0.7393[/C][C]0.7404[/C][C]0.5591[/C][/ROW]
[ROW][C]p-value[/C][C](0)[/C][C](0)[/C][C](0)[/C][/ROW]
[/TABLE]
Source: https://freestatistics.org/blog/index.php?pk=114718&T=2

Globally Unique Identifier (entire table): ba.freestatistics.org/blog/index.php?pk=114718&T=2

As an alternative you can also use a QR Code:  

The GUIDs for individual cells are displayed in the table below:

Correlations for all pairs of data series with p-values
pairPearson rSpearman rhoKendall tau
Wealth;Dividends0.33770.28590.1918
p-value(0.0165)(0.0445)(0.0493)
Wealth;Trades0.45680.21310.1602
p-value(9e-04)(0.1373)(0.1011)
Wealth;Costs0.65420.41620.3045
p-value(0)(0.0029)(0.0018)
Dividends;Trades0.01540.01110.0114
p-value(0.9157)(0.9391)(0.9068)
Dividends;Costs0.0556-0.106-0.0792
p-value(0.7016)(0.4627)(0.4171)
Trades;Costs0.73930.74040.5591
p-value(0)(0)(0)


Parameters (Session):
par1 = pearson ;
Parameters (R input):
par1 = pearson ;
R code (references can be found in the software module):
panel.tau <- function(x, y, digits=2, prefix='', cex.cor)
{
usr <- par('usr'); on.exit(par(usr))
par(usr = c(0, 1, 0, 1))
rr <- cor.test(x, y, method=par1)
r <- round(rr$p.value,2)
txt <- format(c(r, 0.123456789), digits=digits)[1]
txt <- paste(prefix, txt, sep='')
if(missing(cex.cor)) cex <- 0.5/strwidth(txt)
text(0.5, 0.5, txt, cex = cex)
}
panel.hist <- function(x, ...)
{
usr <- par('usr'); on.exit(par(usr))
par(usr = c(usr[1:2], 0, 1.5) )
h <- hist(x, plot = FALSE)
breaks <- h$breaks; nB <- length(breaks)
y <- h$counts; y <- y/max(y)
rect(breaks[-nB], 0, breaks[-1], y, col='grey', ...)
}
bitmap(file='test1.png')
pairs(t(y),diag.panel=panel.hist, upper.panel=panel.smooth, lower.panel=panel.tau, main=main)
dev.off()
load(file='createtable')
n <- length(y[,1])
n
a<-table.start()
a<-table.row.start(a)
a<-table.element(a,paste('Correlations for all pairs of data series (method=',par1,')',sep=''),n+1,TRUE)
a<-table.row.end(a)
a<-table.row.start(a)
a<-table.element(a,' ',header=TRUE)
for (i in 1:n) {
a<-table.element(a,dimnames(t(x))[[2]][i],header=TRUE)
}
a<-table.row.end(a)
for (i in 1:n) {
a<-table.row.start(a)
a<-table.element(a,dimnames(t(x))[[2]][i],header=TRUE)
for (j in 1:n) {
r <- cor.test(y[i,],y[j,],method=par1)
a<-table.element(a,round(r$estimate,3))
}
a<-table.row.end(a)
}
a<-table.end(a)
table.save(a,file='mytable.tab')
a<-table.start()
a<-table.row.start(a)
a<-table.element(a,'Correlations for all pairs of data series with p-values',4,TRUE)
a<-table.row.end(a)
a<-table.row.start(a)
a<-table.element(a,'pair',1,TRUE)
a<-table.element(a,'Pearson r',1,TRUE)
a<-table.element(a,'Spearman rho',1,TRUE)
a<-table.element(a,'Kendall tau',1,TRUE)
a<-table.row.end(a)
cor.test(y[1,],y[2,],method=par1)
for (i in 1:(n-1))
{
for (j in (i+1):n)
{
a<-table.row.start(a)
dum <- paste(dimnames(t(x))[[2]][i],';',dimnames(t(x))[[2]][j],sep='')
a<-table.element(a,dum,header=TRUE)
rp <- cor.test(y[i,],y[j,],method='pearson')
a<-table.element(a,round(rp$estimate,4))
rs <- cor.test(y[i,],y[j,],method='spearman')
a<-table.element(a,round(rs$estimate,4))
rk <- cor.test(y[i,],y[j,],method='kendall')
a<-table.element(a,round(rk$estimate,4))
a<-table.row.end(a)
a<-table.row.start(a)
a<-table.element(a,'p-value',header=T)
a<-table.element(a,paste('(',round(rp$p.value,4),')',sep=''))
a<-table.element(a,paste('(',round(rs$p.value,4),')',sep=''))
a<-table.element(a,paste('(',round(rk$p.value,4),')',sep=''))
a<-table.row.end(a)
}
}
a<-table.end(a)
table.save(a,file='mytable1.tab')