| Multiple Linear Regression - Estimated Regression Equation |
| Y[t] = + 26.8125 -10.2767857142857X[t] + e[t] |
| Multiple Linear Regression - Ordinary Least Squares | |||||
| Variable | Parameter | S.D. | T-STAT H0: parameter = 0 | 2-tail p-value | 1-tail p-value |
| (Intercept) | 26.8125 | 0.958694 | 27.9677 | 0 | 0 |
| X | -10.2767857142857 | 1.403385 | -7.3229 | 0 | 0 |
| Multiple Linear Regression - Regression Statistics | |
| Multiple R | 0.693108686292623 |
| R-squared | 0.480399651014285 |
| Adjusted R-squared | 0.471441024307635 |
| F-TEST (value) | 53.6242514332772 |
| F-TEST (DF numerator) | 1 |
| F-TEST (DF denominator) | 58 |
| p-value | 8.403331364093e-10 |
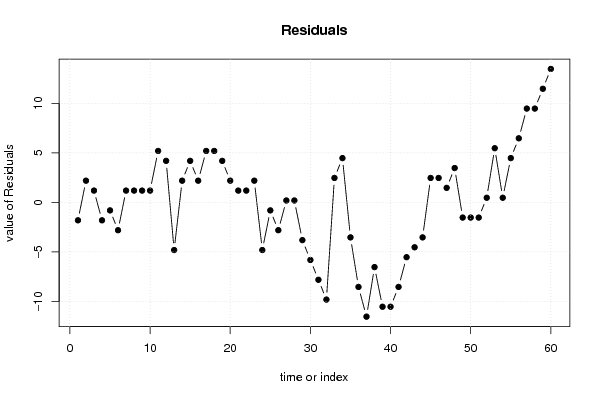
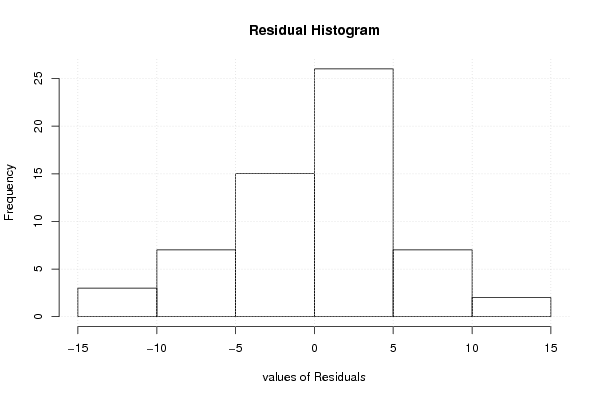
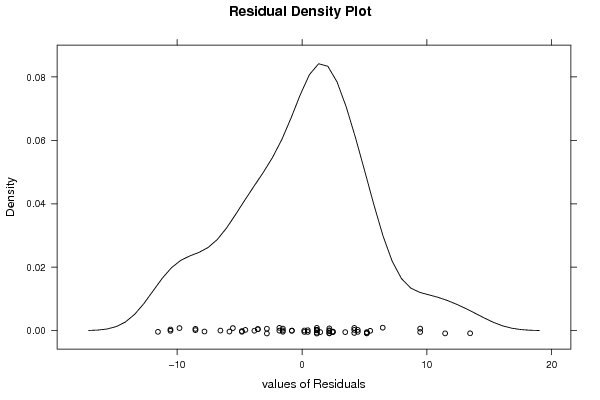
| Multiple Linear Regression - Residual Statistics | |
| Residual Standard Deviation | 5.42319298637691 |
| Sum Squared Residuals | 1705.83928571429 |
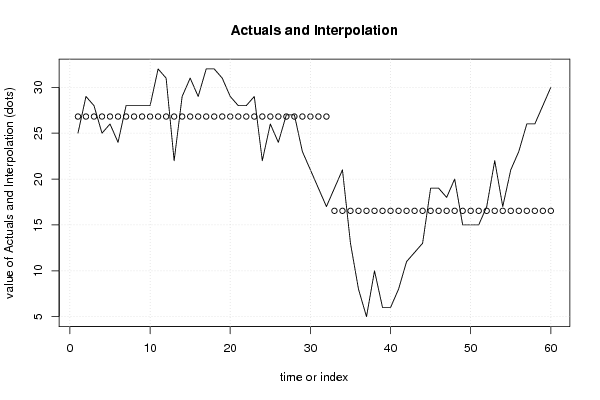
| Multiple Linear Regression - Actuals, Interpolation, and Residuals | |||
| Time or Index | Actuals | Interpolation Forecast | Residuals Prediction Error |
| 1 | 25 | 26.8125 | -1.81250000000003 |
| 2 | 29 | 26.8125 | 2.18750000000001 |
| 3 | 28 | 26.8125 | 1.1875 |
| 4 | 25 | 26.8125 | -1.8125 |
| 5 | 26 | 26.8125 | -0.812499999999999 |
| 6 | 24 | 26.8125 | -2.8125 |
| 7 | 28 | 26.8125 | 1.1875 |
| 8 | 28 | 26.8125 | 1.1875 |
| 9 | 28 | 26.8125 | 1.1875 |
| 10 | 28 | 26.8125 | 1.1875 |
| 11 | 32 | 26.8125 | 5.1875 |
| 12 | 31 | 26.8125 | 4.1875 |
| 13 | 22 | 26.8125 | -4.8125 |
| 14 | 29 | 26.8125 | 2.1875 |
| 15 | 31 | 26.8125 | 4.1875 |
| 16 | 29 | 26.8125 | 2.1875 |
| 17 | 32 | 26.8125 | 5.1875 |
| 18 | 32 | 26.8125 | 5.1875 |
| 19 | 31 | 26.8125 | 4.1875 |
| 20 | 29 | 26.8125 | 2.1875 |
| 21 | 28 | 26.8125 | 1.1875 |
| 22 | 28 | 26.8125 | 1.1875 |
| 23 | 29 | 26.8125 | 2.1875 |
| 24 | 22 | 26.8125 | -4.8125 |
| 25 | 26 | 26.8125 | -0.812499999999999 |
| 26 | 24 | 26.8125 | -2.8125 |
| 27 | 27 | 26.8125 | 0.187500000000001 |
| 28 | 27 | 26.8125 | 0.187500000000001 |
| 29 | 23 | 26.8125 | -3.8125 |
| 30 | 21 | 26.8125 | -5.8125 |
| 31 | 19 | 26.8125 | -7.8125 |
| 32 | 17 | 26.8125 | -9.8125 |
| 33 | 19 | 16.5357142857143 | 2.46428571428571 |
| 34 | 21 | 16.5357142857143 | 4.46428571428571 |
| 35 | 13 | 16.5357142857143 | -3.53571428571429 |
| 36 | 8 | 16.5357142857143 | -8.53571428571429 |
| 37 | 5 | 16.5357142857143 | -11.5357142857143 |
| 38 | 10 | 16.5357142857143 | -6.53571428571429 |
| 39 | 6 | 16.5357142857143 | -10.5357142857143 |
| 40 | 6 | 16.5357142857143 | -10.5357142857143 |
| 41 | 8 | 16.5357142857143 | -8.53571428571429 |
| 42 | 11 | 16.5357142857143 | -5.53571428571429 |
| 43 | 12 | 16.5357142857143 | -4.53571428571429 |
| 44 | 13 | 16.5357142857143 | -3.53571428571429 |
| 45 | 19 | 16.5357142857143 | 2.46428571428571 |
| 46 | 19 | 16.5357142857143 | 2.46428571428571 |
| 47 | 18 | 16.5357142857143 | 1.46428571428571 |
| 48 | 20 | 16.5357142857143 | 3.46428571428571 |
| 49 | 15 | 16.5357142857143 | -1.53571428571429 |
| 50 | 15 | 16.5357142857143 | -1.53571428571429 |
| 51 | 15 | 16.5357142857143 | -1.53571428571429 |
| 52 | 17 | 16.5357142857143 | 0.464285714285714 |
| 53 | 22 | 16.5357142857143 | 5.46428571428571 |
| 54 | 17 | 16.5357142857143 | 0.464285714285714 |
| 55 | 21 | 16.5357142857143 | 4.46428571428571 |
| 56 | 23 | 16.5357142857143 | 6.46428571428571 |
| 57 | 26 | 16.5357142857143 | 9.46428571428571 |
| 58 | 26 | 16.5357142857143 | 9.46428571428571 |
| 59 | 28 | 16.5357142857143 | 11.4642857142857 |
| 60 | 30 | 16.5357142857143 | 13.4642857142857 |
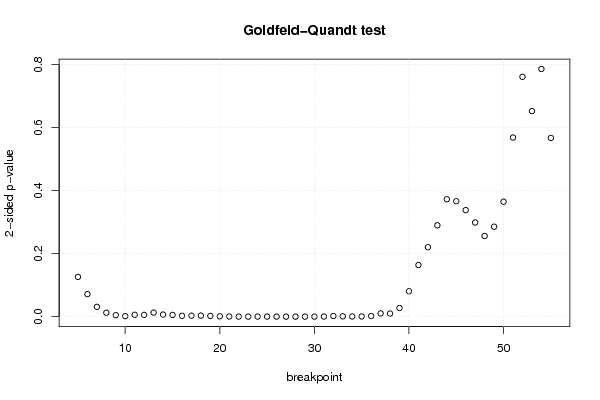
| Goldfeld-Quandt test for Heteroskedasticity | |||
| p-values | Alternative Hypothesis | ||
| breakpoint index | greater | 2-sided | less |
| 5 | 0.063005415896032 | 0.126010831792064 | 0.936994584103968 |
| 6 | 0.035760914901183 | 0.0715218298023661 | 0.964239085098817 |
| 7 | 0.0155757620529261 | 0.0311515241058522 | 0.984424237947074 |
| 8 | 0.00624208019889612 | 0.0124841603977922 | 0.993757919801104 |
| 9 | 0.00232623729068713 | 0.00465247458137426 | 0.997673762709313 |
| 10 | 0.000812055623307434 | 0.00162411124661487 | 0.999187944376693 |
| 11 | 0.0030151703755294 | 0.00603034075105881 | 0.99698482962447 |
| 12 | 0.00284378774556889 | 0.00568757549113778 | 0.997156212254431 |
| 13 | 0.00640102034055652 | 0.012802040681113 | 0.993598979659443 |
| 14 | 0.00330533321904937 | 0.00661066643809874 | 0.99669466678095 |
| 15 | 0.00280788517048332 | 0.00561577034096665 | 0.997192114829517 |
| 16 | 0.00137641468237527 | 0.00275282936475053 | 0.998623585317625 |
| 17 | 0.00157847630414347 | 0.00315695260828694 | 0.998421523695857 |
| 18 | 0.00165313192287955 | 0.00330626384575909 | 0.99834686807712 |
| 19 | 0.00121427285101439 | 0.00242854570202877 | 0.998785727148986 |
| 20 | 0.00061382297575724 | 0.00122764595151448 | 0.999386177024243 |
| 21 | 0.000291218827602133 | 0.000582437655204267 | 0.999708781172398 |
| 22 | 0.000136864109847651 | 0.000273728219695302 | 0.999863135890152 |
| 23 | 6.99821977393661e-05 | 0.000139964395478732 | 0.99993001780226 |
| 24 | 0.000182160752444697 | 0.000364321504889394 | 0.999817839247555 |
| 25 | 0.000100675883756273 | 0.000201351767512545 | 0.999899324116244 |
| 26 | 8.40566353535033e-05 | 0.000168113270707007 | 0.999915943364647 |
| 27 | 4.39044309983566e-05 | 8.78088619967132e-05 | 0.999956095569002 |
| 28 | 2.49016488668296e-05 | 4.98032977336593e-05 | 0.999975098351133 |
| 29 | 2.922088835233e-05 | 5.844177670466e-05 | 0.999970779111648 |
| 30 | 6.42600279423556e-05 | 0.000128520055884711 | 0.999935739972058 |
| 31 | 0.000230155506537021 | 0.000460311013074042 | 0.999769844493463 |
| 32 | 0.00103444480257762 | 0.00206888960515524 | 0.998965555197422 |
| 33 | 0.000551866566893975 | 0.00110373313378795 | 0.999448133433106 |
| 34 | 0.000333236890420668 | 0.000666473780841337 | 0.99966676310958 |
| 35 | 0.000340502789909968 | 0.000681005579819936 | 0.99965949721009 |
| 36 | 0.0010146996479211 | 0.0020293992958422 | 0.998985300352079 |
| 37 | 0.00514898003326687 | 0.0102979600665337 | 0.994851019966733 |
| 38 | 0.00495829377570153 | 0.00991658755140306 | 0.995041706224298 |
| 39 | 0.0136717119971305 | 0.0273434239942611 | 0.98632828800287 |
| 40 | 0.0403333404353633 | 0.0806666808707266 | 0.959666659564637 |
| 41 | 0.081896383365469 | 0.163792766730938 | 0.918103616634531 |
| 42 | 0.110148854397526 | 0.220297708795053 | 0.889851145602474 |
| 43 | 0.144898821810487 | 0.289797643620974 | 0.855101178189513 |
| 44 | 0.186143719972373 | 0.372287439944747 | 0.813856280027627 |
| 45 | 0.183036255514708 | 0.366072511029416 | 0.816963744485292 |
| 46 | 0.16888291322515 | 0.3377658264503 | 0.83111708677485 |
| 47 | 0.149273774682469 | 0.298547549364939 | 0.85072622531753 |
| 48 | 0.127970883766255 | 0.255941767532509 | 0.872029116233745 |
| 49 | 0.14260849643723 | 0.285216992874461 | 0.85739150356277 |
| 50 | 0.182275356153714 | 0.364550712307428 | 0.817724643846286 |
| 51 | 0.283996007414285 | 0.567992014828569 | 0.716003992585715 |
| 52 | 0.380291406893206 | 0.760582813786412 | 0.619708593106794 |
| 53 | 0.325923099008489 | 0.651846198016979 | 0.67407690099151 |
| 54 | 0.607233227982029 | 0.785533544035942 | 0.392766772017971 |
| 55 | 0.716646766037404 | 0.566706467925192 | 0.283353233962596 |
| Meta Analysis of Goldfeld-Quandt test for Heteroskedasticity | |||
| Description | # significant tests | % significant tests | OK/NOK |
| 1% type I error level | 28 | 0.549019607843137 | NOK |
| 5% type I error level | 33 | 0.647058823529412 | NOK |
| 10% type I error level | 35 | 0.686274509803922 | NOK |