| Multiple Linear Regression - Estimated Regression Equation |
| BBP[t] = -41.6811492212054 + 3.16889610067941inflatie[t] + 0.00567343605497845werkeloosheid[t] -23.2097331518104crisis[t] + 0.0599446430826951goudprijzen[t] + e[t] |
| Multiple Linear Regression - Ordinary Least Squares | |||||
| Variable | Parameter | S.D. | T-STAT H0: parameter = 0 | 2-tail p-value | 1-tail p-value |
| (Intercept) | -41.6811492212054 | 24.117987 | -1.7282 | 0.096283 | 0.048142 |
| inflatie | 3.16889610067941 | 0.209296 | 15.1407 | 0 | 0 |
| werkeloosheid | 0.00567343605497845 | 0.003256 | 1.7426 | 0.093701 | 0.04685 |
| crisis | -23.2097331518104 | 12.786228 | -1.8152 | 0.081507 | 0.040753 |
| goudprijzen | 0.0599446430826951 | 0.028657 | 2.0918 | 0.046772 | 0.023386 |
| Multiple Linear Regression - Regression Statistics | |
| Multiple R | 0.980500941008887 |
| R-squared | 0.961382095319312 |
| Adjusted R-squared | 0.955203230570402 |
| F-TEST (value) | 155.592027724656 |
| F-TEST (DF numerator) | 4 |
| F-TEST (DF denominator) | 25 |
| p-value | 0 |
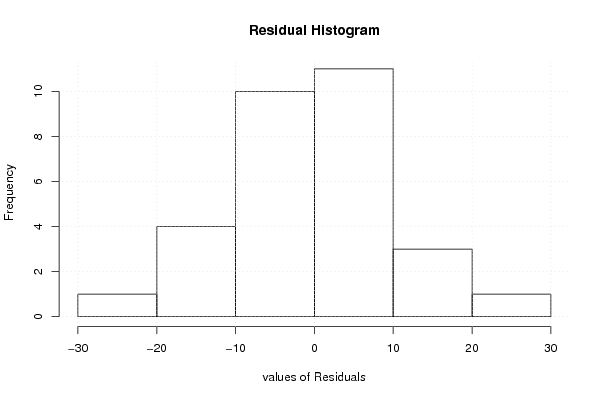
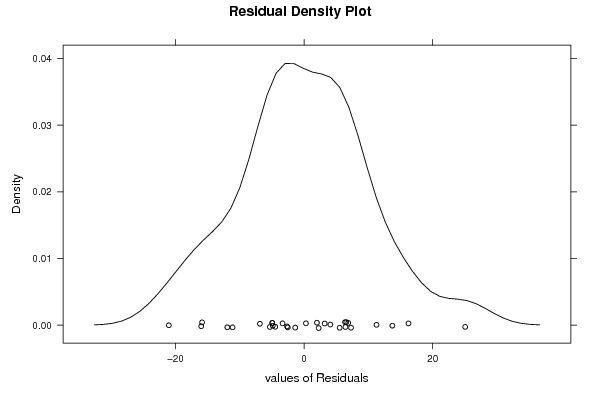
| Multiple Linear Regression - Residual Statistics | |
| Residual Standard Deviation | 10.7862985649051 |
| Sum Squared Residuals | 2908.60591828183 |
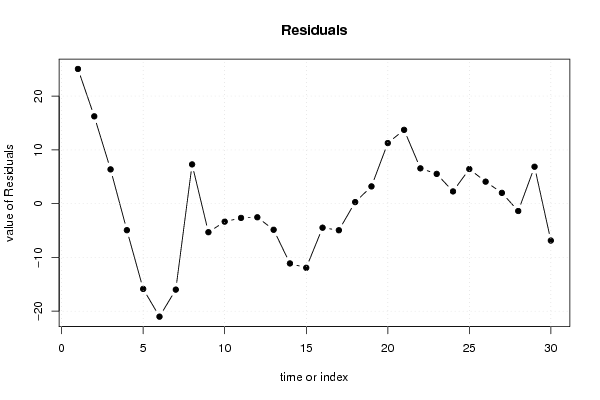
| Multiple Linear Regression - Actuals, Interpolation, and Residuals | |||
| Time or Index | Actuals | Interpolation Forecast | Residuals Prediction Error |
| 1 | 192.37 | 167.316335169016 | 25.0536648309844 |
| 2 | 192.65 | 176.411776865382 | 16.2382231346185 |
| 3 | 193.77 | 187.396857215788 | 6.3731427842122 |
| 4 | 194.54 | 199.474521456764 | -4.93452145676397 |
| 5 | 198.63 | 214.489614254944 | -15.8596142549439 |
| 6 | 202.3 | 223.319041512581 | -21.0190415125806 |
| 7 | 206.05 | 222.039118562327 | -15.9891185623273 |
| 8 | 210.94 | 203.639209932445 | 7.30079006755452 |
| 9 | 220.57 | 225.881287193154 | -5.31128719315402 |
| 10 | 228.55 | 231.896049235294 | -3.34604923529422 |
| 11 | 235.61 | 238.264998859863 | -2.65499885986310 |
| 12 | 239.86 | 242.39799790687 | -2.53799790686979 |
| 13 | 243.05 | 247.907867769367 | -4.85786776936749 |
| 14 | 241.37 | 252.489044275439 | -11.1190442754389 |
| 15 | 249.31 | 261.243197344172 | -11.9331973441723 |
| 16 | 259.98 | 264.452731531931 | -4.47273153193085 |
| 17 | 262.85 | 267.797743114206 | -4.94774311420593 |
| 18 | 273.13 | 272.838626795944 | 0.291373204055977 |
| 19 | 278.37 | 275.163448247558 | 3.20655175244219 |
| 20 | 288.19 | 276.923454328184 | 11.2665456718161 |
| 21 | 299.13 | 285.402854963202 | 13.7271450367984 |
| 22 | 301.26 | 294.696563358558 | 6.5634366414424 |
| 23 | 305.36 | 299.825975722814 | 5.53402427718565 |
| 24 | 307.75 | 305.476660112815 | 2.27333988718463 |
| 25 | 317.2 | 310.764567915614 | 6.4354320843858 |
| 26 | 323.6 | 319.511491117947 | 4.08850888205261 |
| 27 | 332.31 | 330.306838119436 | 2.00316188056382 |
| 28 | 341.59 | 342.962127118385 | -1.37212711838486 |
| 29 | 344.3 | 337.431854731635 | 6.86814526836491 |
| 30 | 335.17 | 342.038145268365 | -6.8681452683649 |
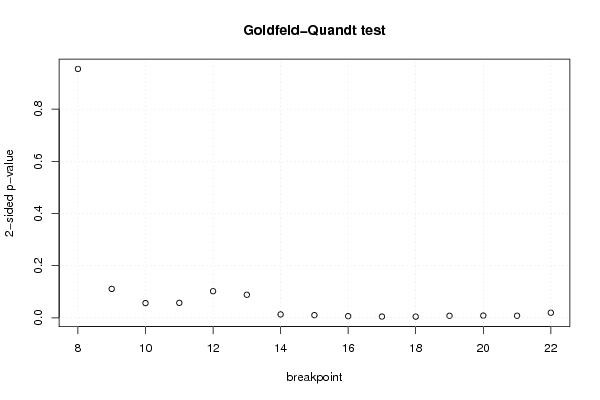
| Goldfeld-Quandt test for Heteroskedasticity | |||
| p-values | Alternative Hypothesis | ||
| breakpoint index | greater | 2-sided | less |
| 8 | 0.522958667634338 | 0.954082664731324 | 0.477041332365662 |
| 9 | 0.944671834825325 | 0.110656330349349 | 0.0553281651746746 |
| 10 | 0.97189781039741 | 0.0562043792051784 | 0.0281021896025892 |
| 11 | 0.971383023810047 | 0.0572339523799064 | 0.0286169761899532 |
| 12 | 0.949098058666294 | 0.101803882667411 | 0.0509019413337057 |
| 13 | 0.955923879321975 | 0.0881522413560494 | 0.0440761206780247 |
| 14 | 0.993590666074143 | 0.0128186678517130 | 0.00640933392585652 |
| 15 | 0.994962751273362 | 0.0100744974532759 | 0.00503724872663795 |
| 16 | 0.996938119009362 | 0.00612376198127564 | 0.00306188099063782 |
| 17 | 0.99767313633534 | 0.00465372732931796 | 0.00232686366465898 |
| 18 | 0.997872507738188 | 0.00425498452362321 | 0.00212749226181160 |
| 19 | 0.996154518006041 | 0.00769096398791697 | 0.00384548199395848 |
| 20 | 0.995848061440206 | 0.00830387711958749 | 0.00415193855979375 |
| 21 | 0.99615154391251 | 0.00769691217497738 | 0.00384845608748869 |
| 22 | 0.99035641171024 | 0.0192871765795186 | 0.00964358828975932 |
| Meta Analysis of Goldfeld-Quandt test for Heteroskedasticity | |||
| Description | # significant tests | % significant tests | OK/NOK |
| 1% type I error level | 6 | 0.4 | NOK |
| 5% type I error level | 9 | 0.6 | NOK |
| 10% type I error level | 12 | 0.8 | NOK |