Free Statistics

of Irreproducible Research!

Author's title

Author*The author of this computation has been verified*
R Software Modulerwasp_arimabackwardselection.wasp
Title produced by softwareARIMA Backward Selection
Date of computationThu, 23 Dec 2010 08:23:47 +0000
Cite this page as followsStatistical Computations at FreeStatistics.org, Office for Research Development and Education, URL https://freestatistics.org/blog/index.php?v=date/2010/Dec/23/t1293092524mhvinry1psiuokx.htm/, Retrieved Sun, 05 May 2024 08:19:56 +0000
Statistical Computations at FreeStatistics.org, Office for Research Development and Education, URL https://freestatistics.org/blog/index.php?pk=114648, Retrieved Sun, 05 May 2024 08:19:56 +0000
QR Codes:

Original text written by user:
IsPrivate?No (this computation is public)
User-defined keywords
Estimated Impact152
Family? (F = Feedback message, R = changed R code, M = changed R Module, P = changed Parameters, D = changed Data)
-       [ARIMA Backward Selection] [Arima model] [2010-12-23 08:23:47] [27f38de572a508a633f0ad2411de6a3e] [Current]
Feedback Forum

Post a new message
Dataseries X:
217,5
205
194
199,3
219,3
211,1
215,2
240,2
242,2
240,7
255,4
253
218,2
203,7
205,6
215,6
188,5
202,9
214
230,3
230
241
259,6
247,8
270,3
289,7
322,7
315
320,2
329,5
360,6
382,2
435,4
464
468,8
403
351,6
252
188
146,5
152,9
148,1
165,1
177
206,1
244,9
228,6
253,4
241,1
261,4
273,7
263,7
272,5
263,2
279,8
298,1
267,6
264,3
264,3
268,7
269,1


Summary of computational transaction
Raw Inputview raw input (R code)
Raw Outputview raw output of R engine
Computing time10 seconds
R Server'Sir Ronald Aylmer Fisher' @ 193.190.124.24

\begin{tabular}{lllllllll}
\hline
Summary of computational transaction \tabularnewline
Raw Input & view raw input (R code)  \tabularnewline
Raw Output & view raw output of R engine  \tabularnewline
Computing time & 10 seconds \tabularnewline
R Server & 'Sir Ronald Aylmer Fisher' @ 193.190.124.24 \tabularnewline
\hline
\end{tabular}
%Source: https://freestatistics.org/blog/index.php?pk=114648&T=0

[TABLE]
[ROW][C]Summary of computational transaction[/C][/ROW]
[ROW][C]Raw Input[/C][C]view raw input (R code) [/C][/ROW]
[ROW][C]Raw Output[/C][C]view raw output of R engine [/C][/ROW]
[ROW][C]Computing time[/C][C]10 seconds[/C][/ROW]
[ROW][C]R Server[/C][C]'Sir Ronald Aylmer Fisher' @ 193.190.124.24[/C][/ROW]
[/TABLE]
Source: https://freestatistics.org/blog/index.php?pk=114648&T=0

Globally Unique Identifier (entire table): ba.freestatistics.org/blog/index.php?pk=114648&T=0

As an alternative you can also use a QR Code:  

The GUIDs for individual cells are displayed in the table below:

Summary of computational transaction
Raw Inputview raw input (R code)
Raw Outputview raw output of R engine
Computing time10 seconds
R Server'Sir Ronald Aylmer Fisher' @ 193.190.124.24


ARIMA Parameter Estimation and Backward Selection
Iterationar1ar2ar3ma1sar1sar2sma1
Estimates ( 1 )1.1619-0.0508-0.372-0.7764-0.2067-0.2336-0.049
(p-val)(3e-04 )(0.8628 )(0.0455 )(0.0423 )(0.7239 )(0.2315 )(0.9389 )
Estimates ( 2 )1.1712-0.0574-0.3669-0.7903-0.2471-0.24060
(p-val)(0.0112 )(0.8862 )(0.1411 )(0.1687 )(0.3381 )(0.1621 )(NA )
Estimates ( 3 )1.12010-0.3987-0.7438-0.2624-0.24360
(p-val)(0 )(NA )(0 )(6e-04 )(0.1096 )(0.1255 )(NA )
Estimates ( 4 )1.20720-0.3599-1-0.102200
(p-val)(0 )(NA )(0 )(0 )(0.4648 )(NA )(NA )
Estimates ( 5 )1.21310-0.3577-1000
(p-val)(0 )(NA )(0 )(0 )(NA )(NA )(NA )
Estimates ( 6 )NANANANANANANA
(p-val)(NA )(NA )(NA )(NA )(NA )(NA )(NA )
Estimates ( 7 )NANANANANANANA
(p-val)(NA )(NA )(NA )(NA )(NA )(NA )(NA )
Estimates ( 8 )NANANANANANANA
(p-val)(NA )(NA )(NA )(NA )(NA )(NA )(NA )
Estimates ( 9 )NANANANANANANA
(p-val)(NA )(NA )(NA )(NA )(NA )(NA )(NA )
Estimates ( 10 )NANANANANANANA
(p-val)(NA )(NA )(NA )(NA )(NA )(NA )(NA )
Estimates ( 11 )NANANANANANANA
(p-val)(NA )(NA )(NA )(NA )(NA )(NA )(NA )
Estimates ( 12 )NANANANANANANA
(p-val)(NA )(NA )(NA )(NA )(NA )(NA )(NA )
Estimates ( 13 )NANANANANANANA
(p-val)(NA )(NA )(NA )(NA )(NA )(NA )(NA )

\begin{tabular}{lllllllll}
\hline
ARIMA Parameter Estimation and Backward Selection \tabularnewline
Iteration & ar1 & ar2 & ar3 & ma1 & sar1 & sar2 & sma1 \tabularnewline
Estimates ( 1 ) & 1.1619 & -0.0508 & -0.372 & -0.7764 & -0.2067 & -0.2336 & -0.049 \tabularnewline
(p-val) & (3e-04 ) & (0.8628 ) & (0.0455 ) & (0.0423 ) & (0.7239 ) & (0.2315 ) & (0.9389 ) \tabularnewline
Estimates ( 2 ) & 1.1712 & -0.0574 & -0.3669 & -0.7903 & -0.2471 & -0.2406 & 0 \tabularnewline
(p-val) & (0.0112 ) & (0.8862 ) & (0.1411 ) & (0.1687 ) & (0.3381 ) & (0.1621 ) & (NA ) \tabularnewline
Estimates ( 3 ) & 1.1201 & 0 & -0.3987 & -0.7438 & -0.2624 & -0.2436 & 0 \tabularnewline
(p-val) & (0 ) & (NA ) & (0 ) & (6e-04 ) & (0.1096 ) & (0.1255 ) & (NA ) \tabularnewline
Estimates ( 4 ) & 1.2072 & 0 & -0.3599 & -1 & -0.1022 & 0 & 0 \tabularnewline
(p-val) & (0 ) & (NA ) & (0 ) & (0 ) & (0.4648 ) & (NA ) & (NA ) \tabularnewline
Estimates ( 5 ) & 1.2131 & 0 & -0.3577 & -1 & 0 & 0 & 0 \tabularnewline
(p-val) & (0 ) & (NA ) & (0 ) & (0 ) & (NA ) & (NA ) & (NA ) \tabularnewline
Estimates ( 6 ) & NA & NA & NA & NA & NA & NA & NA \tabularnewline
(p-val) & (NA ) & (NA ) & (NA ) & (NA ) & (NA ) & (NA ) & (NA ) \tabularnewline
Estimates ( 7 ) & NA & NA & NA & NA & NA & NA & NA \tabularnewline
(p-val) & (NA ) & (NA ) & (NA ) & (NA ) & (NA ) & (NA ) & (NA ) \tabularnewline
Estimates ( 8 ) & NA & NA & NA & NA & NA & NA & NA \tabularnewline
(p-val) & (NA ) & (NA ) & (NA ) & (NA ) & (NA ) & (NA ) & (NA ) \tabularnewline
Estimates ( 9 ) & NA & NA & NA & NA & NA & NA & NA \tabularnewline
(p-val) & (NA ) & (NA ) & (NA ) & (NA ) & (NA ) & (NA ) & (NA ) \tabularnewline
Estimates ( 10 ) & NA & NA & NA & NA & NA & NA & NA \tabularnewline
(p-val) & (NA ) & (NA ) & (NA ) & (NA ) & (NA ) & (NA ) & (NA ) \tabularnewline
Estimates ( 11 ) & NA & NA & NA & NA & NA & NA & NA \tabularnewline
(p-val) & (NA ) & (NA ) & (NA ) & (NA ) & (NA ) & (NA ) & (NA ) \tabularnewline
Estimates ( 12 ) & NA & NA & NA & NA & NA & NA & NA \tabularnewline
(p-val) & (NA ) & (NA ) & (NA ) & (NA ) & (NA ) & (NA ) & (NA ) \tabularnewline
Estimates ( 13 ) & NA & NA & NA & NA & NA & NA & NA \tabularnewline
(p-val) & (NA ) & (NA ) & (NA ) & (NA ) & (NA ) & (NA ) & (NA ) \tabularnewline
\hline
\end{tabular}
%Source: https://freestatistics.org/blog/index.php?pk=114648&T=1

[TABLE]
[ROW][C]ARIMA Parameter Estimation and Backward Selection[/C][/ROW]
[ROW][C]Iteration[/C][C]ar1[/C][C]ar2[/C][C]ar3[/C][C]ma1[/C][C]sar1[/C][C]sar2[/C][C]sma1[/C][/ROW]
[ROW][C]Estimates ( 1 )[/C][C]1.1619[/C][C]-0.0508[/C][C]-0.372[/C][C]-0.7764[/C][C]-0.2067[/C][C]-0.2336[/C][C]-0.049[/C][/ROW]
[ROW][C](p-val)[/C][C](3e-04 )[/C][C](0.8628 )[/C][C](0.0455 )[/C][C](0.0423 )[/C][C](0.7239 )[/C][C](0.2315 )[/C][C](0.9389 )[/C][/ROW]
[ROW][C]Estimates ( 2 )[/C][C]1.1712[/C][C]-0.0574[/C][C]-0.3669[/C][C]-0.7903[/C][C]-0.2471[/C][C]-0.2406[/C][C]0[/C][/ROW]
[ROW][C](p-val)[/C][C](0.0112 )[/C][C](0.8862 )[/C][C](0.1411 )[/C][C](0.1687 )[/C][C](0.3381 )[/C][C](0.1621 )[/C][C](NA )[/C][/ROW]
[ROW][C]Estimates ( 3 )[/C][C]1.1201[/C][C]0[/C][C]-0.3987[/C][C]-0.7438[/C][C]-0.2624[/C][C]-0.2436[/C][C]0[/C][/ROW]
[ROW][C](p-val)[/C][C](0 )[/C][C](NA )[/C][C](0 )[/C][C](6e-04 )[/C][C](0.1096 )[/C][C](0.1255 )[/C][C](NA )[/C][/ROW]
[ROW][C]Estimates ( 4 )[/C][C]1.2072[/C][C]0[/C][C]-0.3599[/C][C]-1[/C][C]-0.1022[/C][C]0[/C][C]0[/C][/ROW]
[ROW][C](p-val)[/C][C](0 )[/C][C](NA )[/C][C](0 )[/C][C](0 )[/C][C](0.4648 )[/C][C](NA )[/C][C](NA )[/C][/ROW]
[ROW][C]Estimates ( 5 )[/C][C]1.2131[/C][C]0[/C][C]-0.3577[/C][C]-1[/C][C]0[/C][C]0[/C][C]0[/C][/ROW]
[ROW][C](p-val)[/C][C](0 )[/C][C](NA )[/C][C](0 )[/C][C](0 )[/C][C](NA )[/C][C](NA )[/C][C](NA )[/C][/ROW]
[ROW][C]Estimates ( 6 )[/C][C]NA[/C][C]NA[/C][C]NA[/C][C]NA[/C][C]NA[/C][C]NA[/C][C]NA[/C][/ROW]
[ROW][C](p-val)[/C][C](NA )[/C][C](NA )[/C][C](NA )[/C][C](NA )[/C][C](NA )[/C][C](NA )[/C][C](NA )[/C][/ROW]
[ROW][C]Estimates ( 7 )[/C][C]NA[/C][C]NA[/C][C]NA[/C][C]NA[/C][C]NA[/C][C]NA[/C][C]NA[/C][/ROW]
[ROW][C](p-val)[/C][C](NA )[/C][C](NA )[/C][C](NA )[/C][C](NA )[/C][C](NA )[/C][C](NA )[/C][C](NA )[/C][/ROW]
[ROW][C]Estimates ( 8 )[/C][C]NA[/C][C]NA[/C][C]NA[/C][C]NA[/C][C]NA[/C][C]NA[/C][C]NA[/C][/ROW]
[ROW][C](p-val)[/C][C](NA )[/C][C](NA )[/C][C](NA )[/C][C](NA )[/C][C](NA )[/C][C](NA )[/C][C](NA )[/C][/ROW]
[ROW][C]Estimates ( 9 )[/C][C]NA[/C][C]NA[/C][C]NA[/C][C]NA[/C][C]NA[/C][C]NA[/C][C]NA[/C][/ROW]
[ROW][C](p-val)[/C][C](NA )[/C][C](NA )[/C][C](NA )[/C][C](NA )[/C][C](NA )[/C][C](NA )[/C][C](NA )[/C][/ROW]
[ROW][C]Estimates ( 10 )[/C][C]NA[/C][C]NA[/C][C]NA[/C][C]NA[/C][C]NA[/C][C]NA[/C][C]NA[/C][/ROW]
[ROW][C](p-val)[/C][C](NA )[/C][C](NA )[/C][C](NA )[/C][C](NA )[/C][C](NA )[/C][C](NA )[/C][C](NA )[/C][/ROW]
[ROW][C]Estimates ( 11 )[/C][C]NA[/C][C]NA[/C][C]NA[/C][C]NA[/C][C]NA[/C][C]NA[/C][C]NA[/C][/ROW]
[ROW][C](p-val)[/C][C](NA )[/C][C](NA )[/C][C](NA )[/C][C](NA )[/C][C](NA )[/C][C](NA )[/C][C](NA )[/C][/ROW]
[ROW][C]Estimates ( 12 )[/C][C]NA[/C][C]NA[/C][C]NA[/C][C]NA[/C][C]NA[/C][C]NA[/C][C]NA[/C][/ROW]
[ROW][C](p-val)[/C][C](NA )[/C][C](NA )[/C][C](NA )[/C][C](NA )[/C][C](NA )[/C][C](NA )[/C][C](NA )[/C][/ROW]
[ROW][C]Estimates ( 13 )[/C][C]NA[/C][C]NA[/C][C]NA[/C][C]NA[/C][C]NA[/C][C]NA[/C][C]NA[/C][/ROW]
[ROW][C](p-val)[/C][C](NA )[/C][C](NA )[/C][C](NA )[/C][C](NA )[/C][C](NA )[/C][C](NA )[/C][C](NA )[/C][/ROW]
[/TABLE]
Source: https://freestatistics.org/blog/index.php?pk=114648&T=1

Globally Unique Identifier (entire table): ba.freestatistics.org/blog/index.php?pk=114648&T=1

As an alternative you can also use a QR Code:  

The GUIDs for individual cells are displayed in the table below:

ARIMA Parameter Estimation and Backward Selection
Iterationar1ar2ar3ma1sar1sar2sma1
Estimates ( 1 )1.1619-0.0508-0.372-0.7764-0.2067-0.2336-0.049
(p-val)(3e-04 )(0.8628 )(0.0455 )(0.0423 )(0.7239 )(0.2315 )(0.9389 )
Estimates ( 2 )1.1712-0.0574-0.3669-0.7903-0.2471-0.24060
(p-val)(0.0112 )(0.8862 )(0.1411 )(0.1687 )(0.3381 )(0.1621 )(NA )
Estimates ( 3 )1.12010-0.3987-0.7438-0.2624-0.24360
(p-val)(0 )(NA )(0 )(6e-04 )(0.1096 )(0.1255 )(NA )
Estimates ( 4 )1.20720-0.3599-1-0.102200
(p-val)(0 )(NA )(0 )(0 )(0.4648 )(NA )(NA )
Estimates ( 5 )1.21310-0.3577-1000
(p-val)(0 )(NA )(0 )(0 )(NA )(NA )(NA )
Estimates ( 6 )NANANANANANANA
(p-val)(NA )(NA )(NA )(NA )(NA )(NA )(NA )
Estimates ( 7 )NANANANANANANA
(p-val)(NA )(NA )(NA )(NA )(NA )(NA )(NA )
Estimates ( 8 )NANANANANANANA
(p-val)(NA )(NA )(NA )(NA )(NA )(NA )(NA )
Estimates ( 9 )NANANANANANANA
(p-val)(NA )(NA )(NA )(NA )(NA )(NA )(NA )
Estimates ( 10 )NANANANANANANA
(p-val)(NA )(NA )(NA )(NA )(NA )(NA )(NA )
Estimates ( 11 )NANANANANANANA
(p-val)(NA )(NA )(NA )(NA )(NA )(NA )(NA )
Estimates ( 12 )NANANANANANANA
(p-val)(NA )(NA )(NA )(NA )(NA )(NA )(NA )
Estimates ( 13 )NANANANANANANA
(p-val)(NA )(NA )(NA )(NA )(NA )(NA )(NA )


Estimated ARIMA Residuals
Value
0.217499822516866
-9.78478953094158
-4.69092289728636
10.8303737739891
17.4025635868567
-18.695949344517
-1.45165150662704
24.2055636204555
-7.85142459641661
-9.4984274601968
15.4524605741829
-4.57316796503045
-35.3790647494429
-1.71841266886546
16.4887231604473
12.3672525241091
-30.5270631334762
14.0831320895415
12.2671755298376
7.6573009730872
-10.2588701804503
4.98218909929218
18.2374731745486
-18.1217207388952
19.2509327179740
20.7168346335646
27.0084172311441
-13.1935985382014
3.91871968362315
23.2274665865825
39.0004011190054
23.2030259046977
50.985499051697
26.9190549927636
5.61997889463015
-49.70729388275
-6.42398274476005
-41.6977425555609
-7.92694134412627
5.34208987982118
27.7759340629904
-6.52456657092852
3.12509229100933
-4.61574932357839
11.4276121576526
18.3833489895730
-42.4568062507692
7.51193809087255
-16.7513836179227
8.95264961600874
8.81854600123269
-18.5966360042492
11.7598212958319
-7.41354314708516
17.5247266754596
17.9797835233522
-36.4653940696526
4.31529911509816
8.75602862255269
7.65533116235876
-1.38678324054813

\begin{tabular}{lllllllll}
\hline
Estimated ARIMA Residuals \tabularnewline
Value \tabularnewline
0.217499822516866 \tabularnewline
-9.78478953094158 \tabularnewline
-4.69092289728636 \tabularnewline
10.8303737739891 \tabularnewline
17.4025635868567 \tabularnewline
-18.695949344517 \tabularnewline
-1.45165150662704 \tabularnewline
24.2055636204555 \tabularnewline
-7.85142459641661 \tabularnewline
-9.4984274601968 \tabularnewline
15.4524605741829 \tabularnewline
-4.57316796503045 \tabularnewline
-35.3790647494429 \tabularnewline
-1.71841266886546 \tabularnewline
16.4887231604473 \tabularnewline
12.3672525241091 \tabularnewline
-30.5270631334762 \tabularnewline
14.0831320895415 \tabularnewline
12.2671755298376 \tabularnewline
7.6573009730872 \tabularnewline
-10.2588701804503 \tabularnewline
4.98218909929218 \tabularnewline
18.2374731745486 \tabularnewline
-18.1217207388952 \tabularnewline
19.2509327179740 \tabularnewline
20.7168346335646 \tabularnewline
27.0084172311441 \tabularnewline
-13.1935985382014 \tabularnewline
3.91871968362315 \tabularnewline
23.2274665865825 \tabularnewline
39.0004011190054 \tabularnewline
23.2030259046977 \tabularnewline
50.985499051697 \tabularnewline
26.9190549927636 \tabularnewline
5.61997889463015 \tabularnewline
-49.70729388275 \tabularnewline
-6.42398274476005 \tabularnewline
-41.6977425555609 \tabularnewline
-7.92694134412627 \tabularnewline
5.34208987982118 \tabularnewline
27.7759340629904 \tabularnewline
-6.52456657092852 \tabularnewline
3.12509229100933 \tabularnewline
-4.61574932357839 \tabularnewline
11.4276121576526 \tabularnewline
18.3833489895730 \tabularnewline
-42.4568062507692 \tabularnewline
7.51193809087255 \tabularnewline
-16.7513836179227 \tabularnewline
8.95264961600874 \tabularnewline
8.81854600123269 \tabularnewline
-18.5966360042492 \tabularnewline
11.7598212958319 \tabularnewline
-7.41354314708516 \tabularnewline
17.5247266754596 \tabularnewline
17.9797835233522 \tabularnewline
-36.4653940696526 \tabularnewline
4.31529911509816 \tabularnewline
8.75602862255269 \tabularnewline
7.65533116235876 \tabularnewline
-1.38678324054813 \tabularnewline
\hline
\end{tabular}
%Source: https://freestatistics.org/blog/index.php?pk=114648&T=2

[TABLE]
[ROW][C]Estimated ARIMA Residuals[/C][/ROW]
[ROW][C]Value[/C][/ROW]
[ROW][C]0.217499822516866[/C][/ROW]
[ROW][C]-9.78478953094158[/C][/ROW]
[ROW][C]-4.69092289728636[/C][/ROW]
[ROW][C]10.8303737739891[/C][/ROW]
[ROW][C]17.4025635868567[/C][/ROW]
[ROW][C]-18.695949344517[/C][/ROW]
[ROW][C]-1.45165150662704[/C][/ROW]
[ROW][C]24.2055636204555[/C][/ROW]
[ROW][C]-7.85142459641661[/C][/ROW]
[ROW][C]-9.4984274601968[/C][/ROW]
[ROW][C]15.4524605741829[/C][/ROW]
[ROW][C]-4.57316796503045[/C][/ROW]
[ROW][C]-35.3790647494429[/C][/ROW]
[ROW][C]-1.71841266886546[/C][/ROW]
[ROW][C]16.4887231604473[/C][/ROW]
[ROW][C]12.3672525241091[/C][/ROW]
[ROW][C]-30.5270631334762[/C][/ROW]
[ROW][C]14.0831320895415[/C][/ROW]
[ROW][C]12.2671755298376[/C][/ROW]
[ROW][C]7.6573009730872[/C][/ROW]
[ROW][C]-10.2588701804503[/C][/ROW]
[ROW][C]4.98218909929218[/C][/ROW]
[ROW][C]18.2374731745486[/C][/ROW]
[ROW][C]-18.1217207388952[/C][/ROW]
[ROW][C]19.2509327179740[/C][/ROW]
[ROW][C]20.7168346335646[/C][/ROW]
[ROW][C]27.0084172311441[/C][/ROW]
[ROW][C]-13.1935985382014[/C][/ROW]
[ROW][C]3.91871968362315[/C][/ROW]
[ROW][C]23.2274665865825[/C][/ROW]
[ROW][C]39.0004011190054[/C][/ROW]
[ROW][C]23.2030259046977[/C][/ROW]
[ROW][C]50.985499051697[/C][/ROW]
[ROW][C]26.9190549927636[/C][/ROW]
[ROW][C]5.61997889463015[/C][/ROW]
[ROW][C]-49.70729388275[/C][/ROW]
[ROW][C]-6.42398274476005[/C][/ROW]
[ROW][C]-41.6977425555609[/C][/ROW]
[ROW][C]-7.92694134412627[/C][/ROW]
[ROW][C]5.34208987982118[/C][/ROW]
[ROW][C]27.7759340629904[/C][/ROW]
[ROW][C]-6.52456657092852[/C][/ROW]
[ROW][C]3.12509229100933[/C][/ROW]
[ROW][C]-4.61574932357839[/C][/ROW]
[ROW][C]11.4276121576526[/C][/ROW]
[ROW][C]18.3833489895730[/C][/ROW]
[ROW][C]-42.4568062507692[/C][/ROW]
[ROW][C]7.51193809087255[/C][/ROW]
[ROW][C]-16.7513836179227[/C][/ROW]
[ROW][C]8.95264961600874[/C][/ROW]
[ROW][C]8.81854600123269[/C][/ROW]
[ROW][C]-18.5966360042492[/C][/ROW]
[ROW][C]11.7598212958319[/C][/ROW]
[ROW][C]-7.41354314708516[/C][/ROW]
[ROW][C]17.5247266754596[/C][/ROW]
[ROW][C]17.9797835233522[/C][/ROW]
[ROW][C]-36.4653940696526[/C][/ROW]
[ROW][C]4.31529911509816[/C][/ROW]
[ROW][C]8.75602862255269[/C][/ROW]
[ROW][C]7.65533116235876[/C][/ROW]
[ROW][C]-1.38678324054813[/C][/ROW]
[/TABLE]
Source: https://freestatistics.org/blog/index.php?pk=114648&T=2

Globally Unique Identifier (entire table): ba.freestatistics.org/blog/index.php?pk=114648&T=2

As an alternative you can also use a QR Code:  

The GUIDs for individual cells are displayed in the table below:

Estimated ARIMA Residuals
Value
0.217499822516866
-9.78478953094158
-4.69092289728636
10.8303737739891
17.4025635868567
-18.695949344517
-1.45165150662704
24.2055636204555
-7.85142459641661
-9.4984274601968
15.4524605741829
-4.57316796503045
-35.3790647494429
-1.71841266886546
16.4887231604473
12.3672525241091
-30.5270631334762
14.0831320895415
12.2671755298376
7.6573009730872
-10.2588701804503
4.98218909929218
18.2374731745486
-18.1217207388952
19.2509327179740
20.7168346335646
27.0084172311441
-13.1935985382014
3.91871968362315
23.2274665865825
39.0004011190054
23.2030259046977
50.985499051697
26.9190549927636
5.61997889463015
-49.70729388275
-6.42398274476005
-41.6977425555609
-7.92694134412627
5.34208987982118
27.7759340629904
-6.52456657092852
3.12509229100933
-4.61574932357839
11.4276121576526
18.3833489895730
-42.4568062507692
7.51193809087255
-16.7513836179227
8.95264961600874
8.81854600123269
-18.5966360042492
11.7598212958319
-7.41354314708516
17.5247266754596
17.9797835233522
-36.4653940696526
4.31529911509816
8.75602862255269
7.65533116235876
-1.38678324054813


Parameters (Session):
par1 = FALSE ; par2 = 1 ; par3 = 1 ; par4 = 0 ; par5 = 12 ; par6 = 3 ; par7 = 1 ; par8 = 2 ; par9 = 1 ;
Parameters (R input):
par1 = FALSE ; par2 = 1 ; par3 = 1 ; par4 = 0 ; par5 = 12 ; par6 = 3 ; par7 = 1 ; par8 = 2 ; par9 = 1 ;
R code (references can be found in the software module):
library(lattice)
if (par1 == 'TRUE') par1 <- TRUE
if (par1 == 'FALSE') par1 <- FALSE
par2 <- as.numeric(par2) #Box-Cox lambda transformation parameter
par3 <- as.numeric(par3) #degree of non-seasonal differencing
par4 <- as.numeric(par4) #degree of seasonal differencing
par5 <- as.numeric(par5) #seasonal period
par6 <- as.numeric(par6) #degree (p) of the non-seasonal AR(p) polynomial
par7 <- as.numeric(par7) #degree (q) of the non-seasonal MA(q) polynomial
par8 <- as.numeric(par8) #degree (P) of the seasonal AR(P) polynomial
par9 <- as.numeric(par9) #degree (Q) of the seasonal MA(Q) polynomial
armaGR <- function(arima.out, names, n){
try1 <- arima.out$coef
try2 <- sqrt(diag(arima.out$var.coef))
try.data.frame <- data.frame(matrix(NA,ncol=4,nrow=length(names)))
dimnames(try.data.frame) <- list(names,c('coef','std','tstat','pv'))
try.data.frame[,1] <- try1
for(i in 1:length(try2)) try.data.frame[which(rownames(try.data.frame)==names(try2)[i]),2] <- try2[i]
try.data.frame[,3] <- try.data.frame[,1] / try.data.frame[,2]
try.data.frame[,4] <- round((1-pt(abs(try.data.frame[,3]),df=n-(length(try2)+1)))*2,5)
vector <- rep(NA,length(names))
vector[is.na(try.data.frame[,4])] <- 0
maxi <- which.max(try.data.frame[,4])
continue <- max(try.data.frame[,4],na.rm=TRUE) > .05
vector[maxi] <- 0
list(summary=try.data.frame,next.vector=vector,continue=continue)
}
arimaSelect <- function(series, order=c(13,0,0), seasonal=list(order=c(2,0,0),period=12), include.mean=F){
nrc <- order[1]+order[3]+seasonal$order[1]+seasonal$order[3]
coeff <- matrix(NA, nrow=nrc*2, ncol=nrc)
pval <- matrix(NA, nrow=nrc*2, ncol=nrc)
mylist <- rep(list(NULL), nrc)
names <- NULL
if(order[1] > 0) names <- paste('ar',1:order[1],sep='')
if(order[3] > 0) names <- c( names , paste('ma',1:order[3],sep='') )
if(seasonal$order[1] > 0) names <- c(names, paste('sar',1:seasonal$order[1],sep=''))
if(seasonal$order[3] > 0) names <- c(names, paste('sma',1:seasonal$order[3],sep=''))
arima.out <- arima(series, order=order, seasonal=seasonal, include.mean=include.mean, method='ML')
mylist[[1]] <- arima.out
last.arma <- armaGR(arima.out, names, length(series))
mystop <- FALSE
i <- 1
coeff[i,] <- last.arma[[1]][,1]
pval [i,] <- last.arma[[1]][,4]
i <- 2
aic <- arima.out$aic
while(!mystop){
mylist[[i]] <- arima.out
arima.out <- arima(series, order=order, seasonal=seasonal, include.mean=include.mean, method='ML', fixed=last.arma$next.vector)
aic <- c(aic, arima.out$aic)
last.arma <- armaGR(arima.out, names, length(series))
mystop <- !last.arma$continue
coeff[i,] <- last.arma[[1]][,1]
pval [i,] <- last.arma[[1]][,4]
i <- i+1
}
list(coeff, pval, mylist, aic=aic)
}
arimaSelectplot <- function(arimaSelect.out,noms,choix){
noms <- names(arimaSelect.out[[3]][[1]]$coef)
coeff <- arimaSelect.out[[1]]
k <- min(which(is.na(coeff[,1])))-1
coeff <- coeff[1:k,]
pval <- arimaSelect.out[[2]][1:k,]
aic <- arimaSelect.out$aic[1:k]
coeff[coeff==0] <- NA
n <- ncol(coeff)
if(missing(choix)) choix <- k
layout(matrix(c(1,1,1,2,
3,3,3,2,
3,3,3,4,
5,6,7,7),nr=4),
widths=c(10,35,45,15),
heights=c(30,30,15,15))
couleurs <- rainbow(75)[1:50]#(50)
ticks <- pretty(coeff)
par(mar=c(1,1,3,1))
plot(aic,k:1-.5,type='o',pch=21,bg='blue',cex=2,axes=F,lty=2,xpd=NA)
points(aic[choix],k-choix+.5,pch=21,cex=4,bg=2,xpd=NA)
title('aic',line=2)
par(mar=c(3,0,0,0))
plot(0,axes=F,xlab='',ylab='',xlim=range(ticks),ylim=c(.1,1))
rect(xleft = min(ticks) + (0:49)/50*(max(ticks)-min(ticks)),
xright = min(ticks) + (1:50)/50*(max(ticks)-min(ticks)),
ytop = rep(1,50),
ybottom= rep(0,50),col=couleurs,border=NA)
axis(1,ticks)
rect(xleft=min(ticks),xright=max(ticks),ytop=1,ybottom=0)
text(mean(coeff,na.rm=T),.5,'coefficients',cex=2,font=2)
par(mar=c(1,1,3,1))
image(1:n,1:k,t(coeff[k:1,]),axes=F,col=couleurs,zlim=range(ticks))
for(i in 1:n) for(j in 1:k) if(!is.na(coeff[j,i])) {
if(pval[j,i]<.01) symb = 'green'
else if( (pval[j,i]<.05) & (pval[j,i]>=.01)) symb = 'orange'
else if( (pval[j,i]<.1) & (pval[j,i]>=.05)) symb = 'red'
else symb = 'black'
polygon(c(i+.5 ,i+.2 ,i+.5 ,i+.5),
c(k-j+0.5,k-j+0.5,k-j+0.8,k-j+0.5),
col=symb)
if(j==choix) {
rect(xleft=i-.5,
xright=i+.5,
ybottom=k-j+1.5,
ytop=k-j+.5,
lwd=4)
text(i,
k-j+1,
round(coeff[j,i],2),
cex=1.2,
font=2)
}
else{
rect(xleft=i-.5,xright=i+.5,ybottom=k-j+1.5,ytop=k-j+.5)
text(i,k-j+1,round(coeff[j,i],2),cex=1.2,font=1)
}
}
axis(3,1:n,noms)
par(mar=c(0.5,0,0,0.5))
plot(0,axes=F,xlab='',ylab='',type='n',xlim=c(0,8),ylim=c(-.2,.8))
cols <- c('green','orange','red','black')
niv <- c('0','0.01','0.05','0.1')
for(i in 0:3){
polygon(c(1+2*i ,1+2*i ,1+2*i-.5 ,1+2*i),
c(.4 ,.7 , .4 , .4),
col=cols[i+1])
text(2*i,0.5,niv[i+1],cex=1.5)
}
text(8,.5,1,cex=1.5)
text(4,0,'p-value',cex=2)
box()
residus <- arimaSelect.out[[3]][[choix]]$res
par(mar=c(1,2,4,1))
acf(residus,main='')
title('acf',line=.5)
par(mar=c(1,2,4,1))
pacf(residus,main='')
title('pacf',line=.5)
par(mar=c(2,2,4,1))
qqnorm(residus,main='')
title('qq-norm',line=.5)
qqline(residus)
residus
}
if (par2 == 0) x <- log(x)
if (par2 != 0) x <- x^par2
(selection <- arimaSelect(x, order=c(par6,par3,par7), seasonal=list(order=c(par8,par4,par9), period=par5)))
bitmap(file='test1.png')
resid <- arimaSelectplot(selection)
dev.off()
resid
bitmap(file='test2.png')
acf(resid,length(resid)/2, main='Residual Autocorrelation Function')
dev.off()
bitmap(file='test3.png')
pacf(resid,length(resid)/2, main='Residual Partial Autocorrelation Function')
dev.off()
bitmap(file='test4.png')
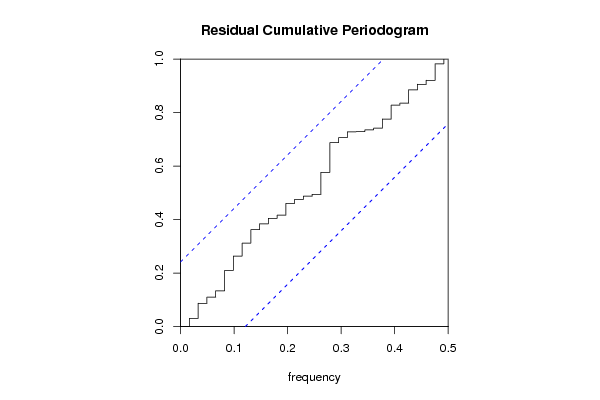
cpgram(resid, main='Residual Cumulative Periodogram')
dev.off()
bitmap(file='test5.png')
hist(resid, main='Residual Histogram', xlab='values of Residuals')
dev.off()
bitmap(file='test6.png')
densityplot(~resid,col='black',main='Residual Density Plot', xlab='values of Residuals')
dev.off()
bitmap(file='test7.png')
qqnorm(resid, main='Residual Normal Q-Q Plot')
qqline(resid)
dev.off()
ncols <- length(selection[[1]][1,])
nrows <- length(selection[[2]][,1])-1
load(file='createtable')
a<-table.start()
a<-table.row.start(a)
a<-table.element(a,'ARIMA Parameter Estimation and Backward Selection', ncols+1,TRUE)
a<-table.row.end(a)
a<-table.row.start(a)
a<-table.element(a,'Iteration', header=TRUE)
for (i in 1:ncols) {
a<-table.element(a,names(selection[[3]][[1]]$coef)[i],header=TRUE)
}
a<-table.row.end(a)
for (j in 1:nrows) {
a<-table.row.start(a)
mydum <- 'Estimates ('
mydum <- paste(mydum,j)
mydum <- paste(mydum,')')
a<-table.element(a,mydum, header=TRUE)
for (i in 1:ncols) {
a<-table.element(a,round(selection[[1]][j,i],4))
}
a<-table.row.end(a)
a<-table.row.start(a)
a<-table.element(a,'(p-val)', header=TRUE)
for (i in 1:ncols) {
mydum <- '('
mydum <- paste(mydum,round(selection[[2]][j,i],4),sep='')
mydum <- paste(mydum,')')
a<-table.element(a,mydum)
}
a<-table.row.end(a)
}
a<-table.end(a)
table.save(a,file='mytable.tab')
a<-table.start()
a<-table.row.start(a)
a<-table.element(a,'Estimated ARIMA Residuals', 1,TRUE)
a<-table.row.end(a)
a<-table.row.start(a)
a<-table.element(a,'Value', 1,TRUE)
a<-table.row.end(a)
for (i in (par4*par5+par3):length(resid)) {
a<-table.row.start(a)
a<-table.element(a,resid[i])
a<-table.row.end(a)
}
a<-table.end(a)
table.save(a,file='mytable1.tab')