| Multiple Linear Regression - Estimated Regression Equation |
| SWS[t] = + 13.6544237163211 -0.0585807794285882PS[t] -0.00582010443309297L[t] + 0.00110522505298075Wb[t] + 0.000312379340050593Wbr[t] -0.0164356921292093tg[t] + 1.2609612380151P[t] + 0.241262992690819S[t] -2.58964116718938D[t] + e[t] |
| Multiple Linear Regression - Ordinary Least Squares | |||||
| Variable | Parameter | S.D. | T-STAT H0: parameter = 0 | 2-tail p-value | 1-tail p-value |
| (Intercept) | 13.6544237163211 | 2.594061 | 5.2637 | 1.1e-05 | 6e-06 |
| PS | -0.0585807794285882 | 0.605897 | -0.0967 | 0.92362 | 0.46181 |
| L | -0.00582010443309297 | 0.035279 | -0.165 | 0.870073 | 0.435036 |
| Wb | 0.00110522505298075 | 0.002207 | 0.5009 | 0.620117 | 0.310058 |
| Wbr | 0.000312379340050593 | 0.000499 | 0.6256 | 0.536337 | 0.268168 |
| tg | -0.0164356921292093 | 0.008345 | -1.9695 | 0.058188 | 0.029094 |
| P | 1.2609612380151 | 1.275144 | 0.9889 | 0.330632 | 0.165316 |
| S | 0.241262992690819 | 0.696365 | 0.3465 | 0.731415 | 0.365707 |
| D | -2.58964116718938 | 1.730261 | -1.4967 | 0.144925 | 0.072463 |
| Multiple Linear Regression - Regression Statistics | |
| Multiple R | 0.74423501919545 |
| R-squared | 0.553885763796852 |
| Adjusted R-squared | 0.434921967476012 |
| F-TEST (value) | 4.65591869902209 |
| F-TEST (DF numerator) | 8 |
| F-TEST (DF denominator) | 30 |
| p-value | 0.000891925292758833 |
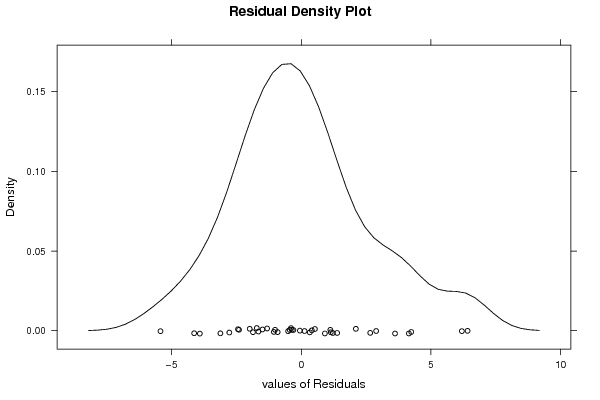
| Multiple Linear Regression - Residual Statistics | |
| Residual Standard Deviation | 2.98304296750641 |
| Sum Squared Residuals | 266.956360379684 |
| Multiple Linear Regression - Actuals, Interpolation, and Residuals | |||
| Time or Index | Actuals | Interpolation Forecast | Residuals Prediction Error |
| 1 | 6.3 | 9.07916275195347 | -2.77916275195347 |
| 2 | 2.1 | 1.77504353977628 | 0.324956460223719 |
| 3 | 9.1 | 6.21591423768404 | 2.88408576231596 |
| 4 | 15.8 | 11.6528296652932 | 4.14717033470676 |
| 5 | 5.2 | 3.09734381117883 | 2.10265618882117 |
| 6 | 10.9 | 11.4106115920988 | -0.510611592098838 |
| 7 | 8.3 | 8.60887472565052 | -0.308874725650516 |
| 8 | 11 | 10.5960052867276 | 0.403994713272354 |
| 9 | 3.2 | 3.56682929280814 | -0.366829292808135 |
| 10 | 6.3 | 11.733775455182 | -5.43377545518198 |
| 11 | 6.6 | 10.5161498810283 | -3.91614988102834 |
| 12 | 9.5 | 9.3782637081414 | 0.121736291858607 |
| 13 | 3.3 | 5.70565826947588 | -2.40565826947588 |
| 14 | 11 | 12.0148889636112 | -1.01488896361121 |
| 15 | 4.7 | 7.82344016928446 | -3.12344016928446 |
| 16 | 10.4 | 11.7211755730369 | -1.32117557303688 |
| 17 | 7.4 | 9.11859725411626 | -1.71859725411626 |
| 18 | 2.1 | 3.16078777136038 | -1.06078777136038 |
| 19 | 17.9 | 11.4884672552113 | 6.41153274478873 |
| 20 | 6.1 | 7.96622773926668 | -1.86622773926668 |
| 21 | 11.9 | 10.7637010335183 | 1.13629896648167 |
| 22 | 13.8 | 13.277433697769 | 0.522566302230992 |
| 23 | 14.3 | 11.6434958518618 | 2.65650414813817 |
| 24 | 15.2 | 9.00867867689247 | 6.19132132310753 |
| 25 | 10 | 6.38737537202304 | 3.61262462797696 |
| 26 | 11.9 | 10.7831649129275 | 1.11683508707251 |
| 27 | 6.5 | 7.41463656630172 | -0.91463656630172 |
| 28 | 7.5 | 7.55689084926392 | -0.0568908492639201 |
| 29 | 10.6 | 9.3857358531867 | 1.2142641468133 |
| 30 | 7.4 | 11.5351444418837 | -4.13514444188371 |
| 31 | 8.4 | 8.84975079520995 | -0.449750795209949 |
| 32 | 5.7 | 7.69276686643702 | -1.99276686643702 |
| 33 | 4.9 | 6.3992069451267 | -1.4992069451267 |
| 34 | 3.2 | 5.64479934962703 | -2.44479934962703 |
| 35 | 11 | 10.0930659491079 | 0.906934050892101 |
| 36 | 4.9 | 6.55562003867326 | -1.65562003867326 |
| 37 | 13.2 | 11.8197088684708 | 1.3802911315292 |
| 38 | 9.7 | 5.45991555120597 | 4.24008444879403 |
| 39 | 12.8 | 13.1988614376274 | -0.398861437627432 |
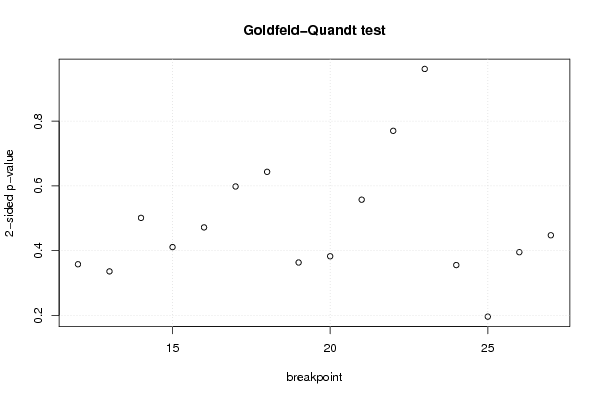
| Goldfeld-Quandt test for Heteroskedasticity | |||
| p-values | Alternative Hypothesis | ||
| breakpoint index | greater | 2-sided | less |
| 12 | 0.820863069402362 | 0.358273861195277 | 0.179136930597638 |
| 13 | 0.831889546357414 | 0.336220907285172 | 0.168110453642586 |
| 14 | 0.749297529977673 | 0.501404940044655 | 0.250702470022328 |
| 15 | 0.794385022877853 | 0.411229954244294 | 0.205614977122147 |
| 16 | 0.763978637230043 | 0.472042725539914 | 0.236021362769957 |
| 17 | 0.700805956408394 | 0.598388087183213 | 0.299194043591606 |
| 18 | 0.678162941497959 | 0.643674117004083 | 0.321837058502041 |
| 19 | 0.818191340692061 | 0.363617318615878 | 0.181808659307939 |
| 20 | 0.808549600487798 | 0.382900799024403 | 0.191450399512202 |
| 21 | 0.72121021810061 | 0.557579563798779 | 0.27878978189939 |
| 22 | 0.614869004945441 | 0.770261990109118 | 0.385130995054559 |
| 23 | 0.519338919298104 | 0.96132216140379 | 0.480661080701896 |
| 24 | 0.822144874617383 | 0.355710250765233 | 0.177855125382617 |
| 25 | 0.901774891526338 | 0.196450216947324 | 0.098225108473662 |
| 26 | 0.802272518833691 | 0.395454962332618 | 0.197727481166309 |
| 27 | 0.776116035175417 | 0.447767929649167 | 0.223883964824583 |
| Meta Analysis of Goldfeld-Quandt test for Heteroskedasticity | |||
| Description | # significant tests | % significant tests | OK/NOK |
| 1% type I error level | 0 | 0 | OK |
| 5% type I error level | 0 | 0 | OK |
| 10% type I error level | 0 | 0 | OK |